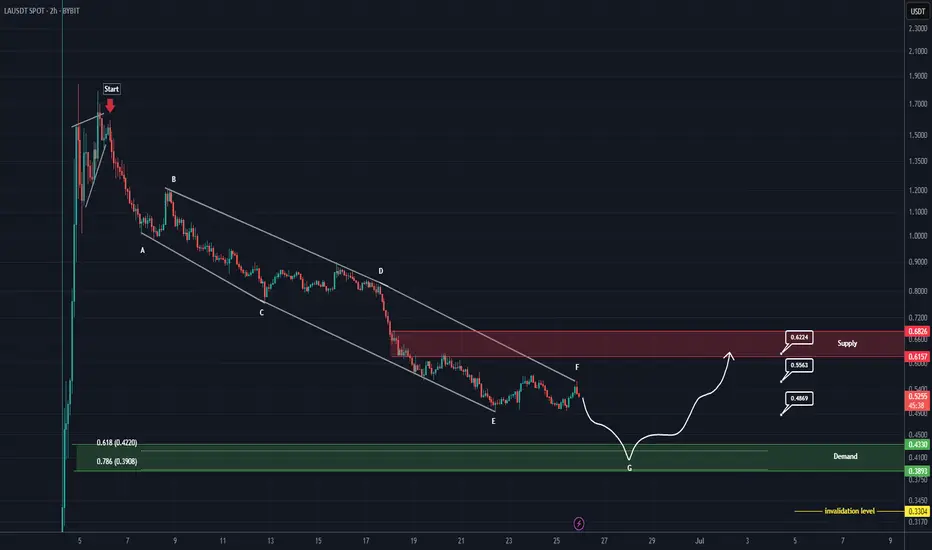
LA Analysis (2H)From the point where we placed the red arrow on the chart, it appears that LA has entered a correction phase.
There isn’t much data available for this coin, but the correction seems to be forming a diametric pattern.
We’ve highlighted the most optimal zone for the completion of the final wave of this diametric (wave G) with a green area on the chart.
Targets are marked on the chart.
A daily candle closing below the invalidation level will invalidate this analysis.
For risk management, please don't forget stop loss and capital management
Comment if you have any questions
Thank You
LAUSDT.P trade ideas
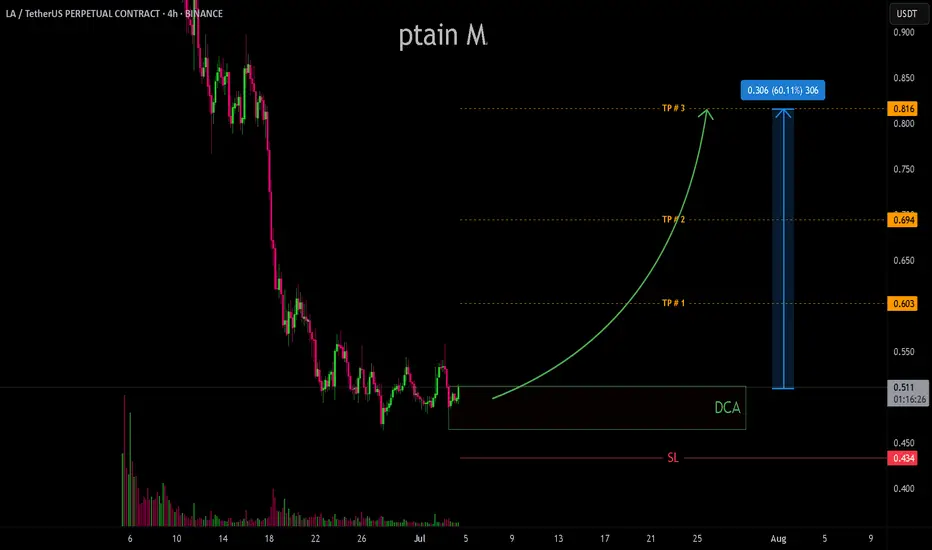
LA/USDT 50-60% move LA/USDT has successfully found solid support after a prolonged downtrend and is showing early signs of a potential reversal. The price has established a strong base, indicating accumulation in the current range. With volume gradually picking up and market sentiment shifting, LA is now poised for a breakout and trend continuation move.
We're looking at a potential upside of 50–60% from the current level if the setup plays out as expected.