Buy Trade Strategy for LDO: Leveraging Liquid Staking Adoption GDescription:
This trading idea highlights LDO, the governance token of Lido Finance, the leading liquid staking protocol in the crypto industry. LDO enables holders to participate in governance decisions that shape the platform’s development, while Lido itself allows users to stake assets like Ethereum and receive liquid tokens in return, unlocking liquidity and yield opportunities simultaneously. As Ethereum staking adoption grows post-merge and more networks integrate with Lido, the demand for its services and governance relevance of LDO are expected to strengthen. Backed by strong partnerships, continuous protocol upgrades, and dominant market share in liquid staking, LDO stands out as a key player in the evolving DeFi landscape.
Still, investors should be aware that cryptocurrency markets are highly volatile and subject to risks from regulatory changes, market sentiment shifts, and technological challenges. Proper risk management is essential when considering LDO as part of an investment strategy.
Disclaimer:
This trading idea is provided for educational purposes only and should not be considered financial advice. Cryptocurrencies like LDO involve substantial risk, including the possibility of losing your entire investment. Always conduct your own research, assess your financial position, and seek advice from a qualified financial professional before making any investment decisions. Past performance is not indicative of future results.
LDOUSDT trade ideas
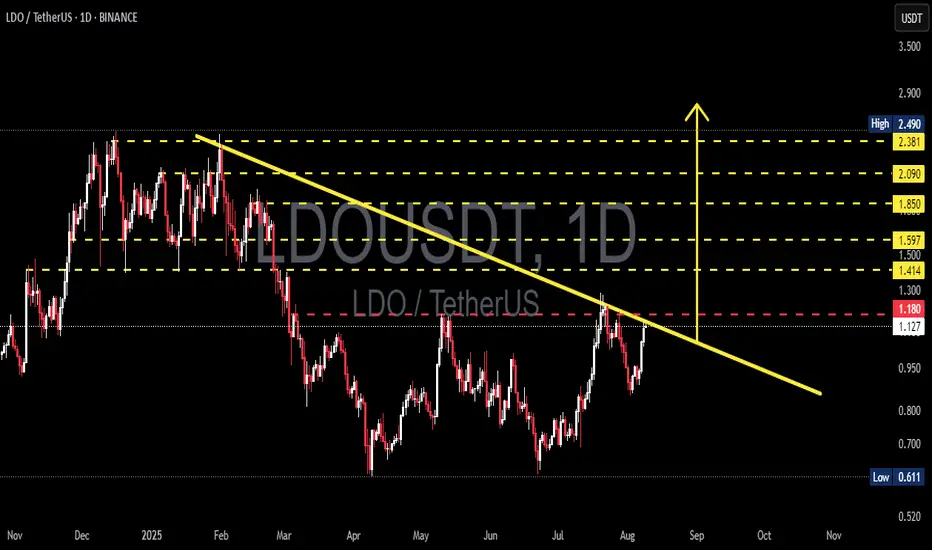
LDO/USDT — Testing the Downtrend Line: Breakout or Rejection?Summary
LDO price is currently testing the descending trendline (yellow) connecting this year’s major highs. This zone coincides with a key horizontal resistance around 1.18–1.30. Price action in this area will determine the next move — either a sustained breakout towards higher supply zones or a rejection leading to renewed bearish pressure.
---
Key Levels (from chart)
Immediate resistance / quick supply zone: ~1.18 (red line) — short-term key.
Descending trendline (yellow): dynamic resistance, currently intersecting near 1.18–1.30.
Staged resistance targets (yellow dashed lines): 1.414 → 1.50 → 1.597 → 1.85 → 2.09 → 2.38 → 2.49.
Main supports: 0.95–1.00 (intraday), and major swing low 0.611.
---
Pattern / Structure Analysis
Mid-term trend — bearish: a clear series of lower highs since the start of the year, marked by a descending supply line.
Current condition — accumulation pressure: after months of sideways consolidation, price is rallying into trendline resistance — often a decisive point leading to either breakout or rejection.
No clear classic reversal pattern (e.g., full inverse head & shoulders) — more of a trendline test after consolidation.
Volume and daily close confirmation are critical to avoid false breakouts.
---
Bullish Scenario (requirements for a valid bullish setup)
Bullish trigger (confirmation):
1. Daily close above trendline + above ~1.30 (body close, not just wick).
2. Rising volume during breakout, showing strong buying participation.
3. A successful retest of the trendline as support after breakout for safer entry.
Step targets after confirmation:
Target 1: 1.414 — partial profit zone.
Target 2: 1.50 – 1.597 — mid-term resistance.
Target 3: 1.85 – 2.09 — major supply zone; if momentum remains, extend to 2.38 – 2.49.
Risk management:
Initial stop-loss below retest area or under 0.95 (adjust to position size).
Consider trailing stops for strong momentum moves.
---
Bearish Scenario (rejection / continuation)
Bearish trigger (confirmation):
1. Rejection at trendline: long upper wick + daily close back under 1.18 without volume confirmation on buying.
2. Increasing sell volume during rejection and follow-through.
Downside targets:
Target 1: 0.95–1.00 (intraday support).
Target 2: 0.80 (mid-level support).
Target 3: if breakdown continues, retest major low at 0.611.
Short strategy on confirmation:
Enter after rejection candle with volume confirmation; stop-loss above wick high / slightly above trendline.
---
Key Signals to Watch Before Entry
1. Daily close — avoid acting solely on intraday wicks.
2. Volume — breakouts without strong volume are prone to failure.
3. Retest confirmation — ideal for safer entries after breakout.
4. Broader market context — BTC/DeFi sentiment can accelerate or reverse moves.
5. Orderflow / on-chain / Lido news — large unlocks or updates may trigger volatility.
---
Trading Plan Highlights
Position sizing: risk only 1–2% of capital per trade.
Measured stop-loss: under breakout retest or under 0.95 for longs; above rejection wick for shorts.
Take profits in stages at resistance zones; avoid aiming for one all-or-nothing target.
Prepare a contingency plan for false breakouts.
---
Final Note
LDO is at a decision point — whether to break the yellow trendline or get rejected will set the mid-term direction. Wait for confirmation (daily close + volume + retest) before committing capital, and maintain strict risk control.
---
Hashtags (for TradingView):
#LDOUSDT #LDO #Lido #Crypto #TechnicalAnalysis #Breakout #SwingTrade #RiskManagement
pay attention to LIDOThis is one of the best R/R on binance for coins who actually have liquidity.
if this trendline is broken, this asset will fly fast
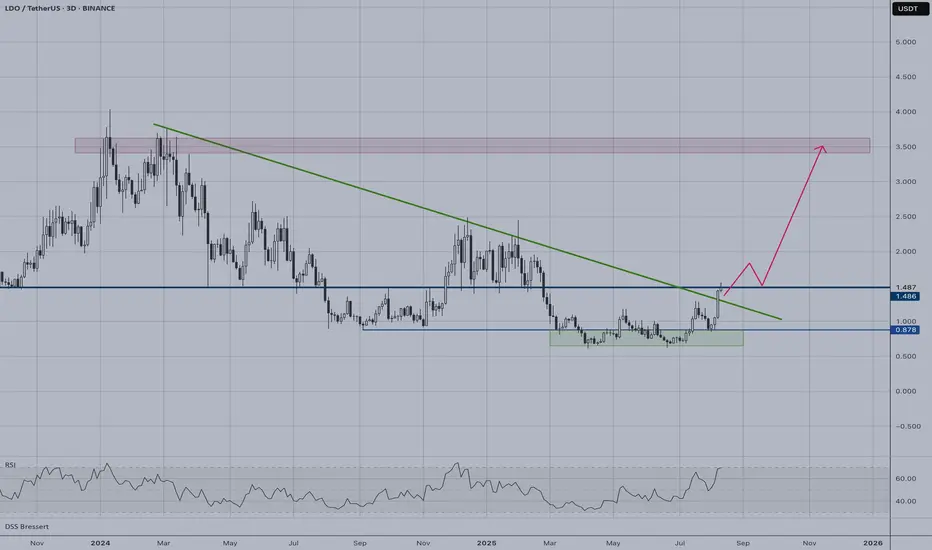
LDO | Flipped Longe Term ResistanceLDO has achieved a significant technical milestone by breaking above its long-term descending resistance trendline that has been in place since early 2024. This breakout represents a major shift in market structure from bearish to potentially bullish sentiment.
Key Technical Points:
• Price successfully flipped the major resistance around $1.485 into support
• The breakout occurred with strong momentum after months of consolidation
• RSI is trending upward, confirming the bullish momentum shift
Price Targets:
• First resistance: $2.00 (previous consolidation high)
• Major target: $3.50+ resistance zone (red box area)
Risk Considerations:
The projected path suggests a strong upward trajectory, but traders should watch for any rejection at the $2.00 level as a potential pause point.
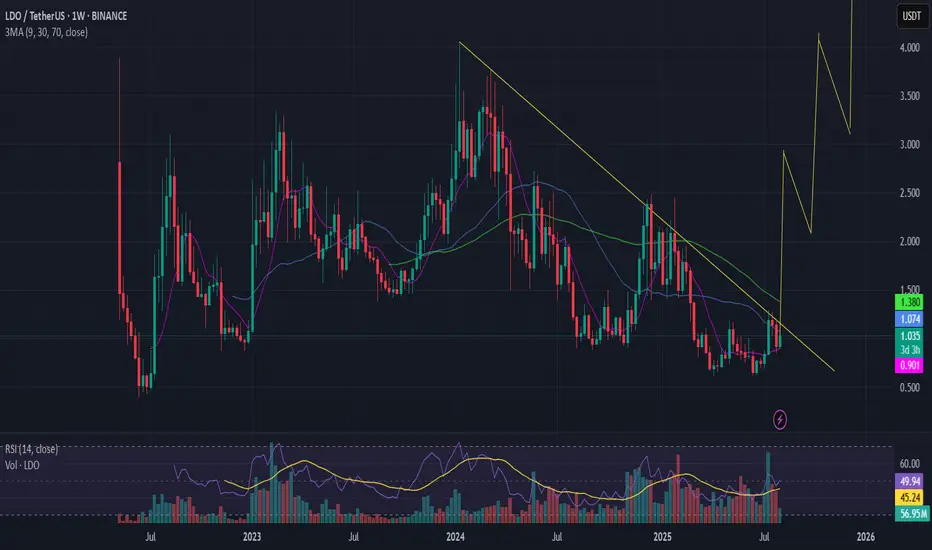
LDO T1 Incoming
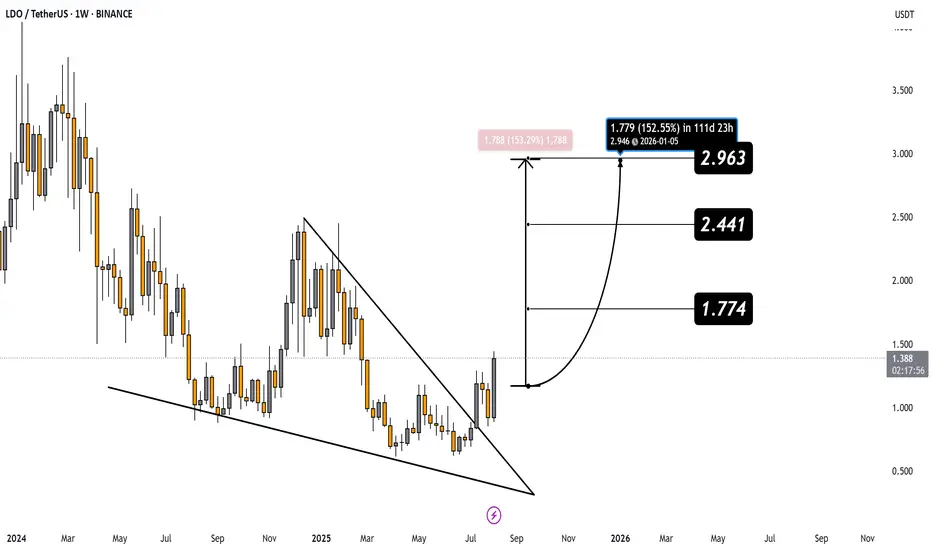
MIL:LDO just broke out of a Massive Falling Wedge on the weekly 📈
Bulls are charging, momentum building fast 🐂💨
🎯 Targets:
T1 – $1.774 (almost there 👀)
T2 – $2.441
T3 – $2.963
Structure looks solid for continuation – dips are for loading 🚀
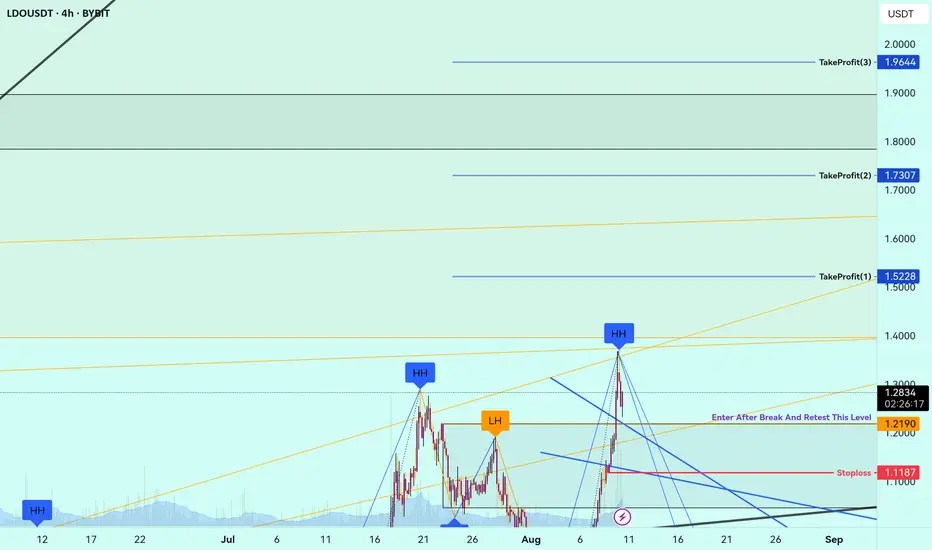
LDOUSDT Daily Chart Analysis | Strong Momentum BuildingLDOUSDT Daily Chart Analysis | Strong Momentum Building
🔍 Let’s dive into the LDO/USDT perpetual contract and analyze the latest price action, highlighting a powerful bullish setup and key technical signals on the daily chart.
⏳ Daily Overview
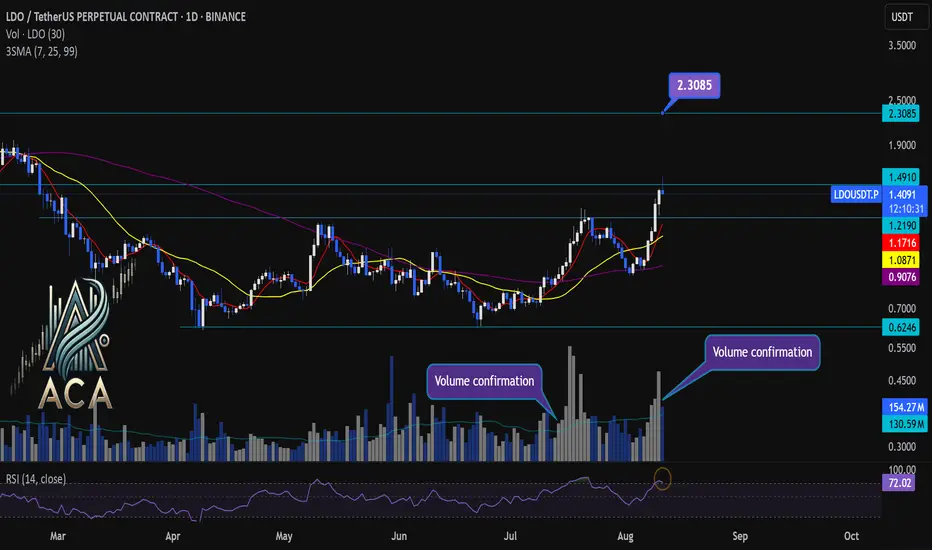
The daily chart reveals a strong surge in momentum as the price breaks out of its recent range, accompanied by a decisive uptick in trading volume. The 3SMA setup (short-term, mid-term, and long-term moving averages) is aligning bullishly, marking the beginning of a strong uptrend.
📊 Key Highlights:
- RSI (14) is entering the overbought zone (currently at 73.39), reflecting surging buyer demand and intensifying momentum.
- Price has broken out of the range box with elevated volume, confirming the move.
- Multiple volume confirmation spikes signal conviction behind the breakout.
- Immediate resistance is being challenged; the next key target to watch is $2.3085.
- For continued upside, we must see a daily candle close with solid volume above the current resistance level.
🚨 Conclusion:
Momentum is clearly accelerating on LDOUSDT, supported by volume and moving average bullish alignment. If price closes above resistance with strong volume, a continued rally toward the $2.3085 target is likely. Keep an eye on RSI levels and volume for further confirmations as this trend builds!
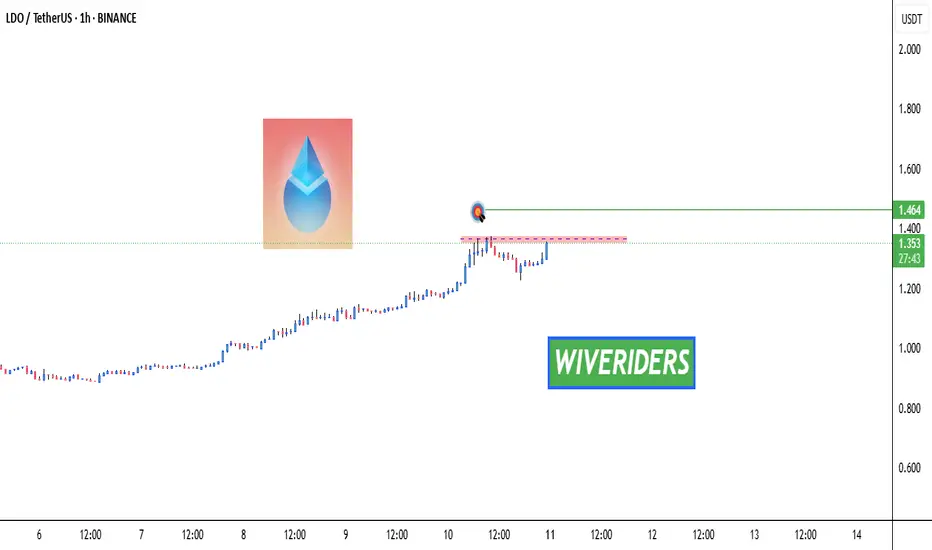
LDO Breakout Watch – Red Resistance Being Tested! 🚨 MIL:LDO Breakout Watch – Red Resistance Being Tested! 🔴⏳
MIL:LDO is testing the red resistance zone.
📊 If breakout confirms, next move could target:
🎯 First Target → Green line level
A breakout could trigger bullish continuation and upside momentum.
LDO Coin | Swing Long IdeaLDO | Swing Long Idea
📊 Market Sentiment
Overall sentiment remains bullish, supported by expectations of a 0.25% rate cut in the upcoming FOMC meeting. A weakening USD and increased risk appetite across global markets continue to create favorable conditions for further upside in crypto assets.
LDO is closely correlated with Ethereum’s price action. As ETH approaches all-time highs, fueled by a $1B single-day ETF inflow, LDO is also showing strong upside potential.
Additionally, market rumors suggest that the SEC may approve Ethereum staking policy soon — a move that would directly increase the utility of LDO in the future. This adds strong conviction to a long bias.
📈 Technical Analysis
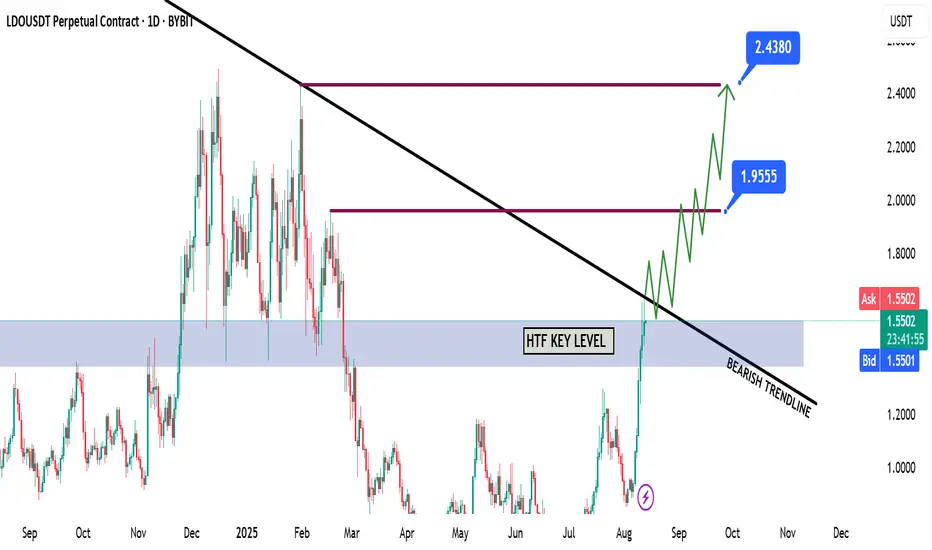
Price has gained strong momentum alongside Ethereum’s bullish run.
We are approaching a HTF bearish trendline that has capped price for a while.
A breakout and close above this level would be a significant bullish signal.
📌 Game Plan
Wait for a clean break and close above the HTF bearish trendline.
Look for long entries on a retest of the breakout level.
🎯 Setup Trigger
After retest, wait for a 4H break of structure to confirm bullish continuation.
📋 Trade Management
Stoploss: 4H swing low that caused the break of structure
Targets:
TP1: $1.95
TP2: $2.43
Trail stops to secure profits as price moves in favor.
💬 Like, follow, and comment if you find this setup valuable!
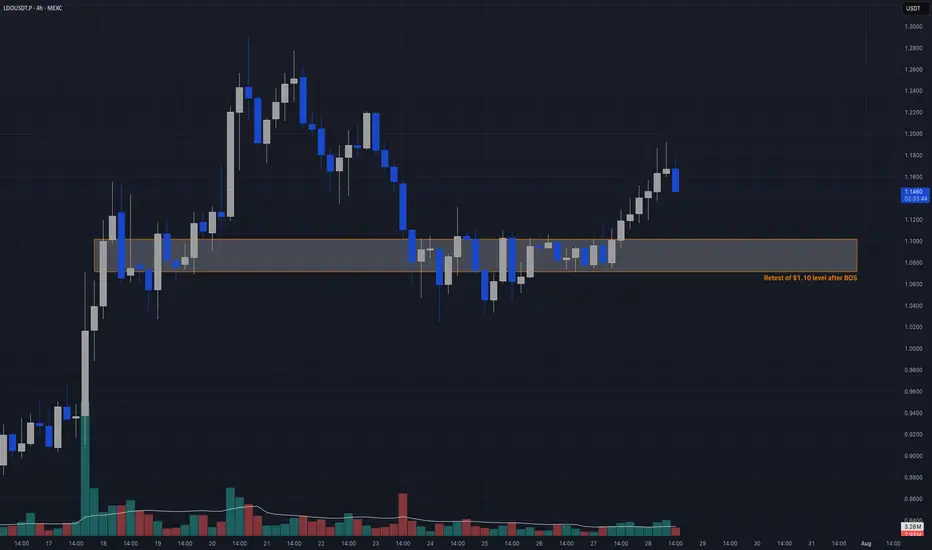
$LDOUSDT.P Breakout → Retest of OB zoneCandle Craft fam — here’s a clean structure-based setup shaping up on LDOUSDT.P. After breaking out from a tight range, price is pulling back toward a fresh BOS zone. Let’s prepare for a surgical retest entry — no chasing.
⸻
📈 Bias: Long
🧠 Strategy: Breakout → Retest of OB zone
📍 Entry Plan:
▫️ Entry Zone: 1.08 – 1.10
🛡️ Stop Loss: 1.045
🎯 Take Profits:
• TP1: 1.18
• TP2: 1.24
• TP3: 1.32
⸻
🧠 Why This Trade?
– Price broke structure cleanly and is now pulling back
– OB between 1.08 – 1.10 = key area to defend
– Previous range highs now turned into demand
– HTF trend remains bullish — this is the reload zone
⚠️ Watch 5m or 15m for BOS or CHoCH once price enters the box. No confirmation = no entry.
⸻
Trade clean. Be precise. We don’t gamble — we wait for the reclaim.
—
Candle Craft | Signal. Structure. Execution.
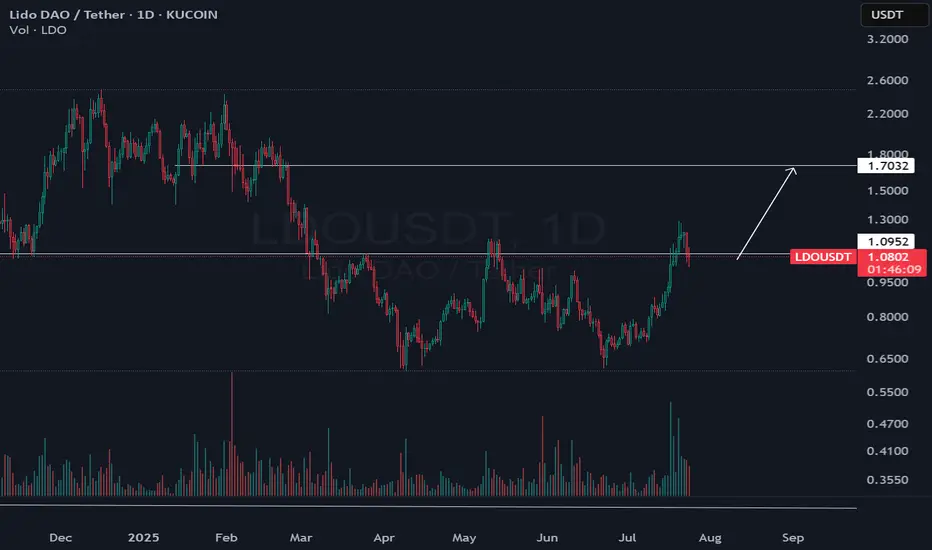
Ldo setupCrypto will have another long leg and according to my comprehensive analysis, this pump to the $1.7 range could happen for Lido.
#LDO/USDT#LDO
The price is moving within a descending channel on the 1-hour frame, adhering well to it, and is on its way to breaking strongly upwards and retesting it.
We have support from the lower boundary of the descending channel, at 1.128.
We have a downtrend on the RSI indicator that is about to be broken and retested, supporting the upside.
There is a major support area in green at 1.10, which represents a strong basis for the upside.
Don't forget a simple thing: ease and capital.
When you reach the first target, save some money and then change your stop-loss order to an entry order.
For inquiries, please leave a comment.
We have a trend to hold above the 100 Moving Average.
Entry price: 1.139.
First target: 1.172.
Second target: 1.210.
Third target: 1.270.
Don't forget a simple thing: ease and capital.
When you reach your first target, save some money and then change your stop-loss order to an entry order.
For inquiries, please leave a comment.
Thank you.

TradeCityPro | LDO Breaks Out Amid Altseason Hype Shift👋 Welcome to TradeCity Pro!
In this analysis, I’m going to review the LDO coin for you. It’s one of the well-known DeFi projects in crypto with the highest TVL in this category, and the LDO coin ranks 82 on CoinMarketCap with a market cap of $1.08 billion.
📅 Daily timeframe
On the daily timeframe, LDO has been in a range box for several months and is now starting to break out of it.
💥 After being supported at the 0.683 bottom, a large amount of buying volume entered, and a sharp bullish move occurred from this bottom to the top of the box. The RSI has also entered the Overbuy zone.
🔔 The overextended level on the RSI oscillator is 79.66, which has even been broken during this leg. Right now, I think the probability of a correction is quite high.
🔍 Yesterday's candle made a deep penetration into the top of the box, and currently, the price is sitting above the box. Since RSI is in the overextended zone, a pullback or short-term rest is likely.
🚀 However, considering the current uptrend, I believe this bullish leg might be ending, and we could see a few corrective candles. But after the correction ends, a new bullish leg might begin, pushing the price toward the resistance levels at 1.480 and 2.382.
🛒 For a long position or a spot buy, we can enter during this new bullish leg once the top breaks and a confirmation of a new wave starting is in place.
📝 Final Thoughts
This analysis reflects our opinions and is not financial advice.
Share your thoughts in the comments, and don’t forget to share this analysis with your friends! ❤️

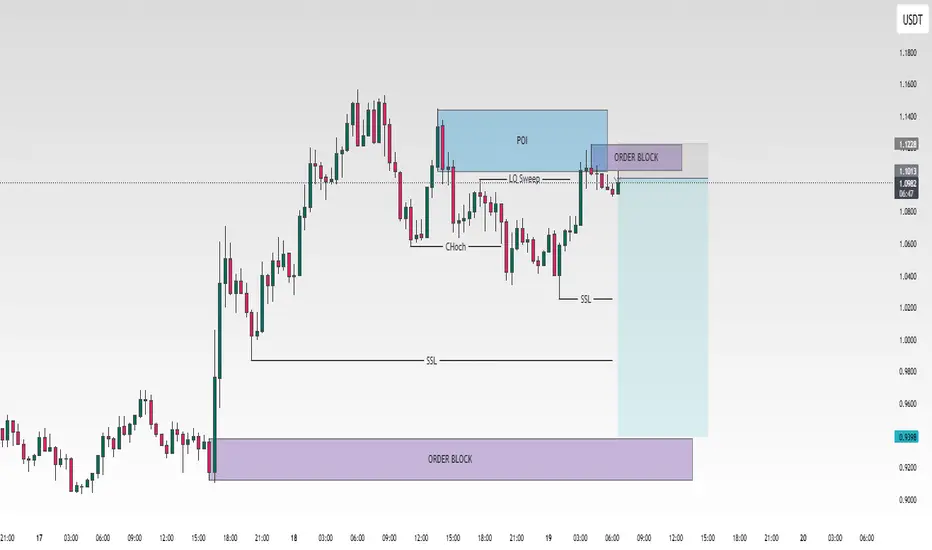
LDO Short ideaLDO short idea using SMC concept
price done sweep the liquidity, mitigated the POI and form a new OB, from that OB i am entering a short position
LDO TRADE IDEA AND SETUP FOR TRADE.Chart Overview
Pair: LDO/USDT Perpetual
Timeframe: 15 Minutes
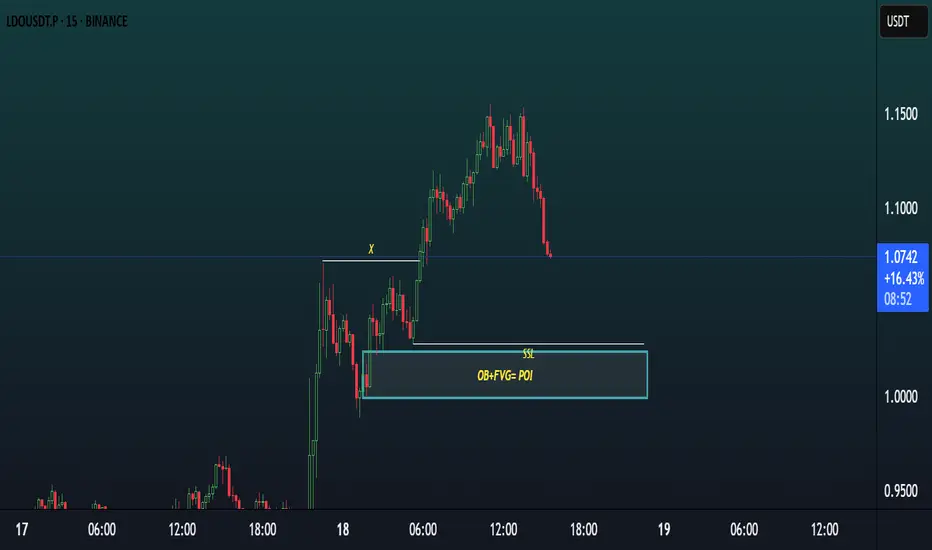
Current Price: 1.1044
Market Bias: Bullish (anticipating a pullback into OB+FVG zone before continuation)
📌
Setup Summary
Strategy: Smart Money Concept (SMC)
Key Confluences:
Order Block (OB)
Fair Value Gap (FVG)
SSL (Sell-Side Liquidity) sweep
POI Zone (Point of Interest): Around 1.000–1.020
🧠
Detailed Breakdown
1.
Break of Structure (BoS)
A strong bullish break of structure occurred after price took out the previous swing high (marked as “X”).
This confirmed a shift from bearish to bullish market structure.
2.
SSL (Sell-Side Liquidity)
Before the price moved up, it took out liquidity resting below previous lows.
This SSL sweep often fuels institutional moves — confirming a smart money entry zone below.
3.
OB + FVG = POI
The blue box highlights a powerful confluence of:
A Bullish Order Block (OB) (last down candle before up move)
A Fair Value Gap (FVG) (imbalance created by fast move)
This makes the zone high probability for reversal, if price returns to it.
4.
Price Action
Price is now retracing, and if it fills the imbalance into the POI zone, it is likely to react bullishly.
The next leg up can retest or break the highs above 1.22+.
✅
Entry Tips
Wait for a bullish engulfing candle or market structure shift in 5m inside POI.
Use volume spike or RSI divergence for stronger confirmation.
🧩
Conclusion
This is a clean Smart Money bullish setup combining:
SSL liquidity sweep
Order Block
Fair Value Gap
And a likely retracement into POI
Highly favorable setup for a long position with solid risk management.
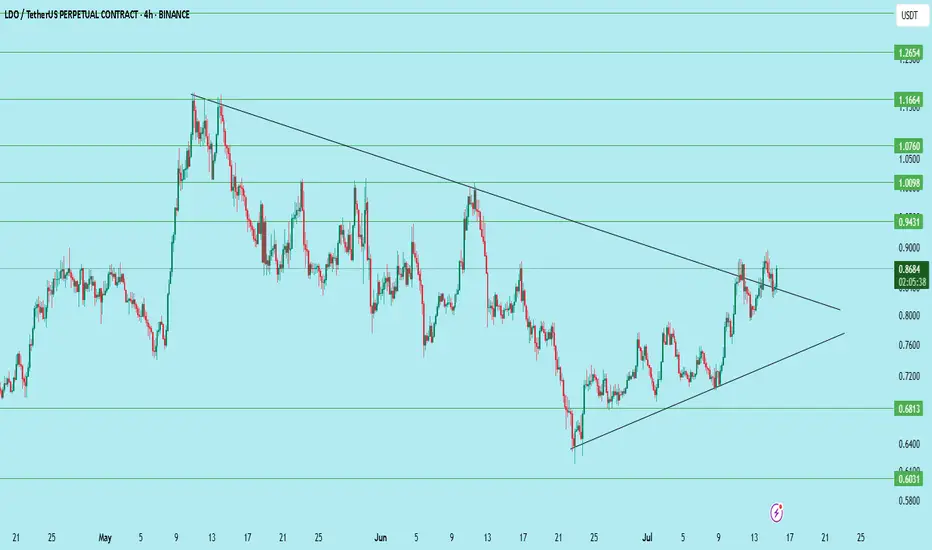
LDO/USDT – Symmetrical Triangle Breakout SetupLDO is trading just below a major downtrend line and forming higher lows, compressing into a symmetrical triangle. A breakout looks close!
Chart Insights:
Price approaching resistance around $0.87–$0.88
Strong structure of higher lows holding since June
A breakout above the trendline can trigger a strong move
Trade Setup:
Entry: On breakout above $0.88
Stoploss: Below $0.81
Targets:
T1: $0.943
T2: $1.009
T3: $1.076
T4: $1.166
T5: $1.265
Good volume confirmation will strengthen the move. Watch closely!
DYOR | Not financial advice
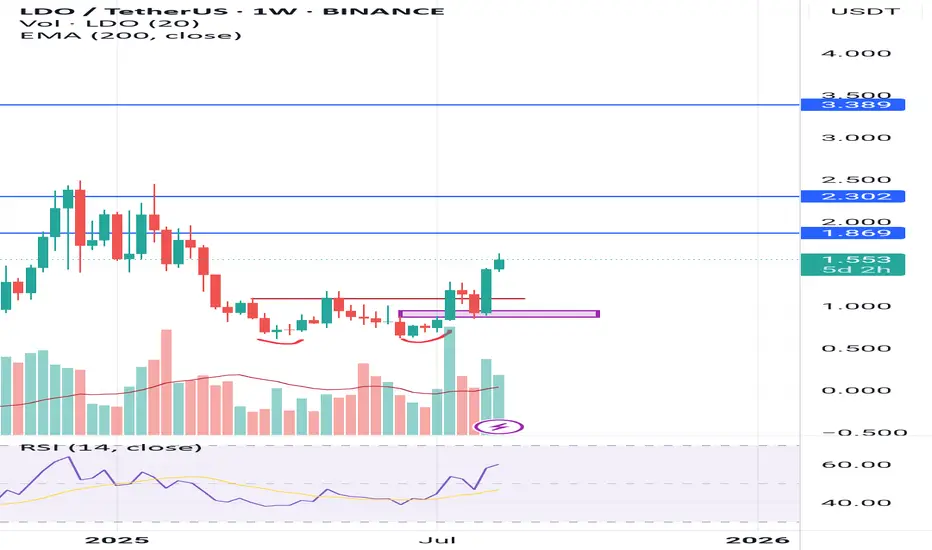
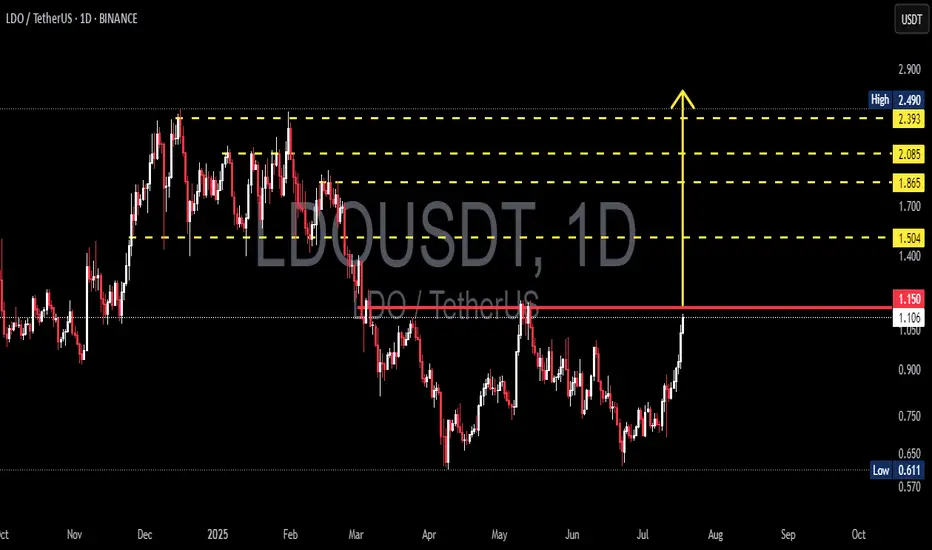
LDO/USDT Breakout Watch Ready to Fly After a Strategic Breakout?🔍 Full Technical Analysis
After months of downtrend and tight consolidation, LDO/USDT is showing clear signs of a bullish resurgence. The breakout above the key psychological resistance at $1.15 opens up a wide path toward higher resistance zones, potentially marking the beginning of a strong upward trend.
📐 Key Pattern Formed:
✅ Double Bottom Pattern
> Clearly visible from May to July 2025, with a neckline at $1.15. This is a classic bullish reversal pattern. The breakout above the neckline confirms the setup, projecting a significant upward move based on the measured height of the pattern.
✅ Horizontal Resistance Breakout
> The $1.15 level acted as a major resistance since April 2025. A clean breakout above it suggests that bulls are regaining control of the market momentum.
✅ Bullish Scenario (Primary Bias)
If the price successfully holds above the $1.15 zone and confirms it as support (successful retest), we may witness a bullish rally targeting the following levels:
🎯 Target 1: $1.504
— A minor resistance and previous consolidation area.
🎯 Target 2: $1.865
— A strong resistance level from earlier distribution zones.
🎯 Target 3: $2.085
— A technically significant level and key reaction point from past price action.
🎯 Target 4: $2.393 – $2.490
— A major supply zone and swing high from early 2025. This serves as the potential final target of the current bullish leg.
🟢 Volume increased during the breakout — a strong confirmation signal that this move is genuine, not a fakeout.
🟢 RSI likely gaining strength — though not shown on this chart, momentum indicators are likely supporting the move with a breakout from neutral levels.
❌ Bearish Scenario (If Breakout Fails)
If the price fails to hold above $1.15 and drops back below $1.05:
🔻 Potential Fakeout Risk
— A correction could send LDO back to:
Minor support at $0.90
Base support at $0.75
Major support at $0.611 (2025’s low)
📉 A breakdown below $0.611 would invalidate the bullish structure entirely, putting LDO back into a strong downtrend.
📊 Final Thoughts:
> LDO/USDT is at a critical decision point. A clean breakout from a strong medium-term structure opens the door for a significant bullish continuation. With pattern confirmation and strong volume support, this setup could mark the beginning of a mid-term uptrend.
The key lies in holding above $1.15 and watching for a healthy retest. This is a premium setup for swing traders and trend followers looking for early entries before a possible major move.
🧠 Trading Tips:
✅ Ideal Entry: On successful retest around $1.15 – $1.10
❌ Stop Loss: Below $1.00
📈 Targets: $1.50, $1.85, $2.08, and $2.49 (scaling out recommended)
#LDO #LDOUSDT #CryptoBreakout #AltcoinRally #TechnicalAnalysis #DoubleBottom #CryptoSignals #TradingViewIdeas #SwingTradeSetup #BullishPattern
#LDO PUMP TO $ 0.794 ?#LDO
The price is moving within a descending channel on the 1-hour frame, adhering well to it, and is on its way to breaking it strongly upwards and retesting it.
We have a bounce from the lower boundary of the descending channel. This support is at 0.703.
We have a downtrend on the RSI indicator that is about to break and retest, supporting the upside.
There is a major support area in green at 0.695, which represents a strong basis for the upside.
Don't forget a simple thing: ease and capital.
When you reach the first target, save some money and then change your stop-loss order to an entry order.
For inquiries, please leave a comment.
We have a trend to hold above the 100 Moving Average.
Entry price: 0.730
First target: 0.744
Second target: 0.767
Third target: 0.794
Don't forget a simple thing: ease and capital.
When you reach the first target, save some money and then change your stop-loss order to an entry order.
For inquiries, please leave a comment.
Thank you.

LDOUSDT 1D#LDO has broken above the Descending Broadening Wedge pattern and the SMA100 on the daily chart. The retest is nearly complete.
If the daily candle closes above the pattern, the following targets are on the table:
Targets:
🎯 $0.969
🎯 $1.064
🎯 $1.186
🎯 $1.340
🎯 $1.421
🎯 $1.537
⚠️ Always use a tight stop-loss and apply proper risk management.

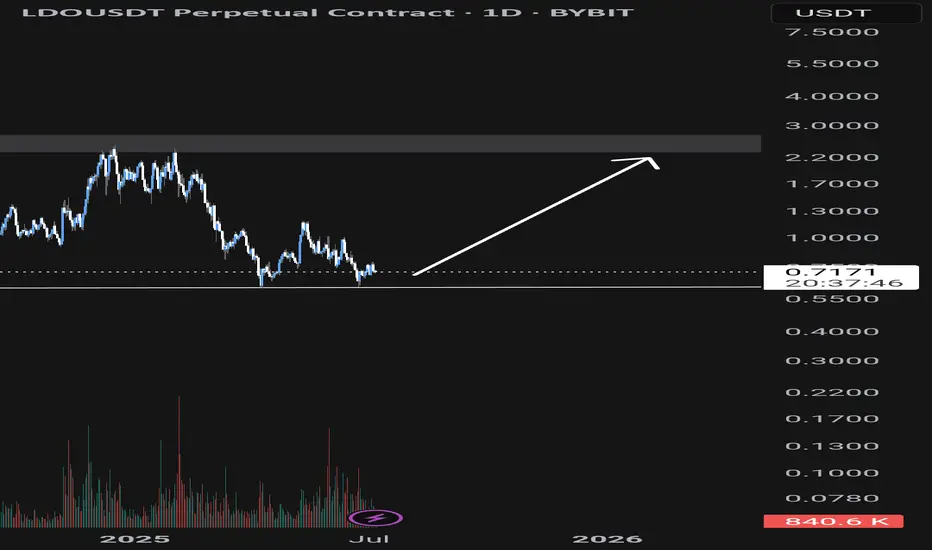
LDO/USDT Long-Term Accumulation Opportunity LDO/USDT Long-Term Accumulation Opportunity 🤝🎖️
On the daily timeframe, LDO is currently forming a potential double bottom pattern, signaling the exhaustion of its prolonged downtrend. This structure often acts as a strong reversal signal, especially when supported by a clear horizontal demand zone.
📉 Short-Term Price Action
There is still a possibility of a minor dip toward the support zone of $0.66–$0.60, where significant buying interest is likely to emerge.
🫡 Mid-to-Long Term Outlook
From this accumulation range, LDO holds potential for a strong upside move
1X to 3X returns possible over the next few quarters.
Major resistance zones lie around
$1.90–$2.80, which aligns with historical liquidity zones🤝.
📌 Investor Note
This setup is favorable for long-term portfolio positioning, especially for those looking to accumulate fundamentally promising altcoins on market consolidation.
Risk management remains key. Accumulate gradually near the support zone and avoid emotional entries on short-term pumps.
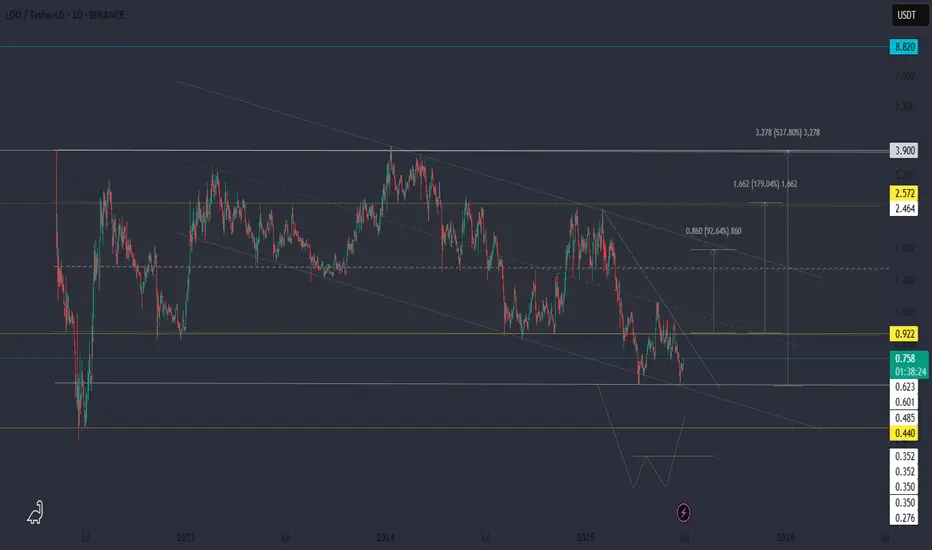
LDO/USDT — Reversal in the Making?Lido Finance is a major decentralized liquid staking protocol. It allows users to lock ETH and receive stETH, which can then be used across various DeFi platforms.
🔍 Technical setup:
▪️ Price is moving inside a broad horizontal range with wicks in both directions
▪️ Within that, there’s a secondary descending channel
▪️ Currently forming a potential double bottom or dragon pattern — both are classic reversal setups
📌 Key confirmation level:
▪️ A breakout and close above 0.922 USDT would confirm the pattern and signal possible trend reversal
🎯 Upside targets if breakout confirms:
▪️ 1.77 — short-term target
▪️ 2.57 — mid-range resistance
▪️ 3.90 and beyond — long-term potential
⚠️ As long as price remains inside the range — it's just preparation.
$LDO PUMP TO $1.20📊 1. Trend Analysis
HTF (Higher Time Frame) Bullish: Long-term trendline shows sustained upside momentum with 3 clean touches, indicating trend strength.
LTF (Lower Time Frame) Bearish: Short-term structure broke down from the trendline but is now showing signs of reversal with a falling wedge breakout.
📈 2. Chart Pattern
Falling Wedge: Classic bullish reversal setup. Price has broken out with strong momentum.
OBV (On-Balance Volume) shows bullish divergence—volume is rising while price was falling, signaling accumulation during the downtrend.
🔄 Market Structure
Swing Highs and Lows are respected—showing healthy structure.
Recent swing low held near the demand zone.
Break and retest of key levels and trendlines indicate potential continuation to the upside.
🟪 Supply & Demand
Demand Zone (~$0.65): Provided strong support, origin of latest move.
Supply Zone (~$1.15): Likely to offer resistance; aligns with upper FVG and volume gap.
🔵 Fair Value Gaps (FVGs)
Filled/Partial Below: $0.65–$0.68 – already mitigated.
Unfilled Above: Around $0.98–$1.05 – may act as a magnet for price.
🧠 Psychological Levels
$0.90 and $1.00: Price magnets due to trader behavior. Expect increased reaction or consolidation at these levels.
🔴 Volume Profile
High Volume Node (HVN) around $0.85–$0.95: Indicates acceptance zone where price may consolidate.
Low Volume Gap above $1.10: If price clears this, a fast move to $1.20+ is likely.
✅ Bullish Confluences
Falling wedge breakout confirms reversal potential.
OBV divergence supports accumulation narrative.
Price bounced from demand zone and reclaimed broken structure.
Room to move into FVG and low-resistance areas above.
❌ Bearish Risks
Rejection at $1.00–$1.05 psychological/FVG level.
Breakdown below $0.86–$0.88 invalidates bullish setup.
Heavy supply at $1.20 could cap upside.
📌 Summary
Bias: Bullish. Expect move toward $1.00–$1.15.
Confirmation: Clean break and hold above $1.00.
Invalidation: Break back below $0.86 swing low.

#LDO/USDT#LDO
The price is moving within a descending channel on the 1-hour frame, adhering well to it, and is heading toward a strong breakout and retest.
We are experiencing a rebound from the lower boundary of the descending channel. This support is at 0.741.
We have a downtrend on the RSI indicator that is about to be broken and retested, supporting the upward trend.
We are in a trend of consolidation above the 100 moving average.
Entry price: 0.780
First target: 0.805
Second target: 0.837
Third target: 0.870
