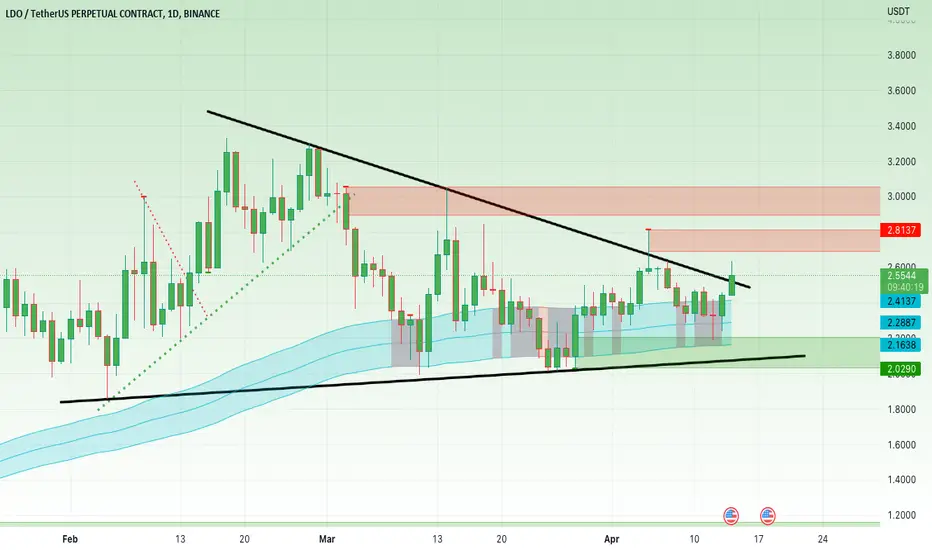
LDOUSDT daily chart
what we have here?
1-a trendline with 1 fake breakout and a successful break and now price retesting the trend!
2- a order block rejected price 2 time!
but overall LDO is bearish for me. why?
because we have 4 LH ,But on the other side, we have a new structure that has formed a higher LOW. I will remain bearish until a higher high is formed.
LDOUSDT trade ideas


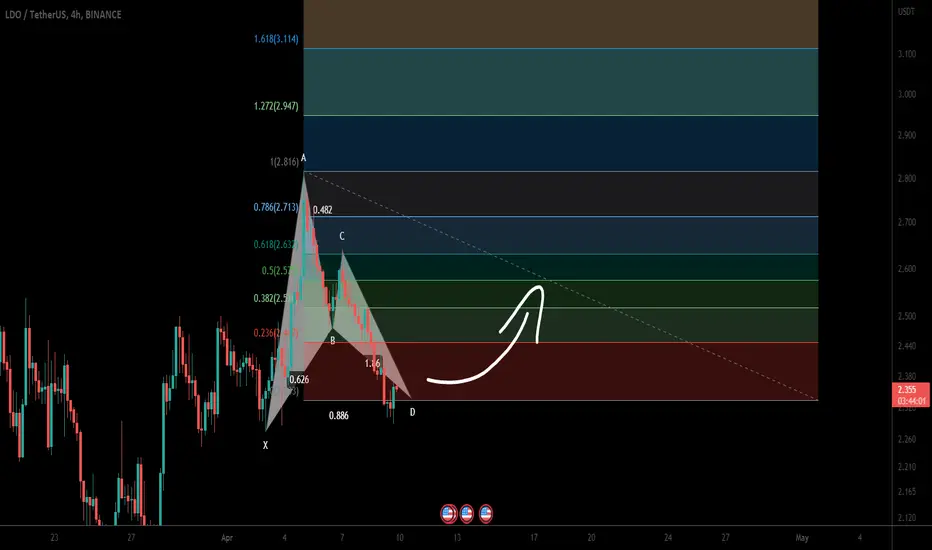
LDO Long setupShark pattern detected to be reversed to fib 0.5 fip potential reversal to butterfly harmonic targer
SL close 4hr candle under 0.618 in chart

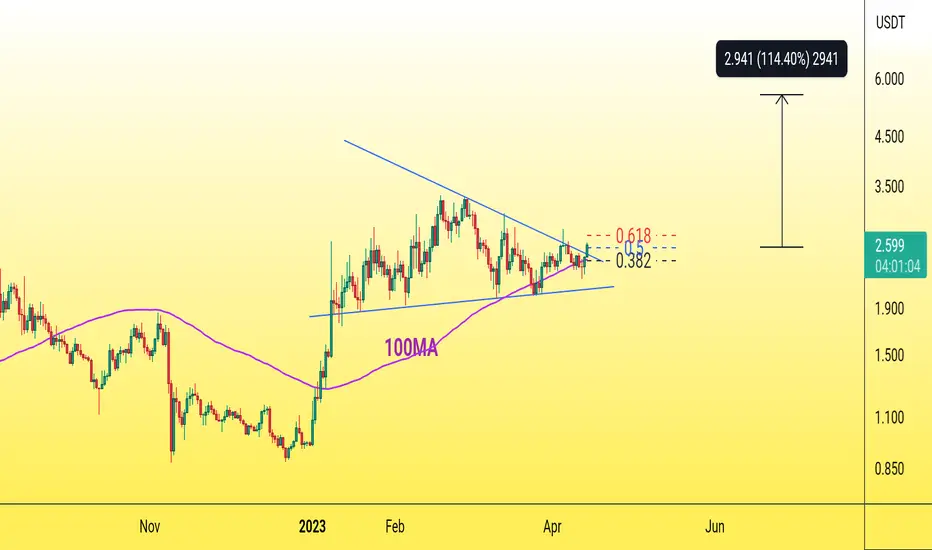
Another bullish rally coming🔸LDO Looks great in 1 D chart
🔸 it breaks the upper side of the bullish pennant which meaning a bullish sign
🔸Besides breaks 100 ma and 0.5 fib level
🔸The most important resistance for now is 0.618 fib level .and it going to be broken soon.
🔸Keep ur eye on LDO u will see it above 5$ in next few weeks.
Don't forget to support us with ur like, comment and follow for more ideas like this🎯
LDO H&S Pattern's>>>>>>>>>>>I Have Tried My Best to Bring the best Possible outcome in this Chart.
LDO after mid-term correction stil have a chance to hit the top of the resistance area.
But it must first reach and stablize above the neckline of head and shoulder pattern's.
We must wait for trading this wave's.
Everything We need's cleared on the chart.
Must important level's marked on the chart.(scroll your mouse on the chart)
It's just an analyze,
Not a financial advise.
PLZ DYOR
With hopping success>>>>>>>>

LDO trying to Breakout on Daily TimeframeLDO trying to Breakout on Daily Timeframe
Keep an eye on it!
LDOUSD & LDOUSDT IdeaBINANCE:LDOUSDT LDO vs USDT LDOUSD
⚠️🚨 Risk warning, disclaimer: the above is a personal market judgment and analysis based on published information and historical chart data on The trading view,
And only some of these analyzes are my actual real trades.
I hope Traders consider I am Not responsible for your trades and investment decision.
✅ Please write any advice or suggestions.

LDO BUY SETUPHi, dear traders. how are you ? Today we have a viewpoint to BUY/LONG the LDO symbol.
For risk management, please don't forget stop loss and capital management
When we reach the first target, save some profit and then change the stop to entry
Comment if you have any questions
Thank You
LDO update 🤠🏹It is known by most analysts Head and shoulders pattern One of the best and most powerful reflex models ,,,,
As for this coin ::::::::
The conclusion is that currency will make a fourth shoulder before falling
This is because the drop is inevitable for this currency

LDO 🔥🔥 Head and two shoulders
Head and two shoulders pattern ,,,,,,,,
I will wait for a test of the neckline to enter a short position ,,,,,,,
You can watch a test neckline on a small frame , like 30m or 15 ,,,,,,,,,
Wait for the neckline to be tested ,,,,,,
When it starts to drop after the test , Enter directly ,,,,,,,,,
I will not give you a stop loss or entry price ,,,,,,
(( Manage your wallet )) ,,,,,,,,,,,
,,You can enter from anywhere in the red zone,,
🤠🏹
LdousdLiquid staking derivatives hypewave
Ldo is the highest tvl lsd and the volume profile /obv suggesting we test ath levels soon

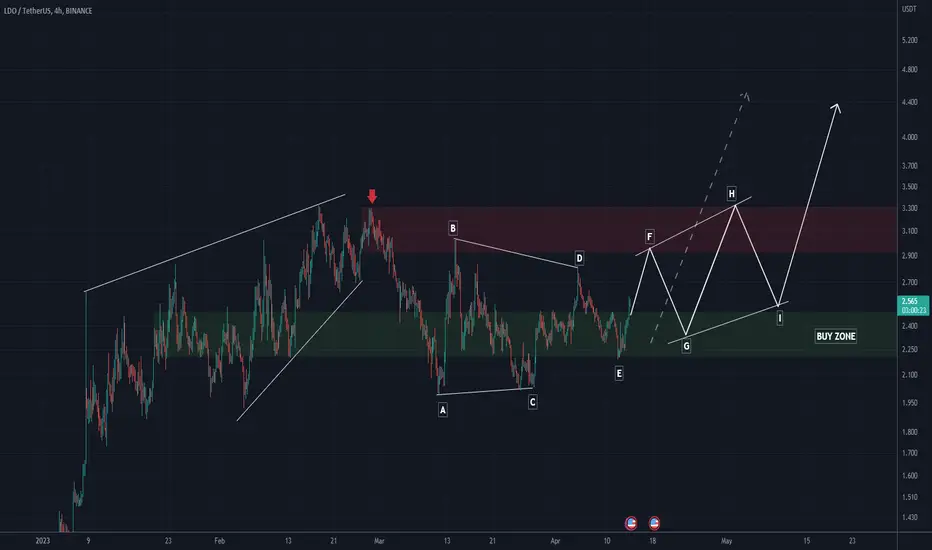
Lido DAO (LDO) formed bullish BAT for upto 19% pumpHi dear friends, hope you are well and welcome to the new trade setup of Lido DAO (LDO) with US Dollar pair.
Recently we caught more than 31% pump of LDO as below:
Now on a 4-hr time frame, LDO has formed a bullish BAT move for another price reversal.
Note: Above idea is for educational purpose only. It is advised to diversify and strictly follow the stop loss, and don't get stuck with trade
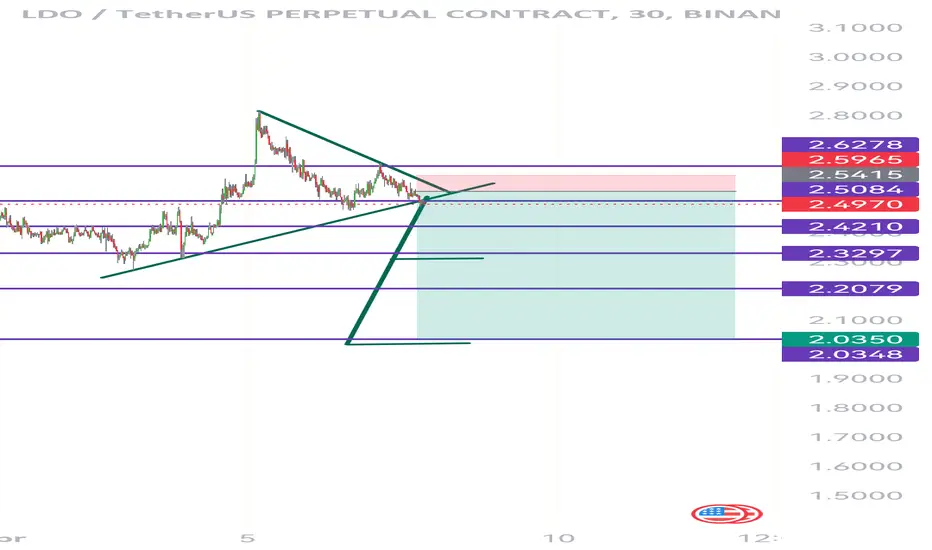
bullish continuationI would love to buy at the 200DMA which will be at the 0.618 by that time, and expecting from LDO that it will break out the triangle, testing it and continue its parabolic run towards 15.
First TP around 3 dollars.
Buying zone in the box.

SHORT LDO - HAVE A NICE WEEKEND!Hi everyone, Please hit the like button or leave a comment if this can make you some money.
ENTRY - TAKE PROFIT & STOP LOSS ON CHART.

LDO SHORTWe have a nice short opportunity here this is setup im gonna run ,hopefully it goes well :) .Please do not take this as financial advice and ofcourse DYOR before every trade
ldousdtExit strategy factors
16 -25 candles, 21-22 on average, start counting when you see big candles
Sell on first bounce on 10D EMA
Specific exit, look for speculated peak and topping pattern, in traded coin as well as other coins and loss of momentum

LDO Dao long squeezeExpecting quick long squeeze/retest on LDO, if it happens I will react with a long. More detailed explanation on a chart

LDOUSDTThe plan is to hold until the next order block hits the supply zone. Why is supply 1 hit on binance?


#LDOSince dominance is started to go down, we can talk about LDO which started the bull season. I have very big expectation for LDO. It will reach up to 8$ at the end of the bull season. Now it might be on dip. Just wait to come around 2.20 then it will be the dip :)

Crazy Risk $LDO Short We are looking to generate profit in the partial correction of this great rise.
Let's see if it works!
LDOUSDT 4 HOURLDOUSDT 4 HOUR on the verge of brekout, buy now or buy after retest
i personally will buy some here
good luck and manage your risks

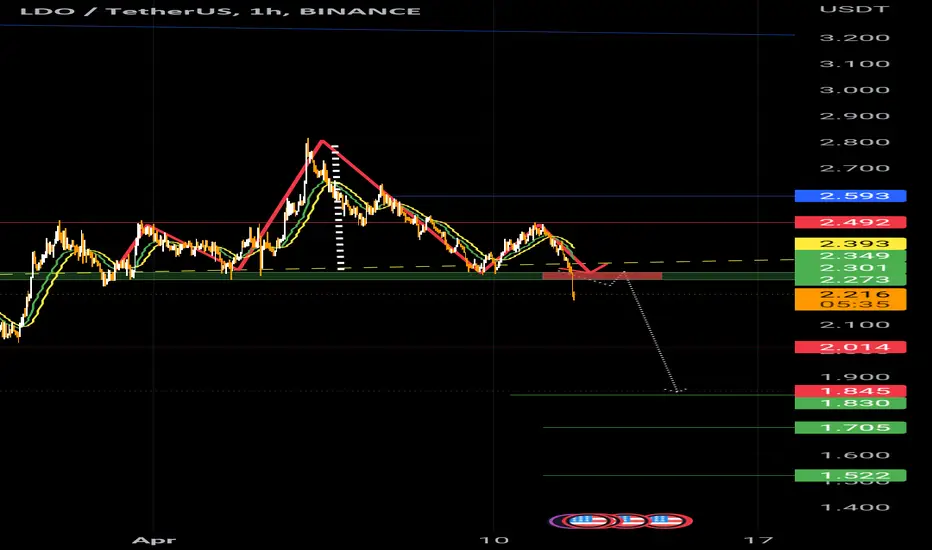
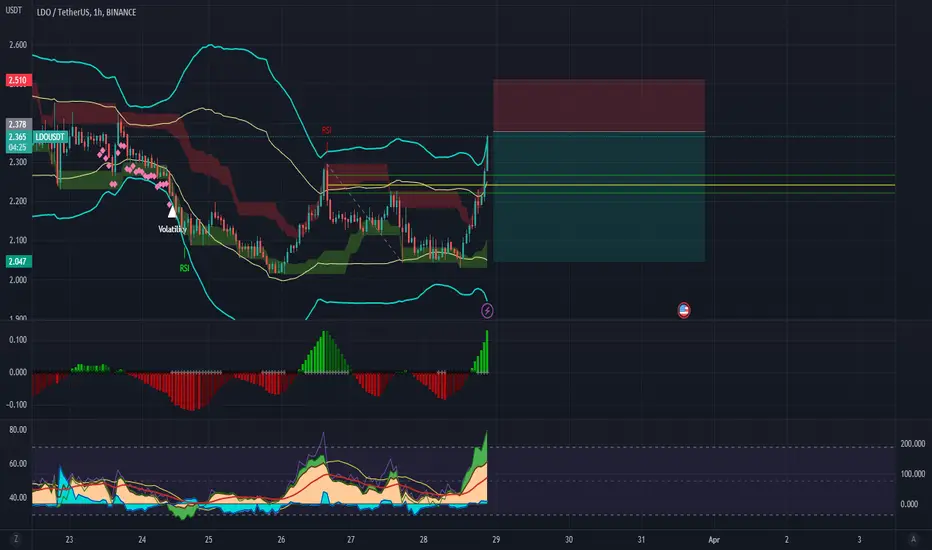
LDOUSDT | Bearish Trend Continuation | Descending TriangleLDOUSDT is showing Bearish Trend Continuation forming Descending Triangle along with the price synced with the RSI. We will place sell stop order along with SL and TPs.
