
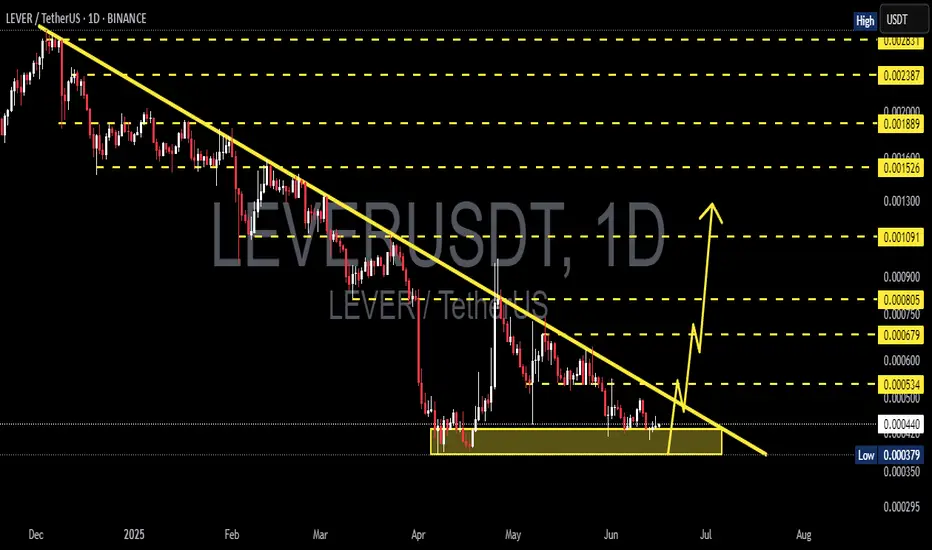
LEVERUSDT 1D AnalysisLEVER ~ 1D Analysis
#LEVER This trade is very risky. Buy if you still have confidence in this coin with a short term target of at least 15%+ from this support.
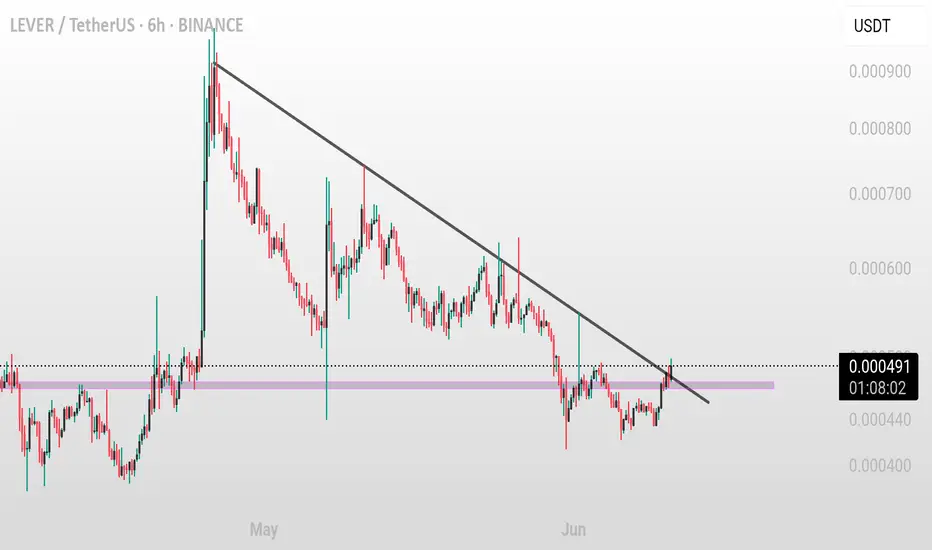
LEVER/USDT (6H) – Trendline Breakout in Progress LEVER/USDT (6H) – Trendline Breakout in Progress
Pattern: Descending Trendline Breakout
Timeframe: 6-Hour ⏱️
Pair: LEVER/USDT 💱
Published: June 10, 2025 📅
Technical Overview:
LEVER/USDT has been trading under a consistent downward trendline, making lower highs over several weeks. Price is now a
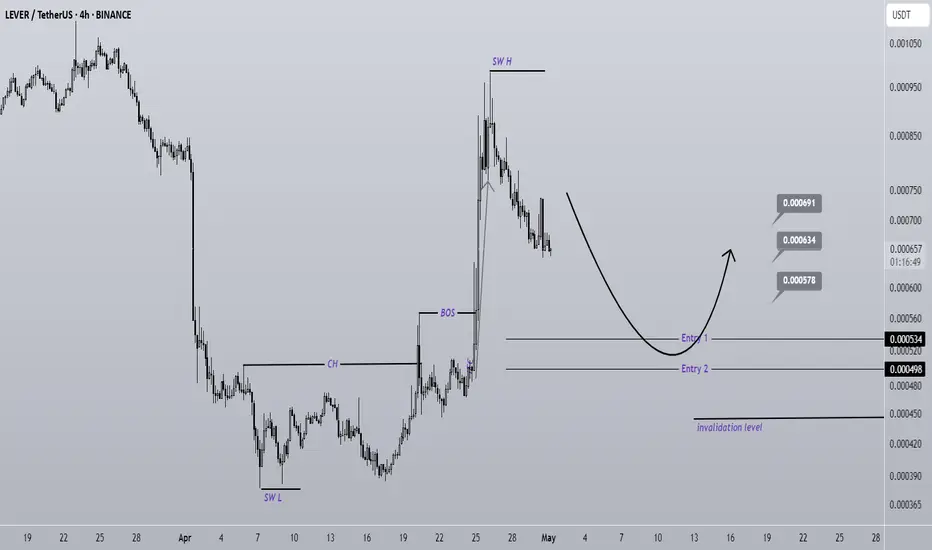
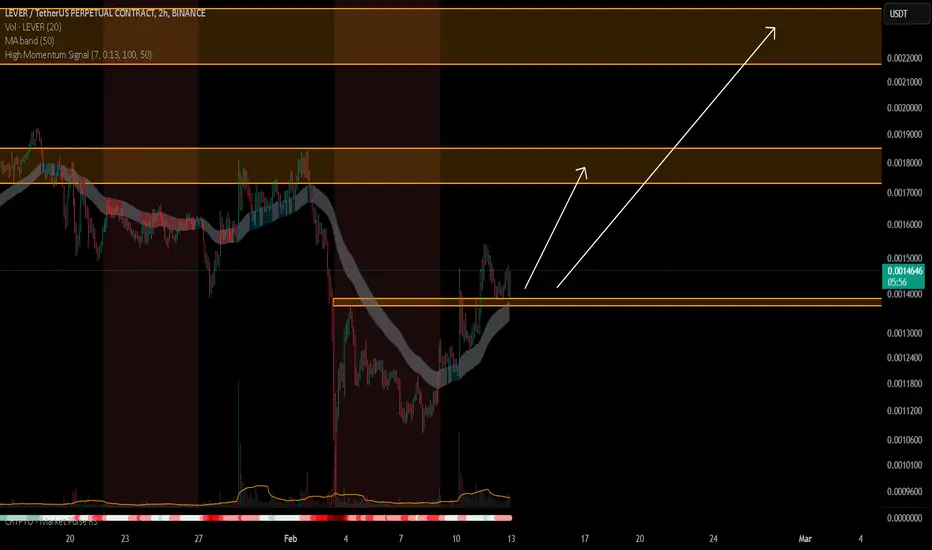
LEVER Looks Bullish (4H)The structure of the Lever symbol has turned bullish.
Within the internal substructure, we are looking for buy/long opportunities.
We have identified and marked two optimized entry points on the chart. These are the levels where we plan to open positions.
Target levels have been set.
A daily can
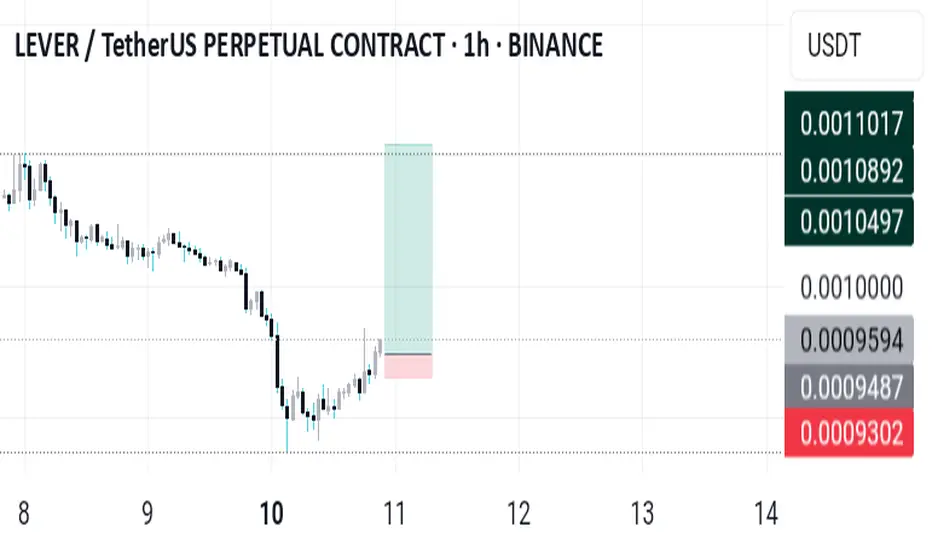
LEVER price ACTION #Reversal #BullIt's very likely lever will deliver bullish price candle this week or within two days
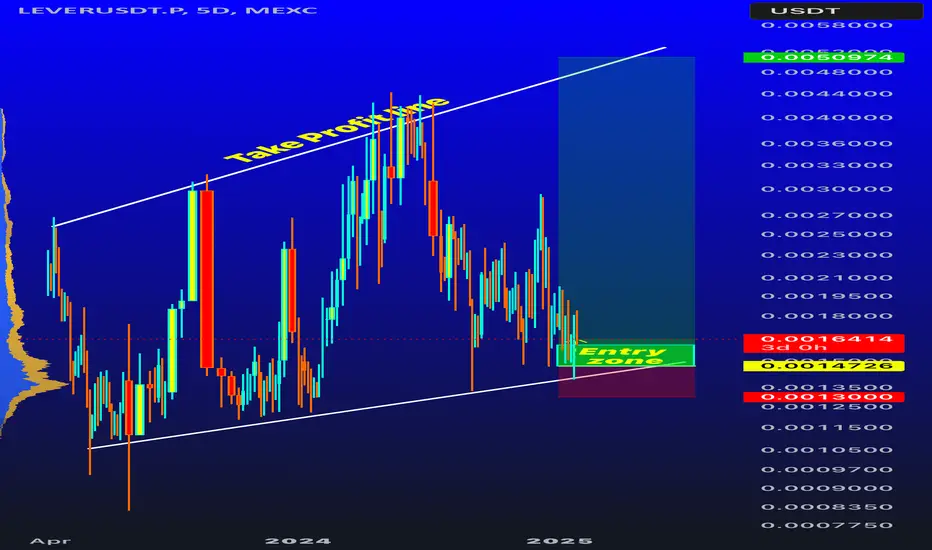
LEVERUSDT 5DLEVER ~ 5D Analysis
#LEVER Buy gradually from here with a short -term target of at least 20%+.

Lever Spot trade Hellow Traders,
Please see chart for details. I generally do a better explanation but, this one is pretty straight forward make sure you check our linked trades and tags on this post for more free trade set ups!!
Hope to see you with all of us together soon!
Stay profitable folks!
Savvy!!
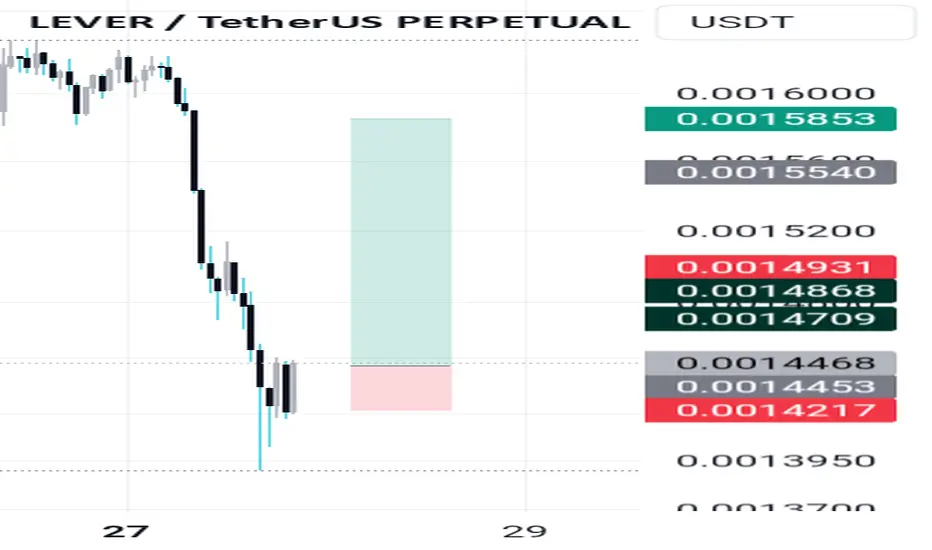
LEVER/USDTKey Level Zone: 0.0013690 - 0.0013870
HMT v5 detected. The setup looks promising, supported by a previous upward/downward trend with increasing volume and momentum, presenting an excellent reward-to-risk opportunity.
HMT (High Momentum Trending):
HMT is based on trend, momentum, volume, and market
Lever Bullish It signals a bullish trend is upcoming for a lever , I expect a massive bullish candle from this level
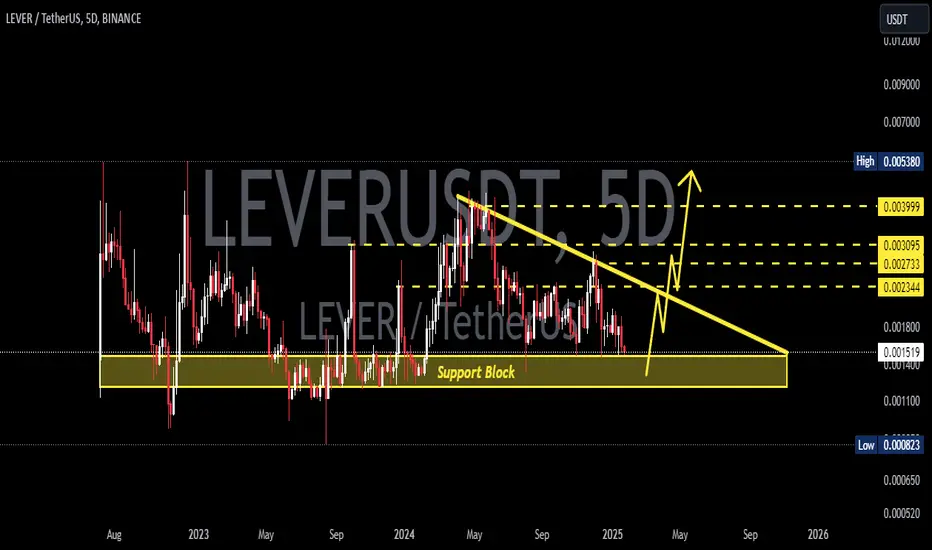
LEVERUSDT 5DLEVER ~ 5D
#LEVER if you still have Conviction on this coin,. Buy in stages from here with a minimum target of 20%++
See all ideas
Summarizing what the indicators are suggesting.
Oscillators
Neutral
SellBuy
Strong sellStrong buy
Strong sellSellNeutralBuyStrong buy
Oscillators
Neutral
SellBuy
Strong sellStrong buy
Strong sellSellNeutralBuyStrong buy
Summary
Neutral
SellBuy
Strong sellStrong buy
Strong sellSellNeutralBuyStrong buy
Summary
Neutral
SellBuy
Strong sellStrong buy
Strong sellSellNeutralBuyStrong buy
Summary
Neutral
SellBuy
Strong sellStrong buy
Strong sellSellNeutralBuyStrong buy
Moving Averages
Neutral
SellBuy
Strong sellStrong buy
Strong sellSellNeutralBuyStrong buy
Moving Averages
Neutral
SellBuy
Strong sellStrong buy
Strong sellSellNeutralBuyStrong buy
Displays a symbol's price movements over previous years to identify recurring trends.