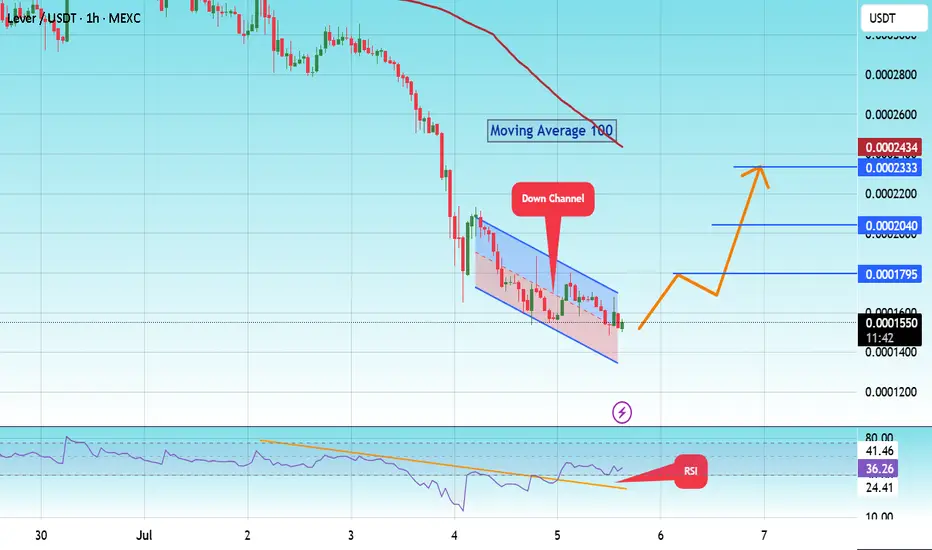
#LEVER/USDT#LEVER
The price is moving within a descending channel on the 1-hour frame and is expected to break and continue upward.
We have a trend to stabilize above the 100 moving average once again.
We have a downtrend on the RSI indicator that supports the upward break.
We have a support area at the lo
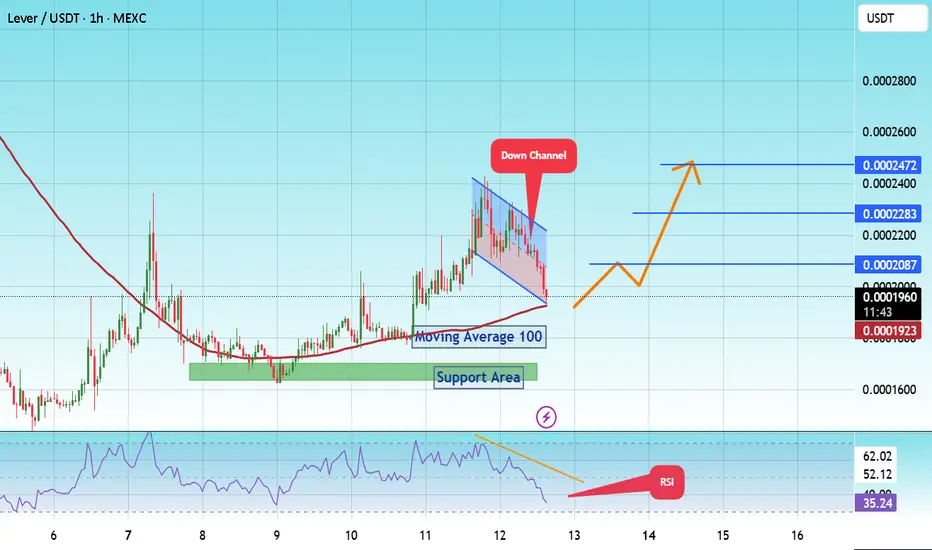
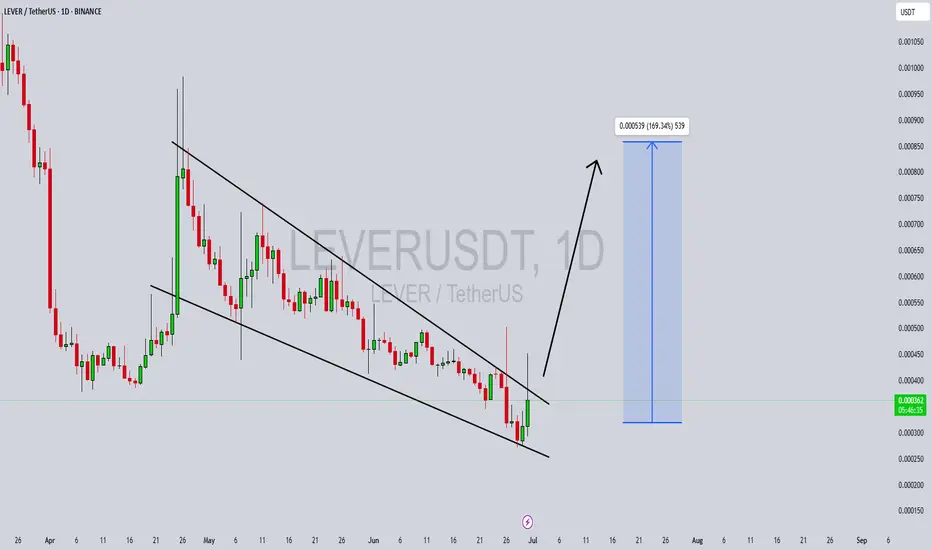
#LEVER/USDT Forming Strong Falling Wedge#LEVER
The price is moving within a descending channel on the 1-hour frame and is expected to break and continue upward.
We have a trend to stabilize above the 100 moving average once again.
We have a downtrend on the RSI indicator that supports the upward move with a breakout.
We have a support
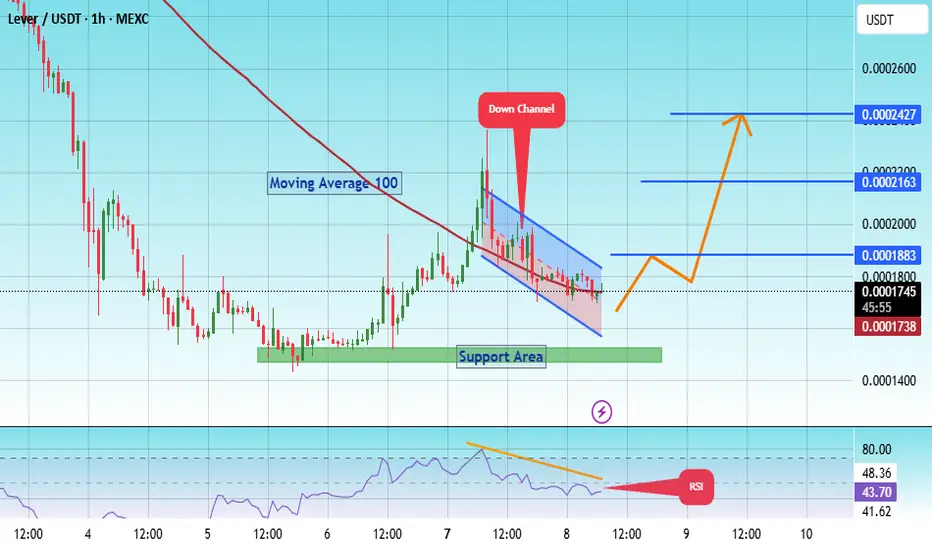
#LEVER/USDT#LEVER
The price is moving within a descending channel on the 1-hour frame, adhering well to it, and is on its way to breaking it strongly upwards and retesting it.
We have a bounce from the lower boundary of the descending channel. This support is at 0.00016000.
We have a downtrend on the RSI ind
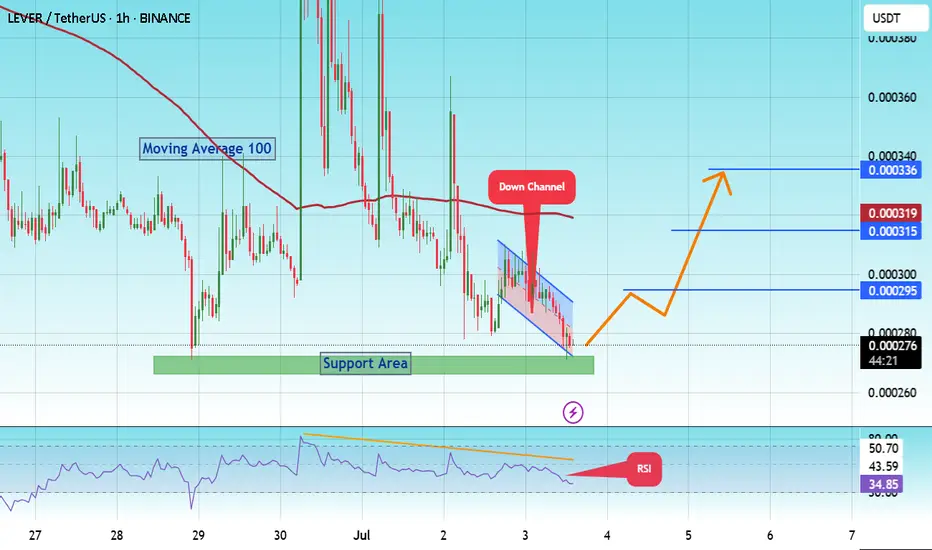
#LEVER/USDT Bullish ?#LEVER
The price is moving within a descending channel on the 1-hour frame and is expected to break and continue upward.
We have a trend to stabilize above the 100 moving average once again.
We have a downtrend on the RSI indicator that supports the upward break.
We have a support area at the lo
LEVERUSDT Forming Falling WedgeLEVERUSDT is showing a highly promising setup that’s generating buzz among traders and investors alike. The crypto pair is forming a classic Falling Wedge Pattern, which is widely recognized as a bullish reversal signal in technical analysis. This pattern often indicates that selling pressure is wea
LEVERUSDT Forming Strong Falling WedgeLEVERUSDT is currently showing a strong Falling Wedge Pattern, a bullish reversal formation that often precedes sharp upward movements. The recent price structure suggests consolidation is ending, and buyers are preparing for a breakout. This setup, coupled with increasing volume, indicates accumula


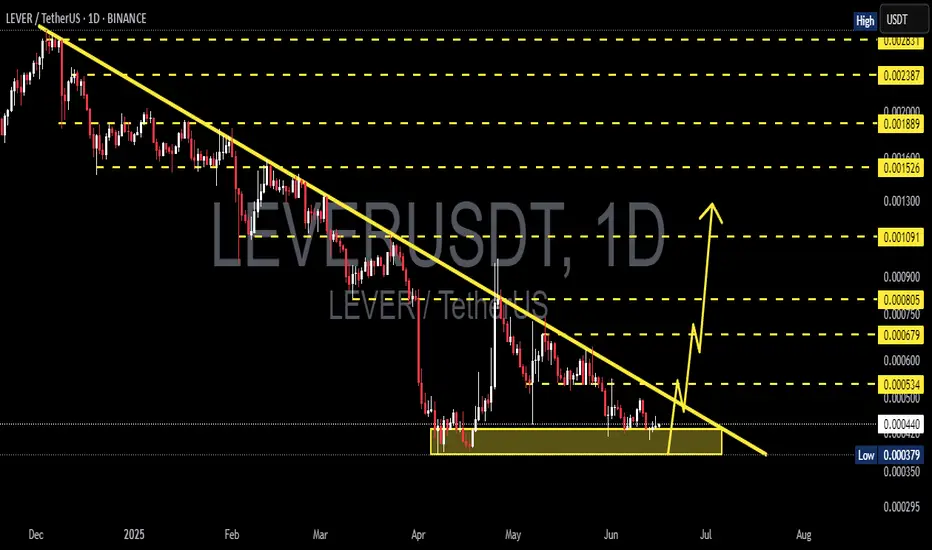
LEVERUSDT 1D AnalysisLEVER ~ 1D Analysis
#LEVER This trade is very risky. Buy if you still have confidence in this coin with a short term target of at least 15%+ from this support.
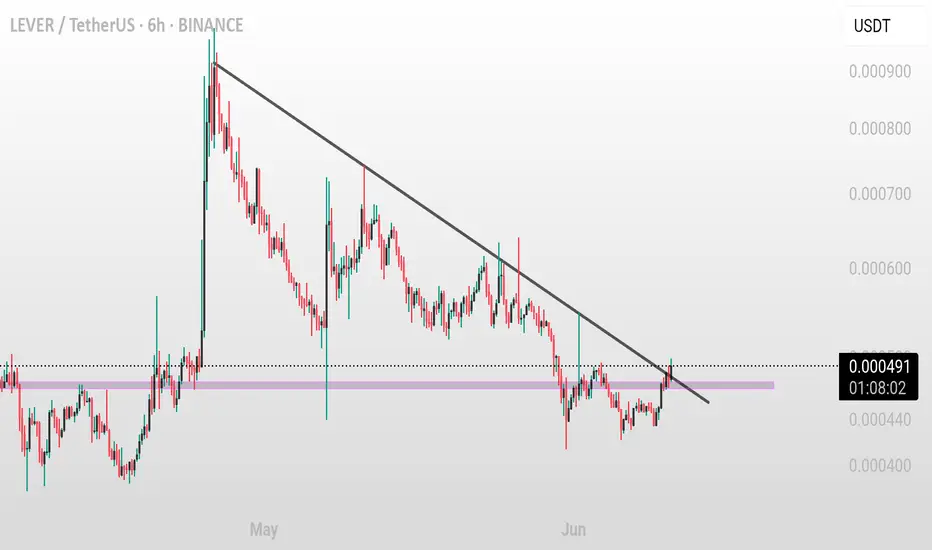
LEVER/USDT (6H) – Trendline Breakout in Progress LEVER/USDT (6H) – Trendline Breakout in Progress
Pattern: Descending Trendline Breakout
Timeframe: 6-Hour ⏱️
Pair: LEVER/USDT 💱
Published: June 10, 2025 📅
Technical Overview:
LEVER/USDT has been trading under a consistent downward trendline, making lower highs over several weeks. Price is now a
See all ideas
Summarizing what the indicators are suggesting.
Oscillators
Neutral
SellBuy
Strong sellStrong buy
Strong sellSellNeutralBuyStrong buy
Oscillators
Neutral
SellBuy
Strong sellStrong buy
Strong sellSellNeutralBuyStrong buy
Summary
Neutral
SellBuy
Strong sellStrong buy
Strong sellSellNeutralBuyStrong buy
Summary
Neutral
SellBuy
Strong sellStrong buy
Strong sellSellNeutralBuyStrong buy
Summary
Neutral
SellBuy
Strong sellStrong buy
Strong sellSellNeutralBuyStrong buy
Moving Averages
Neutral
SellBuy
Strong sellStrong buy
Strong sellSellNeutralBuyStrong buy
Moving Averages
Neutral
SellBuy
Strong sellStrong buy
Strong sellSellNeutralBuyStrong buy
Displays a symbol's price movements over previous years to identify recurring trends.