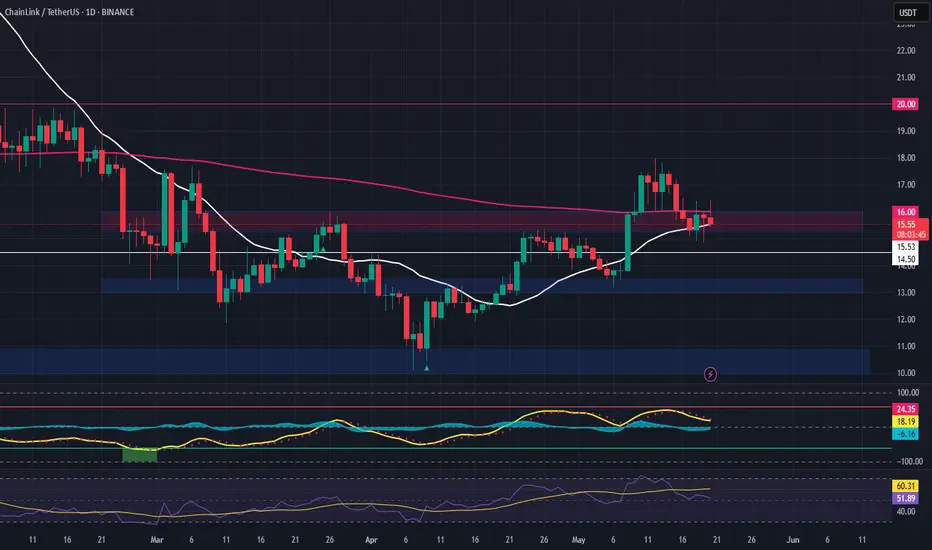
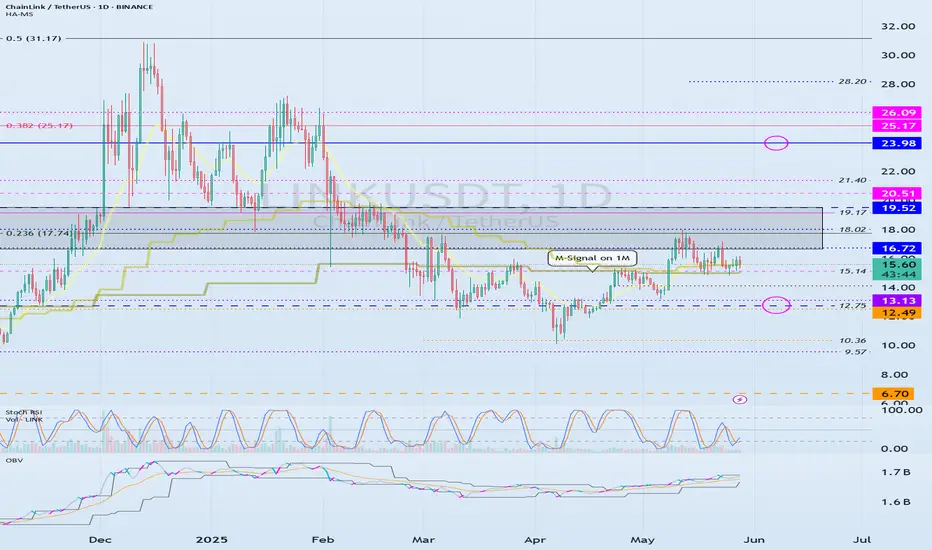
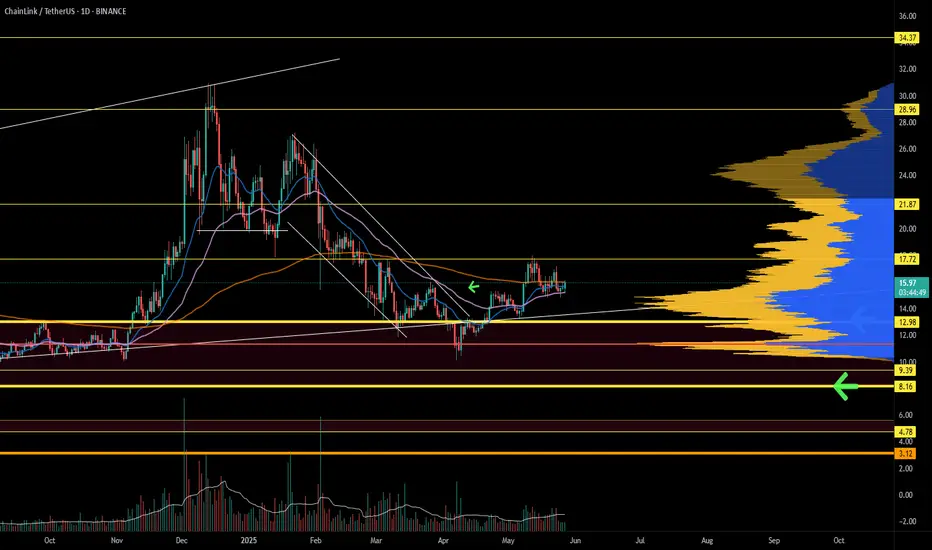
Important Support and Resistance Areas: 16.72-19.52
Hello, traders.
Please "Follow" to get the latest information quickly.
Have a nice day today.
-------------------------------------
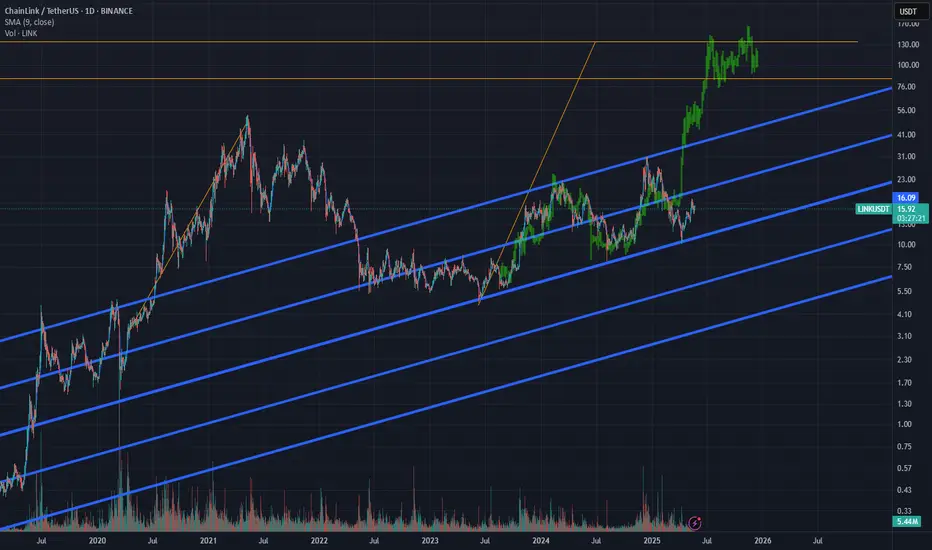
(LINKUSDT 1D chart)
The important support and resistance range is 16.72-19.52.
It is expected that a full-scale uptrend will begin only when it rises above this range.
To do so, we need to see if the price can be maintained above the M-Signal indicator on the 1M chart.
In other words, the key is whether it can receive support and rise around 15.14.
-
If it fails to rise,
1st: 12.49
2nd: 6.70
We need to check whether there is support around the 1st and 2nd ranges above.
-
If it rises above the important support and resistance range, the first resistance range is expected to be around 23.98.
-
Thank you for reading to the end.
I hope you have a successful trade.
--------------------------------------------------
- Here is a description of the big picture.
(3-year bull market, 1-year bear market pattern)
I will explain more details when the bear market starts.
------------------------------------------------------
LINKUSDT.5L trade ideas
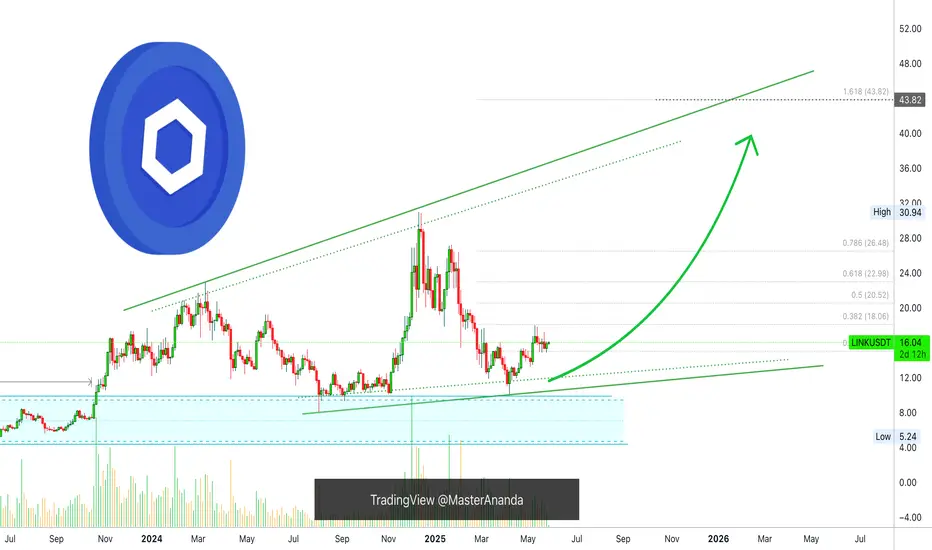
Chainlink Bullish Consolidation Is Over —Low Prices Forever Gone1.5 months growing and what? What do you see?
Prices are still relatively low, Chainlink is yet to move.
This is nothing other than great news. The fact that it hasn't move much just yet, means that it will start to move really strong, very very strong in the coming days.
When was the last time you saw a massive bullish wave on this pair?
When was the last time you experienced 300%, 400% or even 600% growth?
This is it. The time is now.
You will see Chainlink growing day after day, week after week, month after month.
It will be something simply awesome.
The chart is saying up. LINKUSDT has been growing and that's it. Several sessions red, several sessions green, but with a bullish bias.
This type of action tends to resolve into a strong bullish jump. It will take time for it to develop, that is, all the action will not happen in a single day, it can take months, but bullish momentum will grow.
Bullish momentum means excitement, lots of people participating in the market, lots of engagement, lots of entertainment, profits and fun.
The time to be in Crypto is now.
Buy like it is the end of the world.
This is the last chance to get bottom prices. We had almost two entire months.
After the action starts, this type of low prices will be forever gone.
Thanks a lot for your continued support.
Namaste.
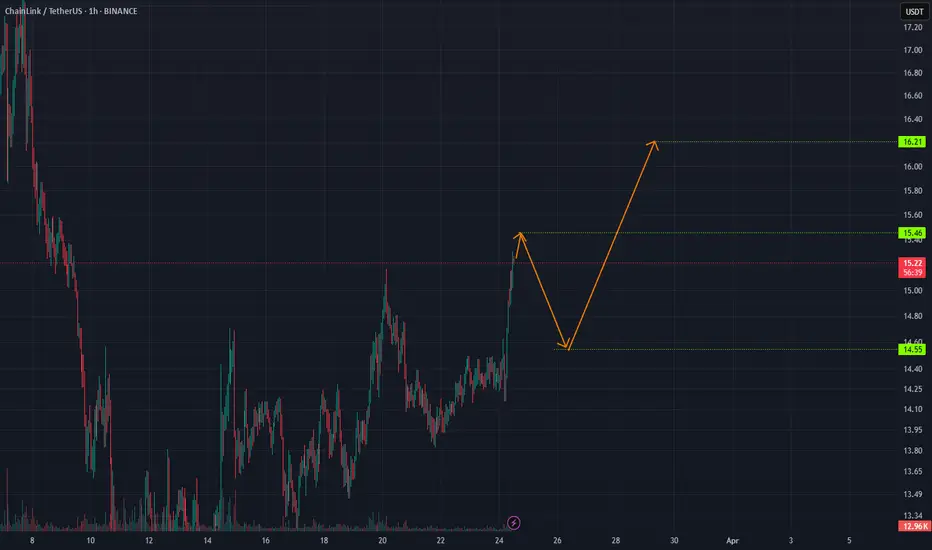
LINK 1H LINK possible path has been drawn
a bit set back and then going even higher is possible
BINANCE:LINKUSDT
𓄀𝓈𝓉𝒶𝓎 𝓉𝓊𝓃ℯ𝒹 𓃓
Interesting breakout moment for LINK LINK is showing signs of follow-through as the momentum potentially gets overbought. After achieving a CHOCH the only thing left is to break above the tops and follow through the volume gap.
Full TA: Link in the BIO
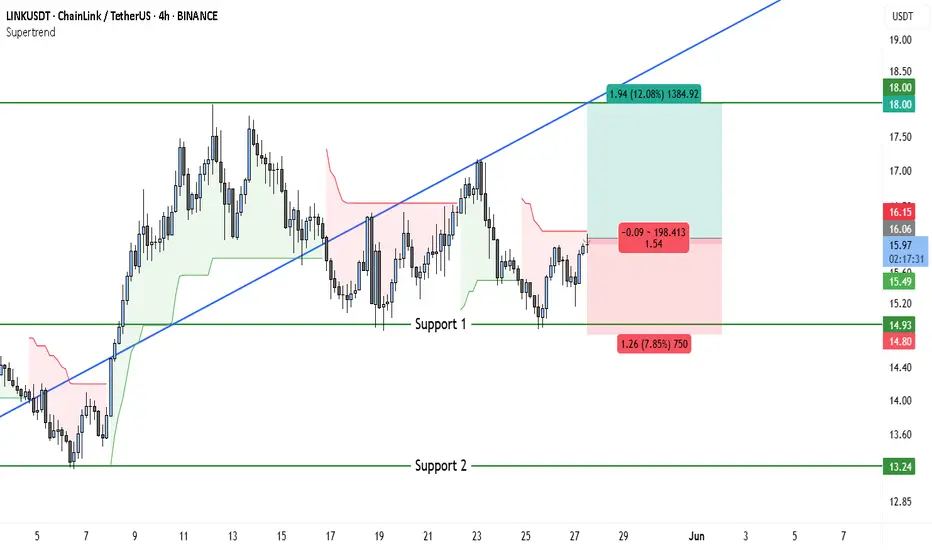
ChainLink (LINK) Bulls Eye $18 as Supertrend Flips Green📈 Market Structure & Trend Overview
• Price is holding a clear ascending trendline, acting as dynamic support.
• The recent bounce from Support 1 at $14.93 indicates that bulls are defending this level aggressively.
• Price is now approaching the mid-zone between support and resistance with bullish momentum resuming.
🧠 Supertrend Indicator Analysis
• The Supertrend is flipping bullish, or recently has, placing the green band below the current price, which confirms the initiation of a buy signal.
• The last bearish wave was rejected near Support 1, and since the Supertrend held as support, it further validates a long bias.
• Supertrend aligning with the trendline and support level adds multi-layered confirmation to this setup.
✅ Trade Setup (Long)
• Entry: $15.96 (current market price at time of analysis)
• Stop Loss: $14.80 (just below Support 1 and trendline structure)
• Take Profit: $18.00 (previous swing high and resistance zone)
• Risk-to-Reward Ratio (RRR): ~1:1.54
• Time Horizon: 2 to 7 days for target to be achieved
📌 Key Technical Highlights
• Support 1 ($14.93): Tested and held multiple times, confirmed by Supertrend flip.
• Support 2 ($13.24): Deeper fallback zone; breach would invalidate bullish bias.
• Resistance ($18.00): Swing high and Fibonacci alignment, making it a strong TP zone.
• Supertrend: Currently bullish; enhances trade confidence with trend-following confirmation.
$31 Target in Sight for LINK !Hello Traders 🐺
I hope you’re doing well!
In this idea, I want to talk about one of my favorite coins — one that I truly believe is going to pump extremely well. I’m also heavily invested in it for this upcoming Altcoin season. So in this post, I’ll share my personal price target for LINK, so make sure to stick with me until the very end if you’re currently one of the ChainLink holders. 👇
First of all, let’s talk about the immediate short term and go through the key levels that need to break — then we’ll discuss the mid-term targets and my personal price expectations:
📉
As you can see on the chart above, price is currently holding above the 4H support zone. If BTC.D starts to dump, we’ll probably see a breakout through the orange resistance line, which is the wedge pattern resistance.
However, if ETH fails to break above the current high around $2750, there’s a chance for another retest below the green support zone for LINK.
📈
Now let’s talk about the mid-term target:
In my opinion, if the price breaks above the wedge pattern — which I believe is quite likely in the next two months — the first target would be the top of the wedge at $31. That means if you enter after the breakout, you could potentially enjoy around +90% profit on spot! 🚀
As for the long-term target, I think it’s still a bit early to talk about that. I’ll need to see more confirmations before I reveal more details about my full Altcoin season plan.
Thanks for reading this idea — and as always, remember our golden rule:
🐺 Discipline is rarely enjoyable, but almost always profitable. 🐺
🐺 KIU_COIN 🐺

Chainlink Price forcasting on 27/May/2025Chainlink Price forecasting on 27/May/2025 . My goal is 18$. I think it will reach in the next 10 hours. So keep watching.

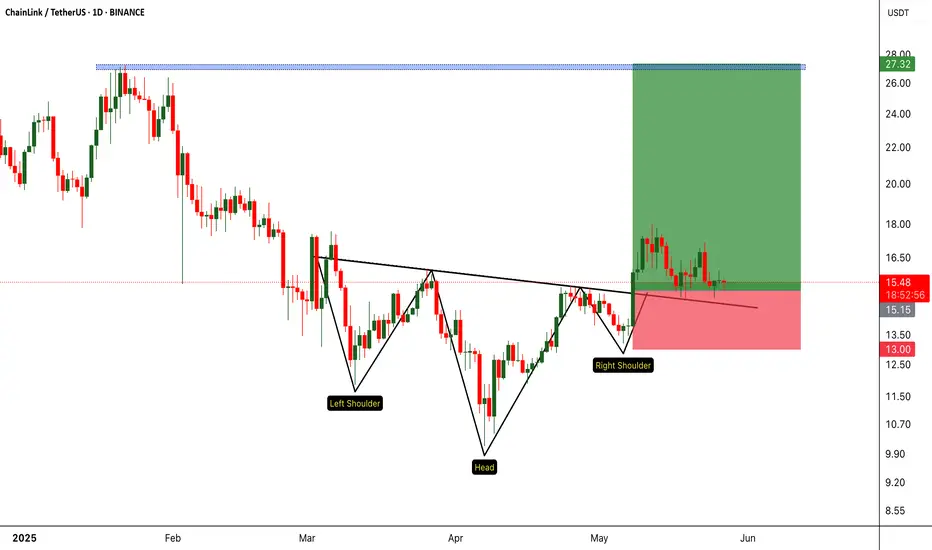
LINKUSDT: Inverse Head & Shoulders Breakout! The Reversal BeginsBINANCE:LINKUSDT has broken out of a classic inverse head and shoulders pattern — a well-known bullish reversal formation. After the breakout, price action showed strength by coming back to retest the neckline support and holding it successfully. This confirms the pattern and signals a potential shift in trend.
From a technical perspective, this setup is highly promising. The market structure indicates a likely reversal after an extended downtrend, and the breakout could be the start of a strong bullish phase. With solid fundamentals backing BIST:LINK , the rally could gain serious momentum once it gets going.
This pattern isn’t just any breakout — it’s a reversal of the reversal, a major turning point in trend. If bulls take control, this move has the potential to accelerate rapidly. However, it’s crucial to always manage risk, use a well-placed stop-loss, and avoid overexposure.
Get ready — once the rally starts, it might be unstoppable!
BINANCE:LINKUSDT Currently trading at $15.5
Buy level : Above $15
Stop loss : Below $13
Target 1: $17
Target 2: $1.4
Target 3: $2.1
Max leverage 3x
Always keep stop loss
Follow Our Tradingview Account for More Technical Analysis Updates, | Like, Share and Comment Your thoughts
LINK 1WOne of the best projects in the Oracle Sector is undoubtedly $LINK. Given its strong position in the weekly timeframe, there is a potential for it to reach the channel's upper limit and establish a new high. I recommend that you analyze it yourself for a better understanding.

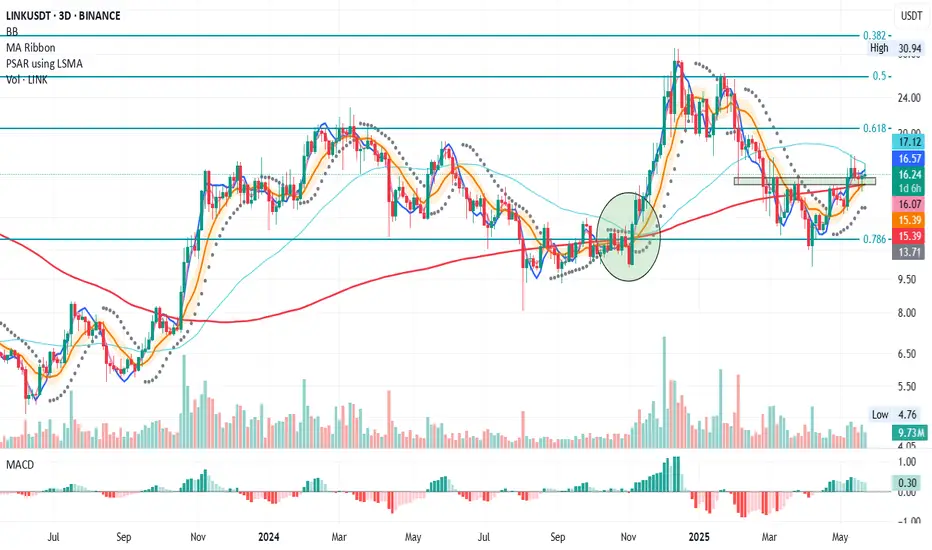
LINK 3D – Watching the 50MA Reclaim
After a clear rejection at the 200MA on April 25, LINK is now trading above the 200MA, but has faced rejection at the 50MA.
The green zone represents a key support area that started forming on Feb 3.
✅ MLR > SMA > BB Center, confirming that the bullish structure remains intact.
🔍 Note how the BB center and SMA are now aligned. The last time this happened (see orange zone) was also after a drop, and the recovery only started after price reclaimed the 50MA.(see green circle)
Unless macro headwinds (e.g. tariff war escalation) drag the market down, the key level to watch is the 50MA. A close above it could mark the next leg up. 📈
Thanks for reading!
If you found this useful, give it a like or drop a comment.
Manage risk, take profits.
LINKUSDT 1D AnalysisLINK ~ 1D Analysis
#LINK Buy after successfully breaking through this resistance line with a short-term target of at least 10%++


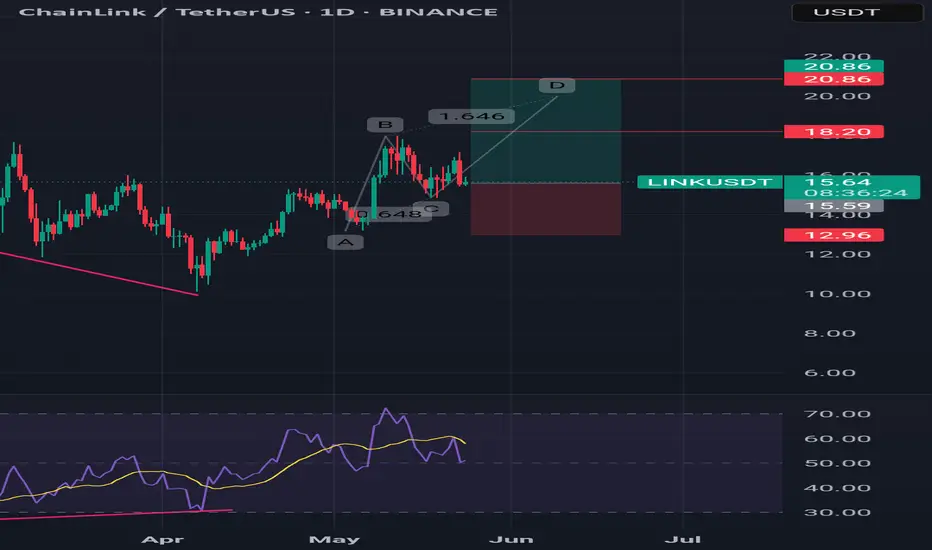
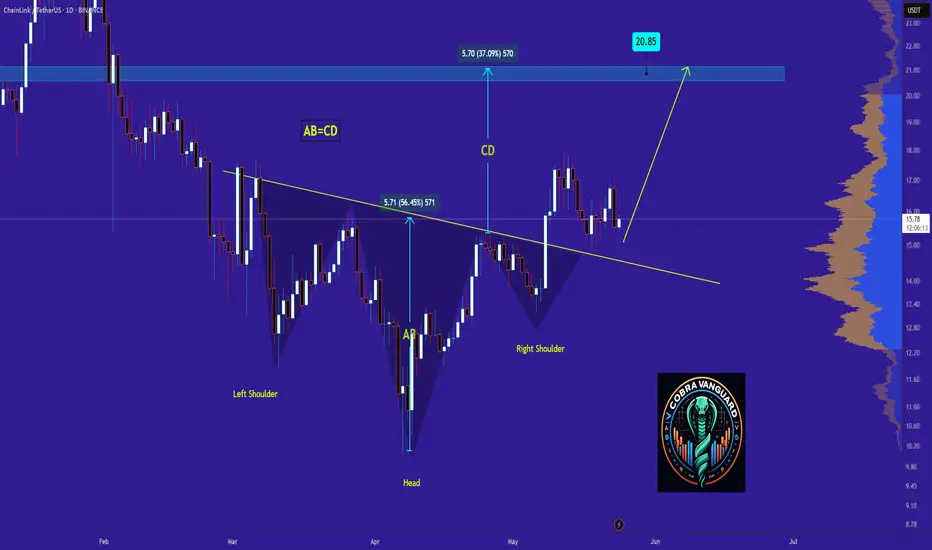
XRP - Time to buy again!The pattern has broken, and now I expect the price to rise to $20 . AB=CD.
Give me some energy !!
✨We spend hours finding potential opportunities and writing useful ideas, we would be happy if you support us.
Best regards CobraVanguard.💚
_ _ _ _ __ _ _ _ _ _ _ _ _ _ _ _ _ _ _ _ _ _ _ _ _ _ _ _ _ _ _ _
✅Thank you, and for more ideas, hit ❤️Like❤️ and 🌟Follow🌟!
⚠️Things can change...
The markets are always changing and even with all these signals, the market changes tend to be strong and fast!!
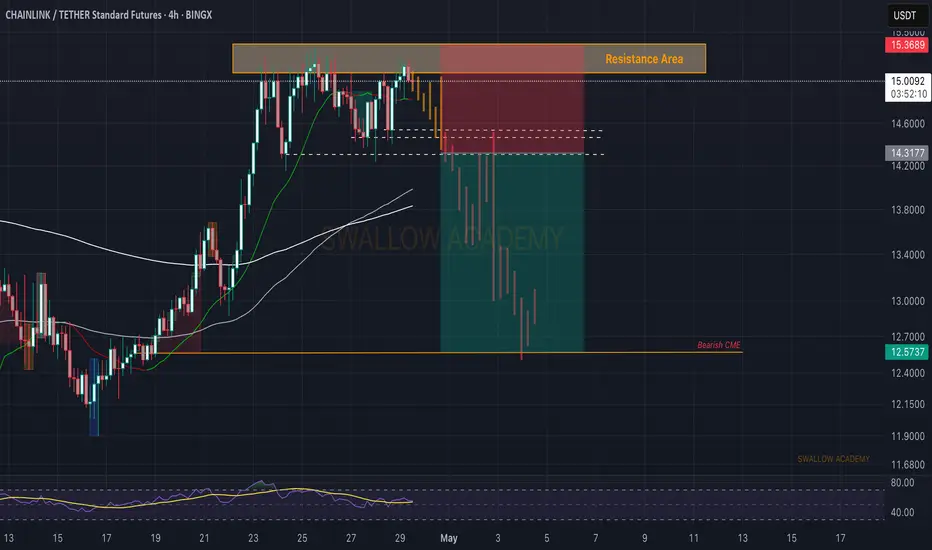
Chainlink (LINK): We Might Go Towards Unfilled Bearish CME GapChainlink, it seems to us, has formed a proper resistance zone where price is struggling to break out from.
We are waiting here to see further weakness in markets and a break of our zones, which would lead the price to our target of bearish CME. That's our plan for Chainlink so let's wait for a breakdown now!
Swallow Academy
Chainlink (LINK): Good Selling Opportunity With Good Risk/RewardChainlink has a great chance of moving to lower zones where we see 3 signs of turnover happening on a 4-hour timeframe and a formation of MSB, which is happening on smaller timeframes of 5 minutes. Might be a good RR 1:4 trade that can be taken here!
More in-depth info is in the video—enjoy!
Swallow Academy

Chainlink (LINK): Chainlink Approaching 200EMA LineChainlink is approaching the major EMA, which historically has been a point of turnover. We are going to wait for a clear touch to that zone, after which we are going to look for a fakeout to form and MSB, which would give us a proper entry for a short trade here.
Swallow Academy

Chainlink (LINK): Might See 20% Upward Movement | Trade of AprilChainlink caught our attentions with a good possibility of upward movement here once we see a proper breakout from middle line of Bollinger Bandsa good R:R position can be take
More in-depth info is in the video—enjoy!
Swallow Academy

LINKUSDT / WEEKLY TPThe price, after a fake breakout at the end of the long-term channel, has returned inside the channel. If the descending channel is broken, the price will move toward its all-time high (ATH).Considering the possibility of a bull run in the second half of 2025, the price could easily reach $150 and $180 during the altseason rally.
This is just my personal opinion!!!!!!!!!!
Always use a stop-loss

$LINK just broke the trendline! It's prob going to 40$Chainlink (LINK) offers compelling technical advantages by addressing the "oracle problem" with a decentralized and, its continuous focus on scalability and performance, evidenced by upgrades like Multistream, ensures its foundational role in the evolving Web3 ecosystem.
However, from a technical analysis perspective, CRYPTOCAP:LINK has recently faced selling pressure, struggling to reclaim key resistance levels around $18 and $17.61, and could see further downside towards the $10-$15 support zones if current bearish momentum persists, with the $15.00 mark being a crucial level to watch for invalidation of recent bullish patterns.

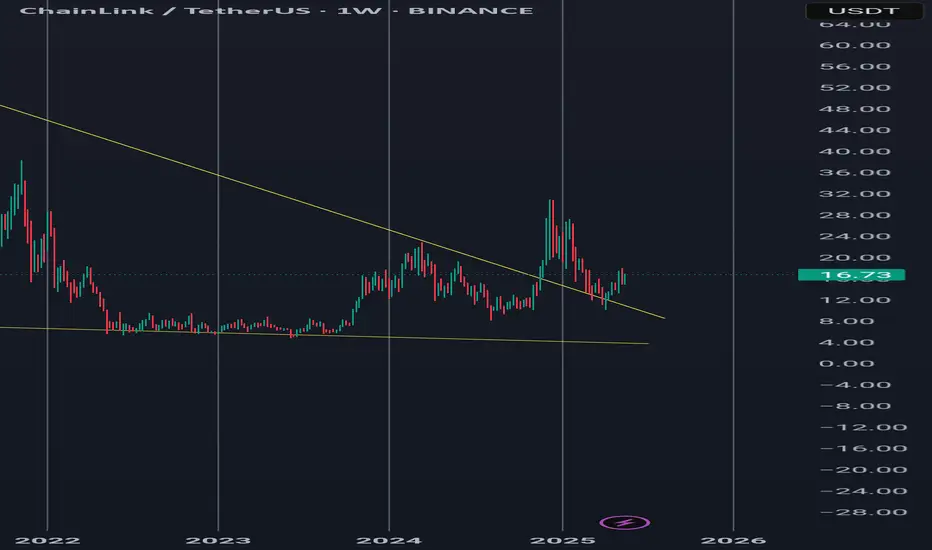
Title: Chainlink (LINKUSDT) – Neowave Perspective & 2025 Outloo
The weekly chart of Chainlink (LINK/USDT) reveals a significant long-term contracting triangle pattern, perfectly aligned with concepts from Glenn Neely’s NeoWave theory. Here’s a breakdown of the structure and outlook:
---
Neowave Structure Analysis
1. Contracting Triangle Formation
From the all-time high near $52 in 2021, LINK entered a prolonged corrective phase.
The price action from 2021 to late 2023 formed a well-defined contracting triangle, a classic pattern in NeoWave theory.
These patterns typically appear in wave B or wave 4, indicating a correction phase nearing completion.
2. Stable Base Formation (Wave E)
The long horizontal price consolidation between mid-2022 and early 2023 likely represents wave E, the final leg of the triangle.
According to NeoWave rules, once wave E completes, a strong directional move often follows.
3. Breakout & Retest
In early 2025, LINK broke out above the triangle's resistance and has since pulled back to retest it.
This behavior strongly suggests the triangle has completed, and a new impulsive wave (likely wave C or wave 3) has started.
Price Forecast – End of 2025
If this breakout confirms the beginning of a new motive wave (either wave 3 or wave C), we can project the following price targets:
First Target: $25 – $30 (initial wave 1 of the new move)
Second Target: $40 – $50 (full extension of wave 3 or C)
Assuming Bitcoin remains stable or bullish, and LINK maintains its structure:
> Projected Price for LINK by End of 2025: Between $30 and $45
This projection aligns with classic NeoWave post-triangle expectations.
Summary
LINK has completed a textbook contracting triangle.
The breakout and retest suggest a new impulsive phase has begun.
Price action points toward strong upside potential into late 2025.
As long as LINK holds above the triangle resistance (~$12), the bullish structure remains vali
Let me know if you’d like a version with chart annotations or hashtags for better visibility on TradingView.
potential short-term price increasepotential bullish movement in the near future, signals indicate upwards price movement
LINK (Chainlink) – Breakout Setup Aligned With BTC Macro MoveWith BTC on the verge of a new all-time high, the market is poised for high-beta altcoins like LINK to follow with strength. LINK is currently testing the 200-day EMA — a critical momentum indicator. If BTC confirms breakout and LINK holds this zone, it sets up a high-probability continuation play.
🔹 Entry Zone:
$16 (on confirmation of support at 200-day EMA)
🎯 Take Profit Targets:
🥇 $20 (prior range high / psychological resistance)
🥈 $25 (multi-month breakout level)
🥉 $30 (macro extension target)
🛑 Stop Loss:
Daily close below $14.50 (breakdown of EMA support and invalidation of current structure)