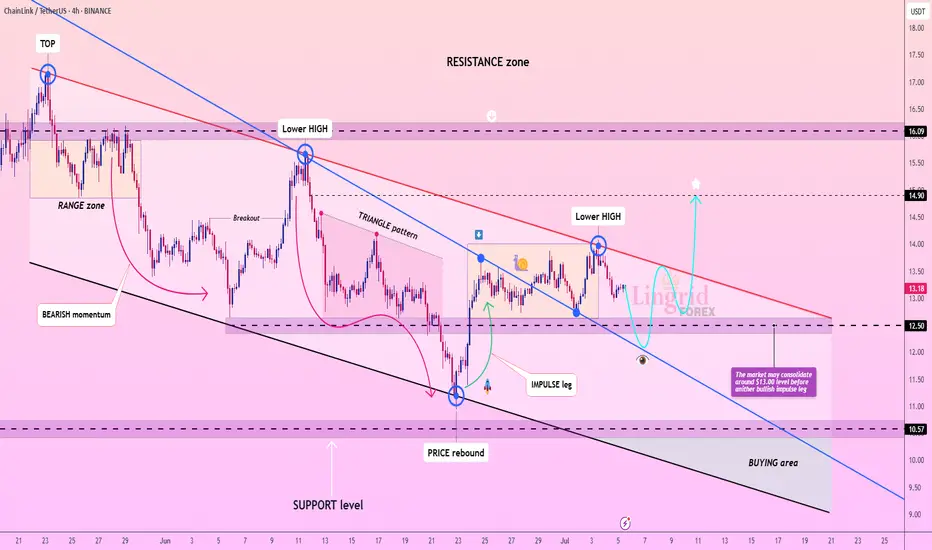
Lingrid | LINKUSDT potential Bullish BreakoutBINANCE:LINKUSDT has formed a sequence of lower highs beneath a descending red trendline, indicating that bearish pressure remains dominant. After a recent rejection near $13.80, price action is now pulling back toward the $12.50–$13.00 range where consolidation is likely. The structure suggests a
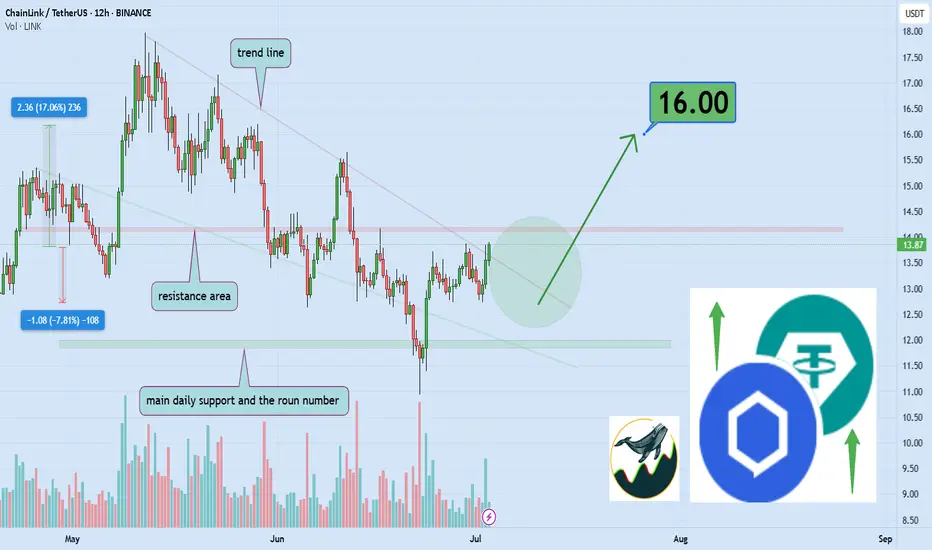
Will this breakout unlock 17% gains toward the $16 target?Hello, ✌
All previous targets were nailed ✅! Now, let’s dive into a full analysis of the upcoming price potential for Chain LINK 🔍📈.
BINANCE:LINKUSDT is currently testing the psychological daily resistance zone around the $14.00 level. A confirmed breakout above this area could open the way fo
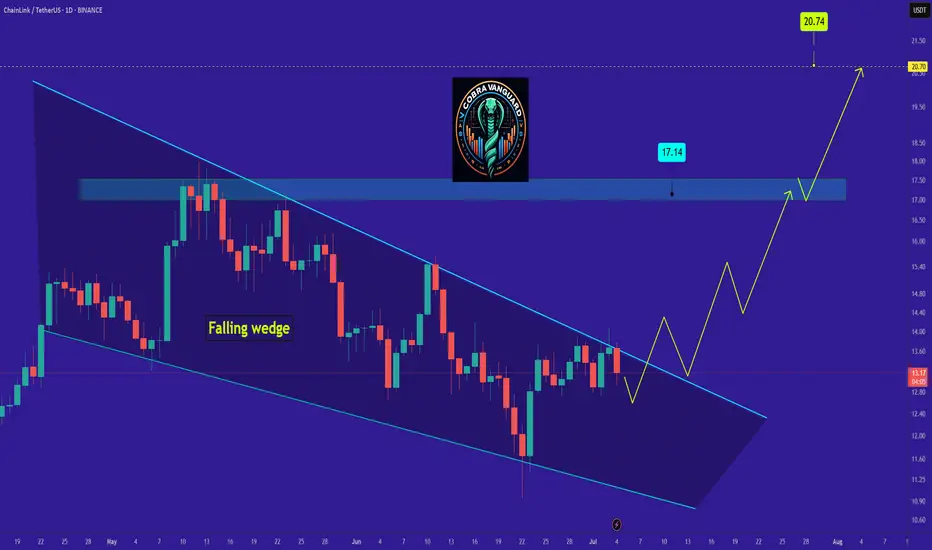
LINK's Situation, A Comprehensive Analysis !!!So if you pay attention to the LINK chart you can see that the price has formed a Ascending wedge which means it is expected to price move as equal as the measured price movement.( AB=CD )
NOTE: wait for break of the WEDGE .
Best regards CobraVanguard.💚
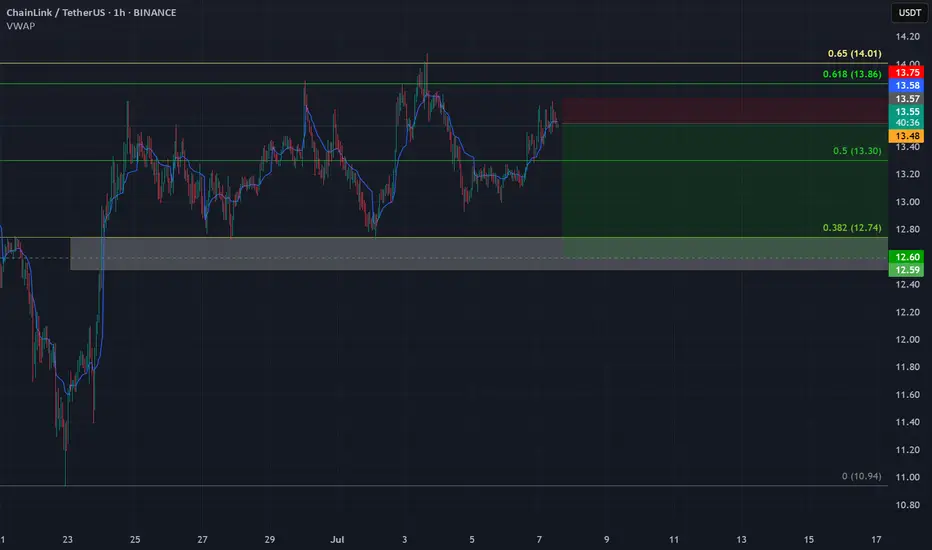
SHORT - LINKUSDTCVD divergence
Order flow showing OI rise + Net Short rise at 08:30 - Aggressive sellers kicking in
Watch out for a short squeeze above 13.750.
Imbalance between 12.50 and 12.73 - Target is AB=CD of the initial move. Price likely to bounce there.
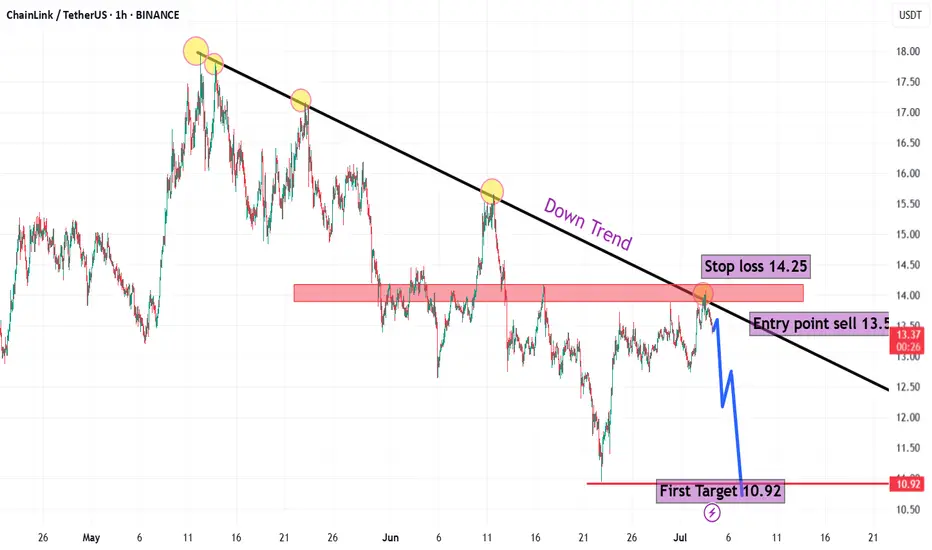
LINK/USD🧠 Technical Overview:
General Trend: The chart shows a clear downtrend starting from mid-May.
Each upward attempt is rejected at the descending trendline, confirming the bearish bias.
🧩 Chart Analysis Elements:
1. Trendline:
Drawn accurately from the major highs, acting as a strong dynamic resista
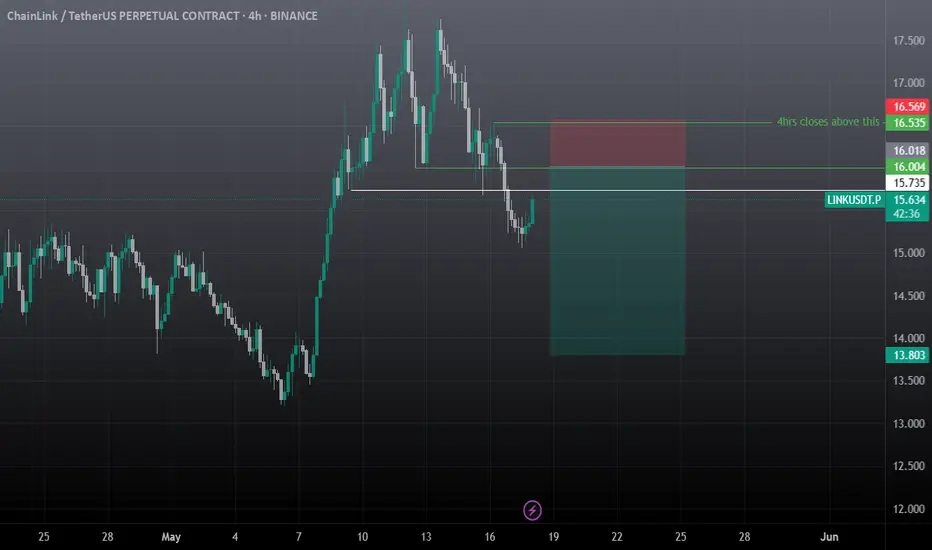
Link short setup tradeAS previous short setup hits the tp but actually first manipulation to hit the sl, now closely monitor the trade and manually close if 4hr candle closes above the mentioned point, overall I'm bearish on whole market, needs to take a correction before another leg up, until unless usdt.d breaks and cl
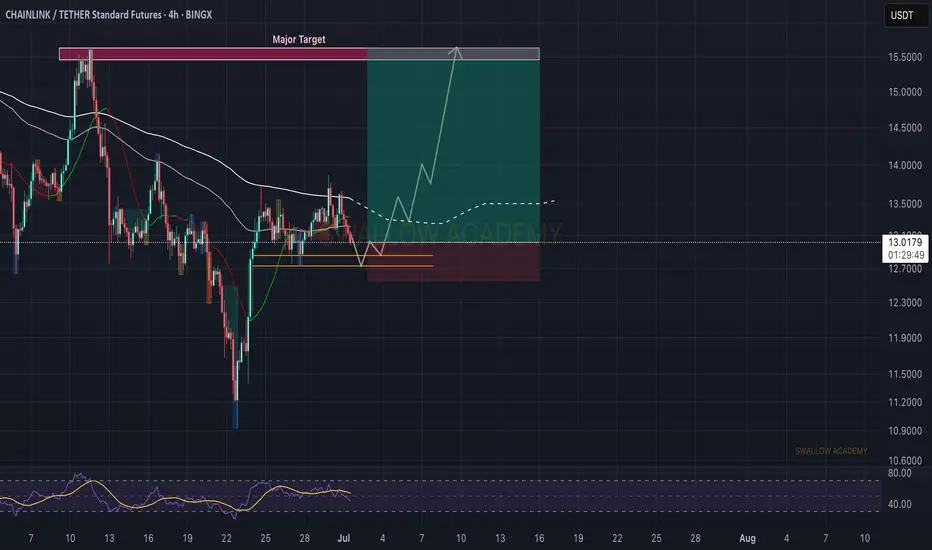
Chainlink (LINK): Looking For Proper MSB (market structure breakChainlink struggled to break the local 200EMA line, where the price is hovering between the support area at $12.83 and the 200EMA line.
Nevertheless, we are still seeing the demand for breakout so we are expecting to see some sort of buyside movement with proper MSB, which would back our trade ide
LINK/USDT Chainlink Gearing Up for a Major Breakout?
🧠 Overview:
The LINK/USDT chart is showcasing a high-conviction technical setup — a well-defined Descending Triangle that has been forming for over 6 months. This pattern often acts as a pressure-cooker scenario, building up momentum before a major breakout.
The triangle is composed of consistent
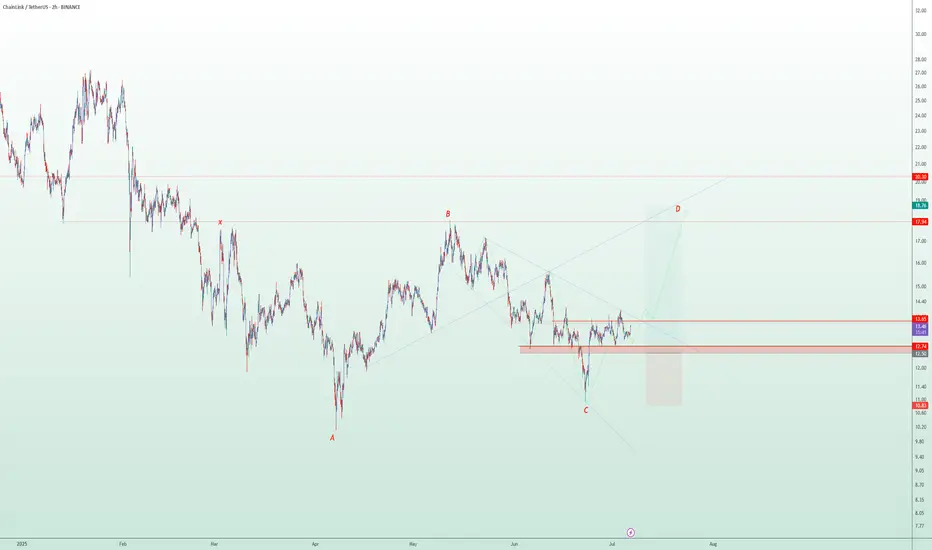
Wings of Opportunity: LINK’s Harmonic Setup Unfolding🦋 Title: A Butterfly on the Edge – But Only with Confirmation
On the 2H timeframe, a Bullish Butterfly Harmonic Pattern is unfolding. The wave structure (X → A → B → C → D) aligns closely with harmonic principles, and point D lies above X, within the 1.27 to 1.618 Fibonacci extension of XA — reinfor
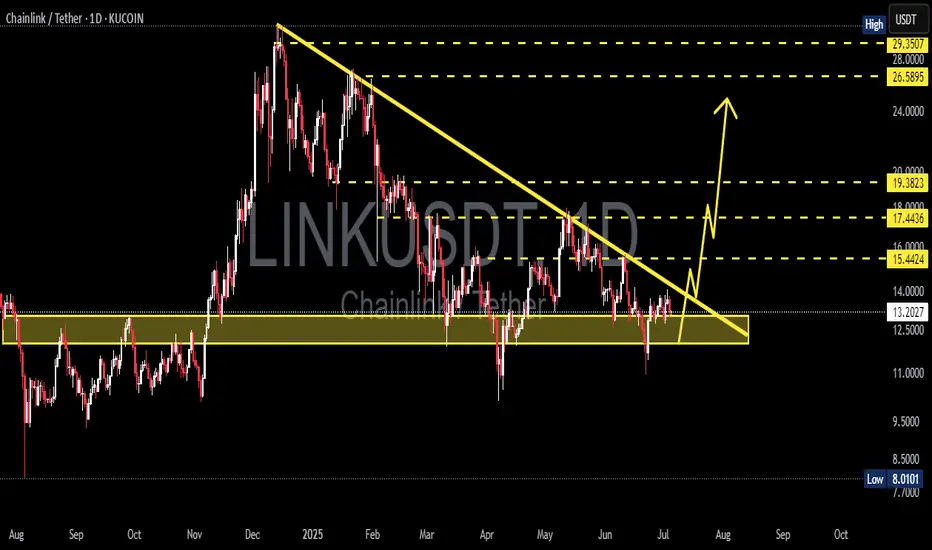
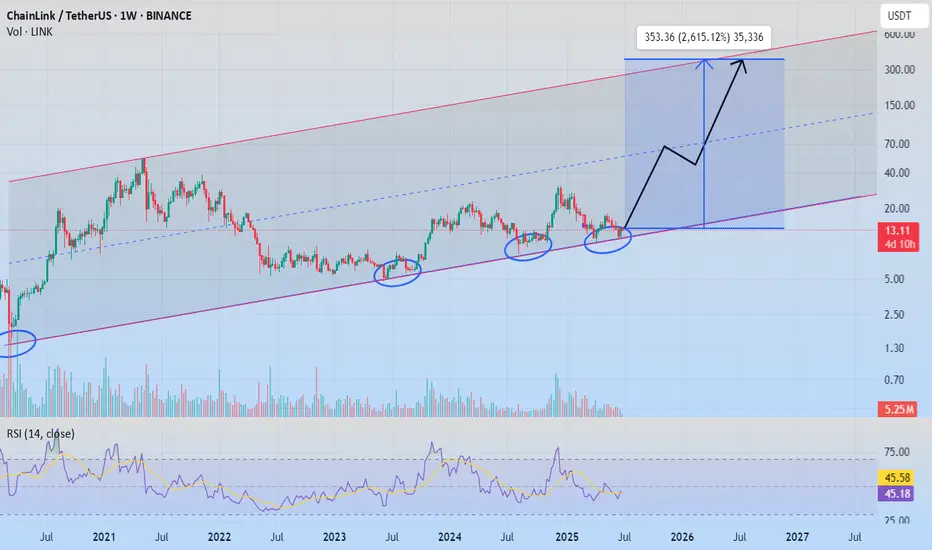
Link 26X Next Bull RunChainLink
Chainlink is the platform that connects real-world data, governments, enterprise systems, and thousands of blockchains into unified applications .
It is considered one of the strongest currencies in the market, and will achieve very high numbers in the future. We note that the currency
See all ideas
Summarizing what the indicators are suggesting.
Oscillators
Neutral
SellBuy
Strong sellStrong buy
Strong sellSellNeutralBuyStrong buy
Oscillators
Neutral
SellBuy
Strong sellStrong buy
Strong sellSellNeutralBuyStrong buy
Summary
Neutral
SellBuy
Strong sellStrong buy
Strong sellSellNeutralBuyStrong buy
Summary
Neutral
SellBuy
Strong sellStrong buy
Strong sellSellNeutralBuyStrong buy
Summary
Neutral
SellBuy
Strong sellStrong buy
Strong sellSellNeutralBuyStrong buy
Moving Averages
Neutral
SellBuy
Strong sellStrong buy
Strong sellSellNeutralBuyStrong buy
Moving Averages
Neutral
SellBuy
Strong sellStrong buy
Strong sellSellNeutralBuyStrong buy
Displays a symbol's price movements over previous years to identify recurring trends.