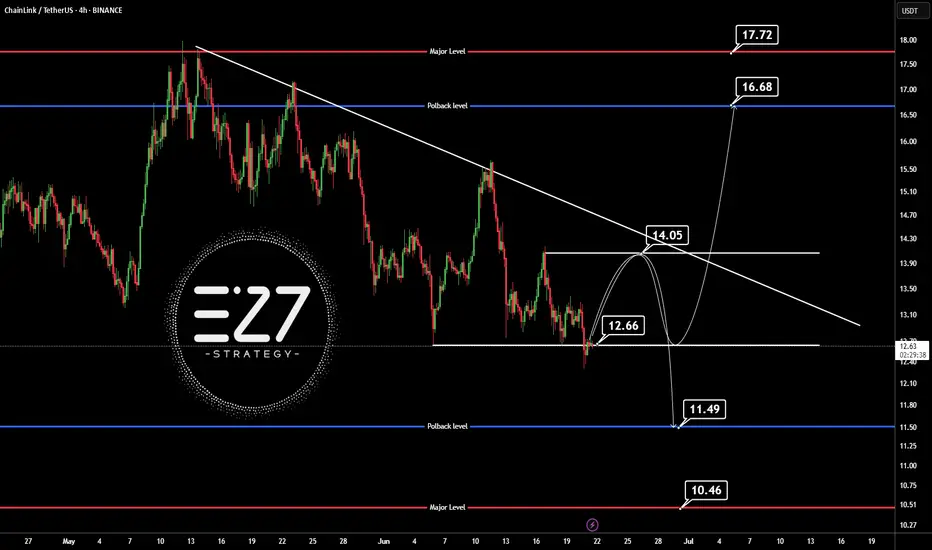
LINKUSDTThis is chart ready for pump but wait for break 14$. BINANCE:LINKUSDT
I in below say best supports and resistance's.
Support:
12.66
11.50
10.50
resistance's:
14
16.68
17.70
⚠️Contorl Risk management for trades.
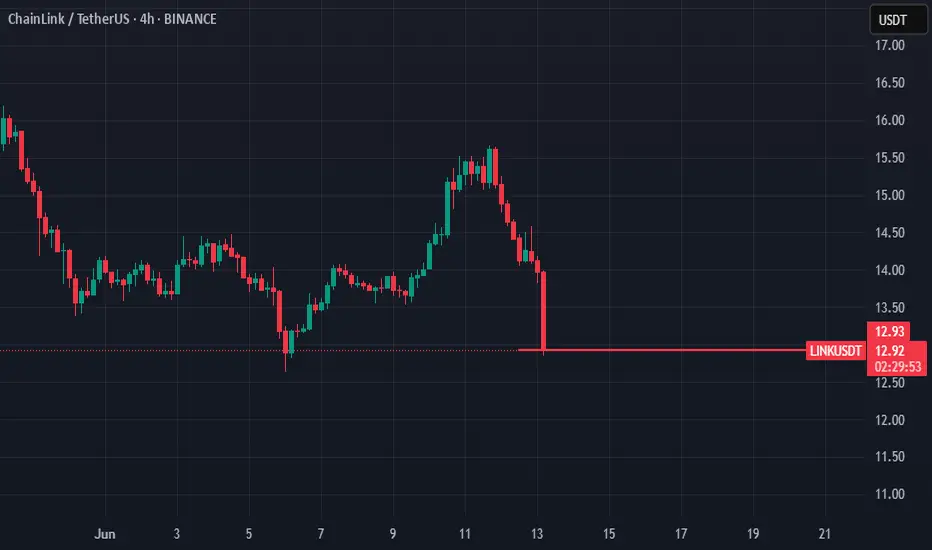
Chainlink (LINKUSDT) | Falling Wedge at Critical SupportChainlink is trading within a well-defined falling wedge pattern on the 4H chart, a typically bullish reversal setup. Price action indicates the coin is hovering just above key horizontal support around $12.35, making this a critical zone to watch.
Technical Breakdown:
Pattern: Falling Wedge (Bulli

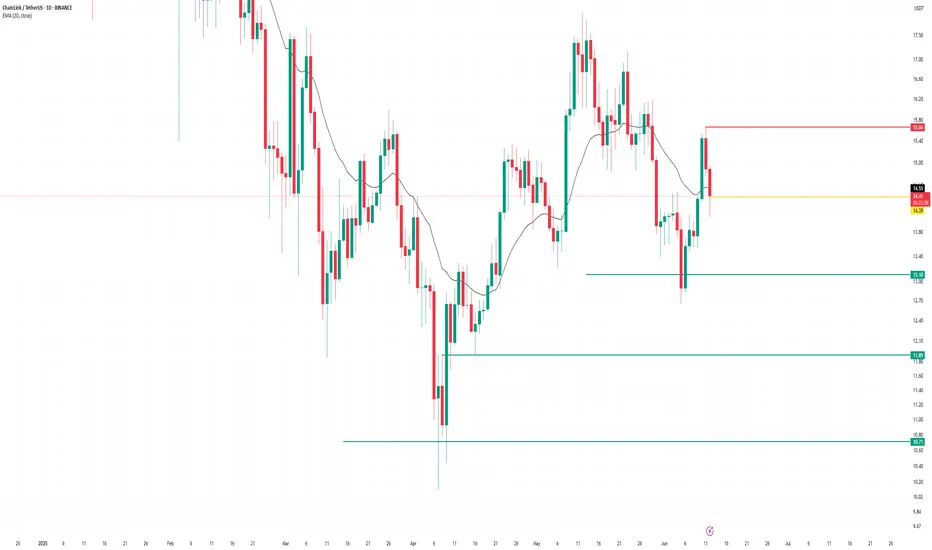
LinkEntry price yellow line
Stop loss update from red line to yellow line
We hit first Take profit
I Close full now
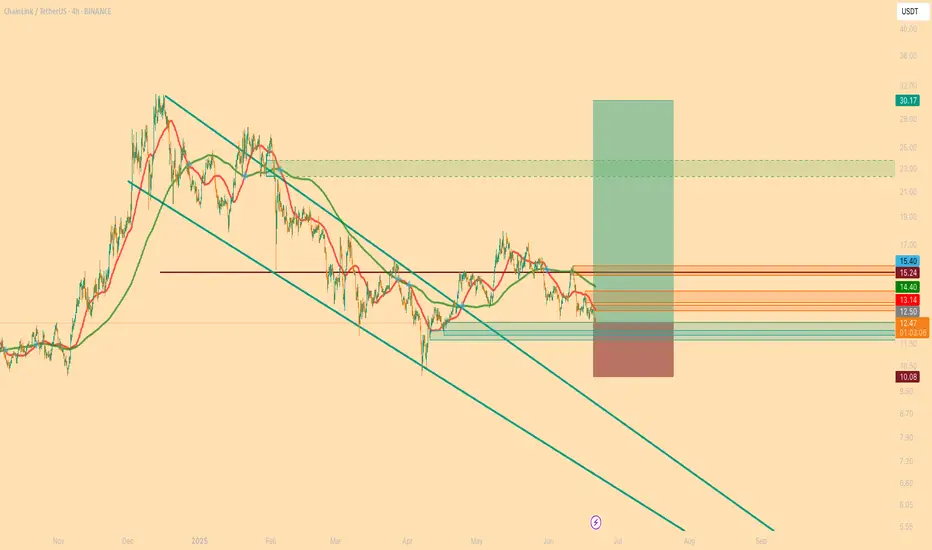
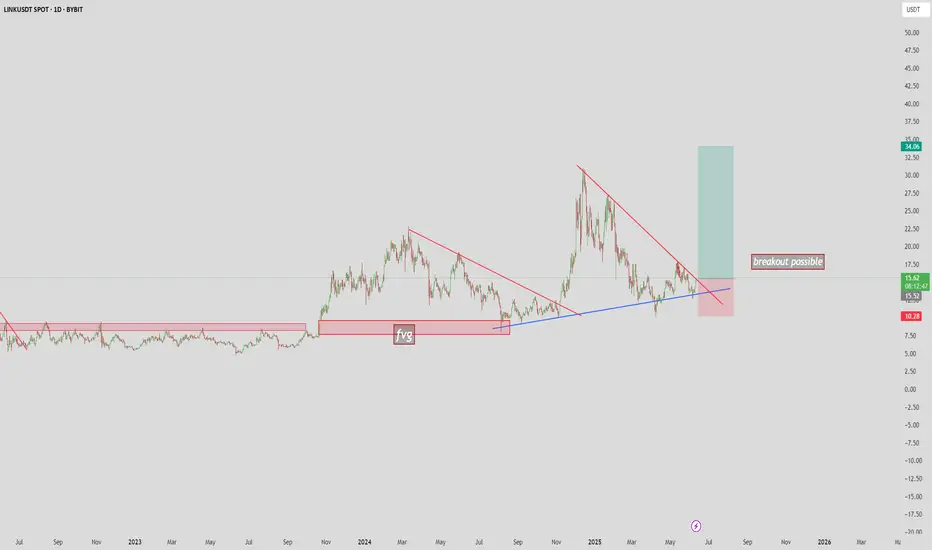
$LINK | Higher Timeframe LONG SetupThe falling wedge pattern visible on the chart has broken to the upside — a historically bullish formation that often signals a reversal. However, it’s important to note that price has not yet reclaimed the EMAs.
📌 The key invalidation level is below the April 7 wick.
As long as there is no candle
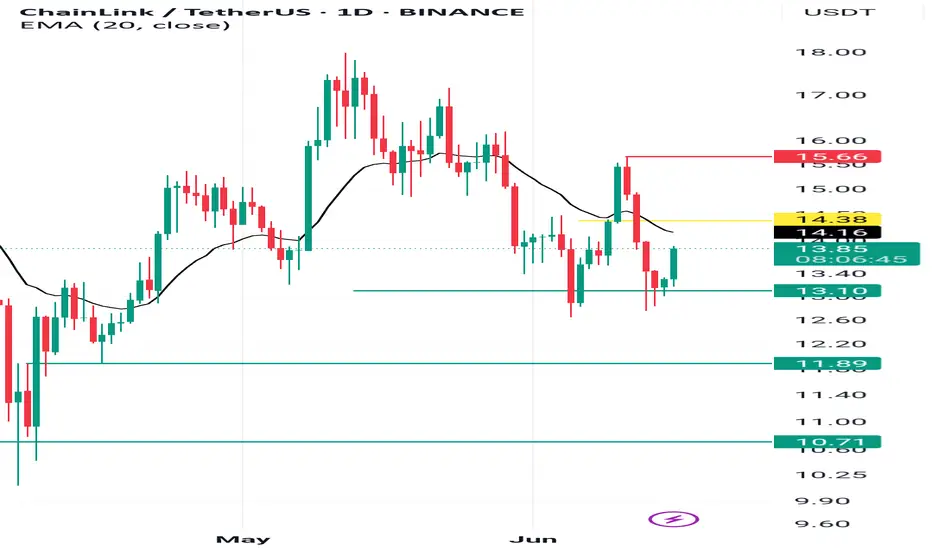
Chainlink Price on 14/June/2025Chainlink is trading at 13.25$ as of 14/June/2025. In Next week, It need to retest at 12.4$ -12.6$ before it break 15.51$. To claim the bull the price should be 20$.
linkusdt is in pumping conditionlink can break daily resistance. can good give profits in upcoming market conditions
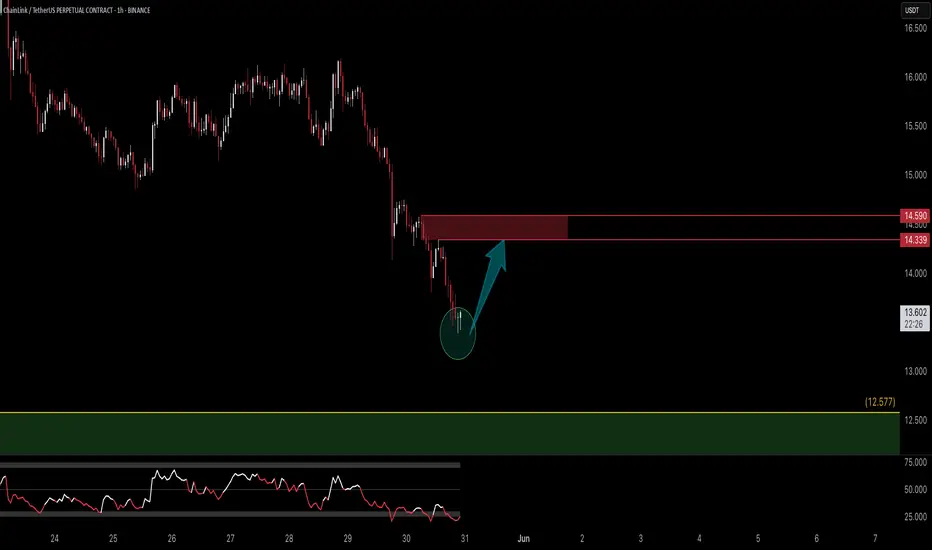
Link | Long | 1hrThis technical analysis is for informational and educational purposes only. It does not constitute financial advice. Remember to always research and consult with a professional before making investment decisions. Good luck! 📈💼🚀
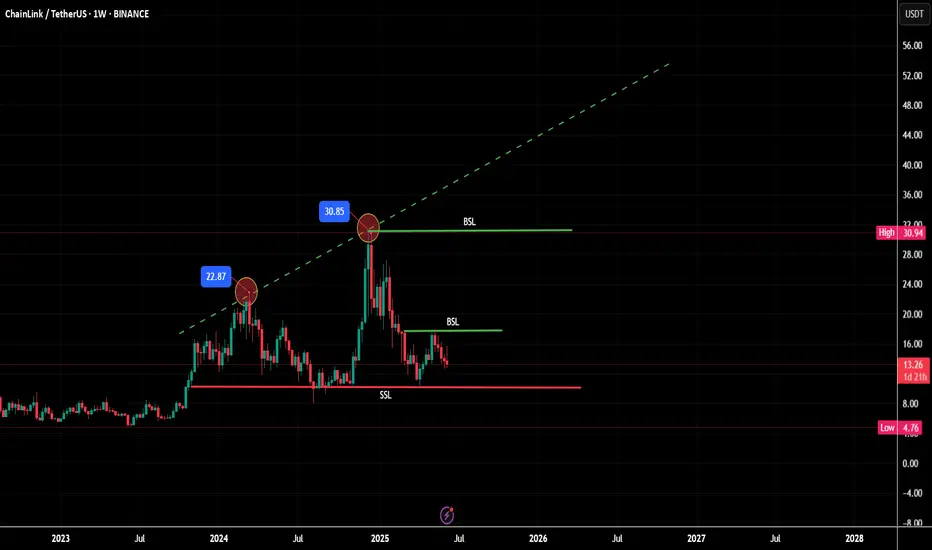
Weekly trading plan for LINKLink has already reached his 3rd target of the week. The chart shows divergence, but now the price above the monthly pivot point and there is a chance to see a continuation of growth. If it returns under monthly PP we may see a local correction or a deeper one to the weekly PP level
Write a comment

See all ideas
Summarizing what the indicators are suggesting.
Oscillators
Neutral
SellBuy
Strong sellStrong buy
Strong sellSellNeutralBuyStrong buy
Oscillators
Neutral
SellBuy
Strong sellStrong buy
Strong sellSellNeutralBuyStrong buy
Summary
Neutral
SellBuy
Strong sellStrong buy
Strong sellSellNeutralBuyStrong buy
Summary
Neutral
SellBuy
Strong sellStrong buy
Strong sellSellNeutralBuyStrong buy
Summary
Neutral
SellBuy
Strong sellStrong buy
Strong sellSellNeutralBuyStrong buy
Moving Averages
Neutral
SellBuy
Strong sellStrong buy
Strong sellSellNeutralBuyStrong buy
Moving Averages
Neutral
SellBuy
Strong sellStrong buy
Strong sellSellNeutralBuyStrong buy
Displays a symbol's price movements over previous years to identify recurring trends.