Chainlink Trend update on 06/May/2025Chainlink market update on 06/May/2025. Currently, it break 13.8$ and keep our eye to see whether it touch 12.8$ zone and reverse or not.
#Chainlink #Defi
LINKUSDT.P trade ideas

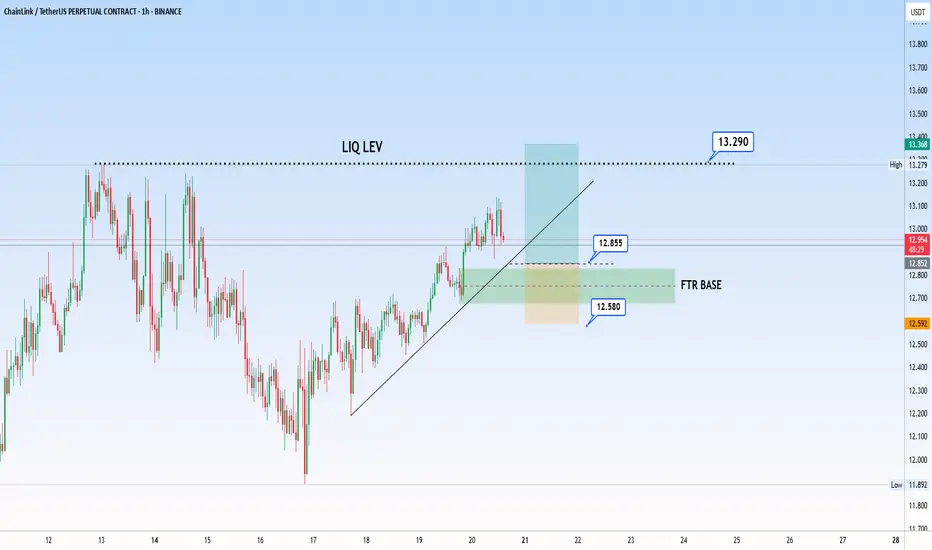
LINKUSDT.P LONG SIGNSL 1hHello dear traders,
LINK is showing a bullish structure on the 1-hour timeframe, and it has the potential to move toward the liquidity zone around 13.290.
The trade setup is shown on the chart.
Please make sure to manage your risk properly.
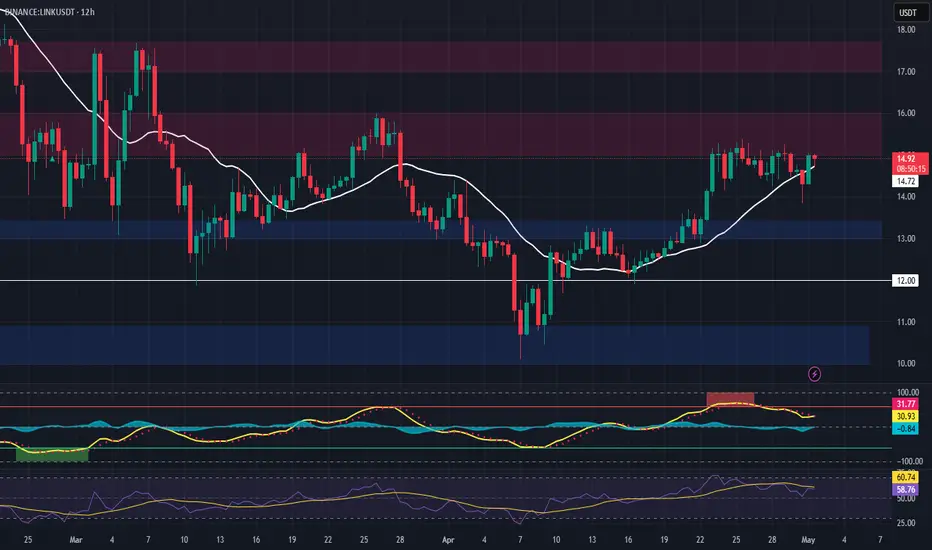
Chainlink Market View - on 03/May/2025Price need to retest on FVG1 or FVG2 , before it break OB and visit the Equal High (17$).
#chainlink

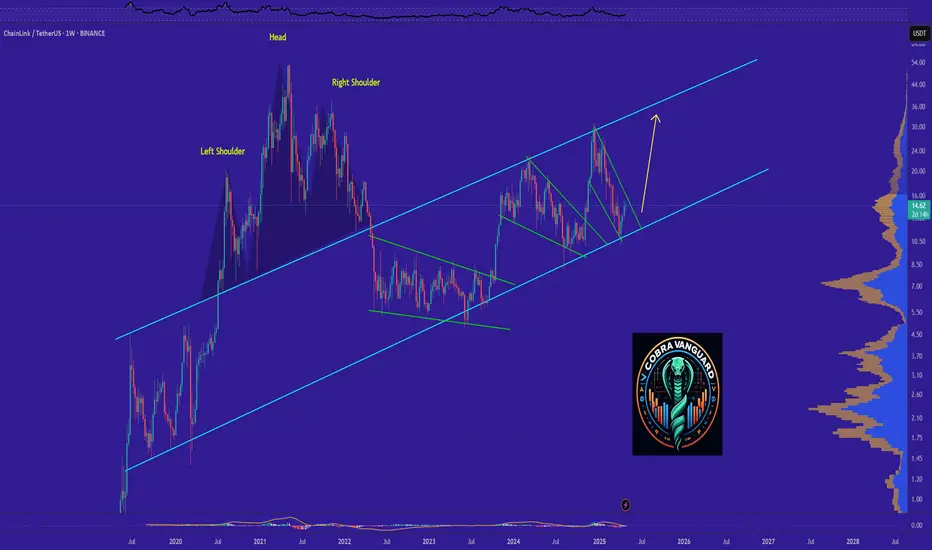
LINK in coming Weeks ...frankly, Bitcoin will reach $30 in the coming weeks.
Give me some energy !!
✨We spend hours finding potential opportunities and writing useful ideas, we would be happy if you support us.
Best regards CobraVanguard.💚
_ _ _ _ __ _ _ _ _ _ _ _ _ _ _ _ _ _ _ _ _ _ _ _ _ _ _ _ _ _ _ _
✅Thank you, and for more ideas, hit ❤️Like❤️ and 🌟Follow🌟!
⚠️Things can change...
The markets are always changing and even with all these signals, the market changes tend to be strong and fast!!
LINK Trade Setup – Pullback to Support OpportunityChainlink (LINK) is currently testing resistance, and a retracement into the next support zone offers a clean long entry with solid upside potential.
🔹 Entry Zone:
$13.00 – $13.40
🎯 Take Profit Targets:
🥇 $15.00 – $16.00
🥈 $17.00 – $18.00
🛑 Stop Loss:
Just below $12.00
LINK/USDT 4H Chart ReviewHello everyone, let's look at the 4H chart LINK to USDT, in this situation we can see how the price was moving in a downward channel, from which we saw an exit to the top and the formation of a new local uptrend line.
Let's start by defining the targets for the near future that the price has to face:
T1 = 15.08 USD
T2 = 16.87 USD
Т3 = 17.93 USD
Т4 = 19.07 USD
Now let's move on to the stop-loss in case the market continues to fall:
SL1 = 13.98 USD
SL2 = 13.12 USD
SL3 = 11.74 USD
SL4 = 10.76 USD
SL5 = 9.48 USD
If we look at the RSI indicator we can see how the price correction gave a strong rebound on the indicator, which could potentially give strength for new growth.

LINK BIST:LINK has confirmed a reversal of trend on the daily chart. My entry lies on the body of the daily order block, should be a clean entry.
Do not use leverage over 10x on this trade and use a proper stop loss as well as take profit. Remember to think by brain not by heart when It comes to trading !
Link Long PositionAdded to leveraed longs under 15.050.
Invaladation 14.850
If holds here we can see a push towards 16 and 17.
targeting 16 and 17.
Note: Not a Financial Advice.

LINK/USDT on the 4H timeframe)Trend:
The market is in a bullish structure with a clear series of higher highs and higher lows.
Support & Resistance:
Support Zone: Around $13.70 – $14.00 (just below current price, previous consolidation area).
Immediate Resistance: Around $15.94 (marked on your chart).
Major Resistance: Around $17.52 (also marked).
---
Trading Plan:
Entry Point (Buy):
Current price zone (~$14.98) is viable if price breaks and holds above $15.00.
Alternatively, a retest entry around $14.50–14.70 (for a safer entry near support).
First Target:
$15.94 (marked as your first target box).
Final Target:
$17.52 (major resistance and final target marked on chart).
---
Stop Loss Suggestion:
Below recent swing low: around $13.90 (under support area).

Link LongAs you can see on link, price is quite rallying upwards, im looking for the sweep of the swing highs at $16 and then wait for confirmation on long entry. If not than I wait for price to drop towards marked area and wait for confirm there.

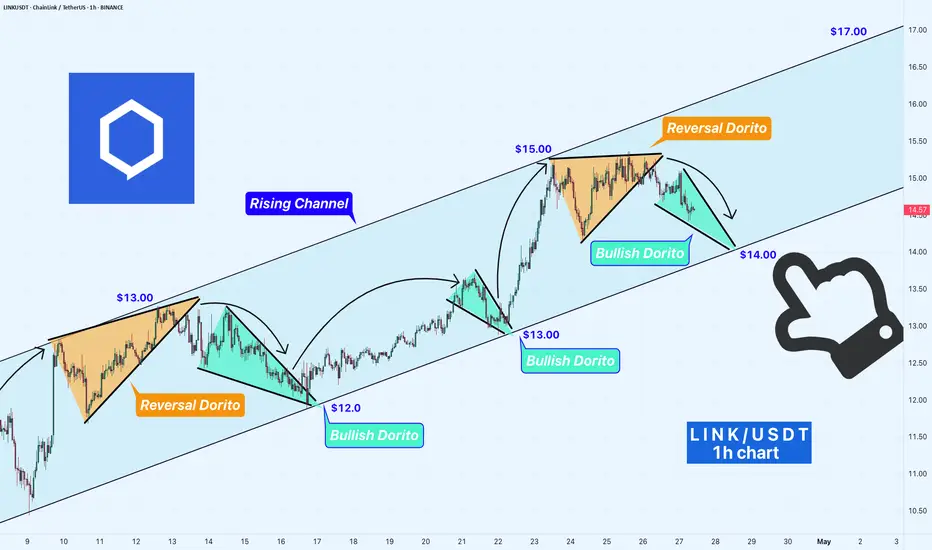
LINK/USDT 1H Chart Update Chainlink is riding a strong Rising Channel!
Price action shows clear patternson LINKUSDT
▸ Bullish Doritos at $12.00 & $13.00, pushing the price higher.
▸ Reverse Doritos at $13.00 & $15.00, leading to pullbacks inside Rising Channel.
▸ Key levels to watch: $14.00 (support) and $17.00 (upper resistance).
✉️ As long as LINK stays in the channel, the bulls are in control! Will we see a breakout to $17.00 soon? Let’s discuss!
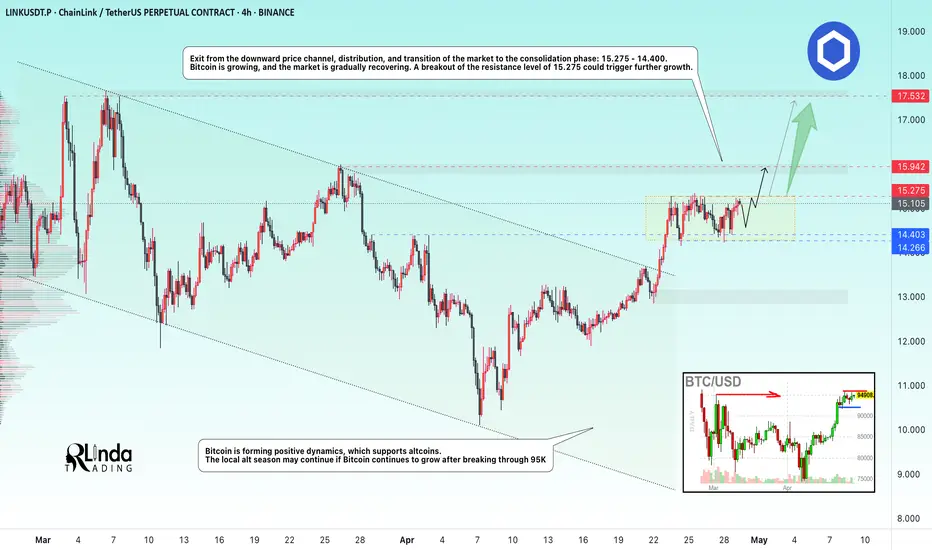
LINKUSDT → Consolidation. One step away from a rally?BINANCE:LINKUSDT entered a consolidation phase after breaking out of a downward channel. This is a fairly positive sign that buyers are building up momentum ahead of a possible breakout of resistance.
Exit from the downward price channel, distribution, and transition of the market to a consolidation phase: 15.275 - 14.400. Bitcoin is forming positive dynamics, which supports altcoins. The local alt season may continue if Bitcoin continues to grow after breaking through 95K. If LINK breaks through the resistance level of 15.275, this move could trigger further growth
Resistance levels: 15.275, 15.942
Support levels: 14.400, 14.266
At the moment, the mood of altcoins depends on Bitcoin, as it is receiving support amid positive fundamental data in the US and the global economy. However, for LINK, the focus is on the current consolidation. If the resistance level is not broken on the first attempt, it may happen during the next retest. Before that, the price may test the consolidation support with a false breakdown, which could create an imbalance in favor of buyers, only increasing the chances of growth and a breakout of resistance, provided, of course, that the overall bullish trend continues.
Best regards, R. Linda!
LINK Eyes $26 Breakout and Fundamentals Align for a Bullish RunChainlink (LINK) is showing a strong bullish reversal on the daily chart after denying further downward momentum around the $10.11 key support zone.
Recently, LINK broke out of a falling channel, indicating a potential shift in trend direction. The MACD indicator also confirms bullish momentum with a positive crossover and growing strength.
Trading Setup
Entry: $15.05
(Current market price after the breakout confirmation.)
Stop Loss: $12.98
(Below the recent consolidation zone to minimize risk.)
Take Profit 1 (TP1): $18.77
(First major resistance — ideal for partial profit booking.)
Take Profit 2 (TP2): $26.23
(Higher resistance zone — extended target if bullish momentum continues.)
Fundamental Reasons to Stay Bullish on LINK
Chainlink’s Real-World Adoption: Chainlink’s oracle services are increasingly being integrated into major DeFi, NFT, and traditional finance platforms, bridging blockchain and real-world data.
Launch of CCIP (Cross-Chain Interoperability Protocol): Chainlink’s CCIP makes cross-chain communication more secure and scalable, and it is gaining adoption among major blockchain projects.
Partnership Momentum: Chainlink has continued to form key partnerships with institutions and projects like Swift, major banks, and large blockchain ecosystems, reinforcing its long-term value.
Staking V2 Launch: With Chainlink staking 2.0 offering higher rewards and greater security, demand for LINK tokens has increased among investors looking for yield.
Market Sentiment Shift: As blockchain infrastructure projects gain renewed interest during the broader Web3 and DeFi resurgence, oracle providers like Chainlink are seen as critical infrastructure, enhancing investor confidence.
Summary
Chainlink looks ready for a new upward move both technically and fundamentally. The breakout, supported by improving fundamentals like new partnerships and growing utility, makes LINK one of the most attractive mid-cap projects to watch right now. Traders should monitor the $18.77 and $26.23 resistance levels closely.
🔵 Trend Bias: Bullish
⚡ Risk/Reward Ratio: ~3:1
🌟 Overall Outlook: Technically and fundamentally positive

#LINK/USDT#LINK
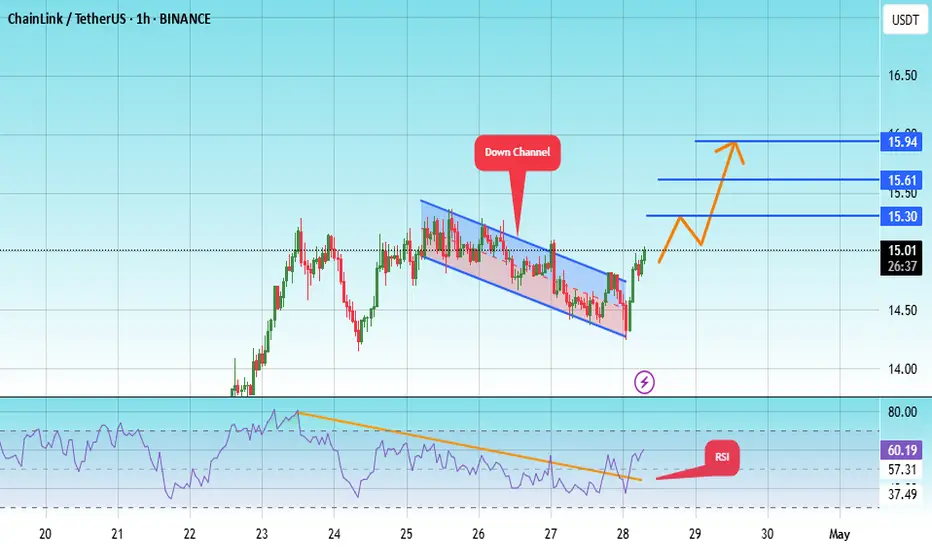
The price is moving within a descending channel on the 1-hour frame, adhering well to it, and is heading towards a strong breakout and retest.
We are seeing a bounce from the lower boundary of the descending channel, which is support at 14.30.
We have a downtrend on the RSI indicator that is about to be broken and retested, supporting the upward trend.
We are looking for stability above the 100 moving average.
Entry price: 15.00
First target: 15.30
Second target: 15.61
Third target: 15.94
Waiting for a market stracture shift to start an uptrend (Link)The LINK currency has hit its uptrend line and with a change in structure, an uptrend can be expected.

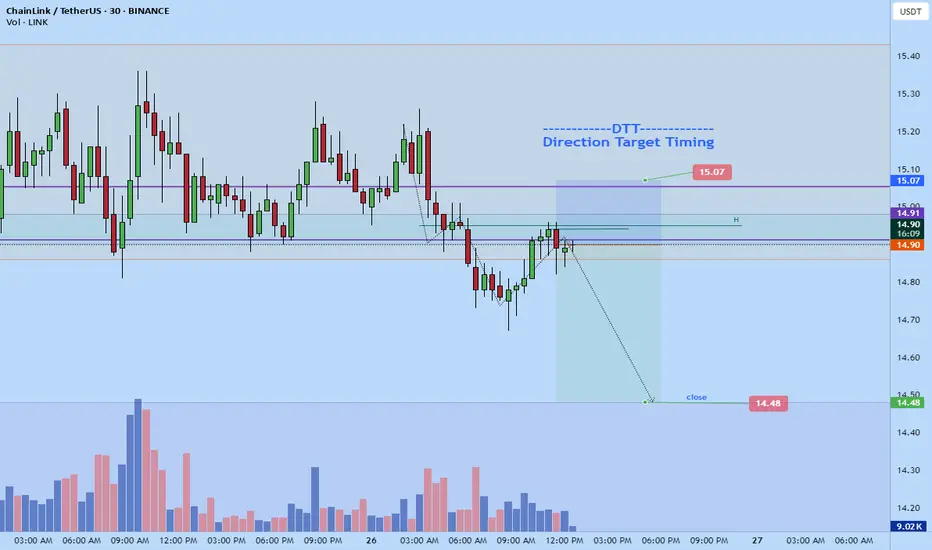
Link short to $14.48Decided to short link just now.
Targeting $14.48
roughly 2.5RR
I think the market is likely to correct down a bit before higher prices. Plus its at a resistance area.
stop: $15.07 or higher
LINKUSDT - Time to consider Alts more seriously?Is it time to reconsider Alt coins with some more sincerity? Notoriously up and down in the past, are top Alt coins set to experience some sustained gains over the coming years? Time will tell.
For now, our team has identified an opportunity within LINKUSDT, where momentum may very well be turning to a 'bullish' rating should price be able to hold current levels - Caution as always is warranted.
We do however see elevated risk of 'bearish' momentum coming into play below the $14.00 mark.
We're inspired to bring you the latest developments across worldwide markets, helping you look in the right place, at the right time.
Thank you for reading! Stay tuned for further updates, and we look forward to being of service along your trading & investing journey...
Disclaimer: Please note all information contained within this post and all other Bullfinder-official Tradingview content is strictly for informational purposes only and is not intended to be investment advice. Please DYOR & Consult your licensed financial advisors before acting on any information contained within this post, or any other Bullfinder-official TV content.
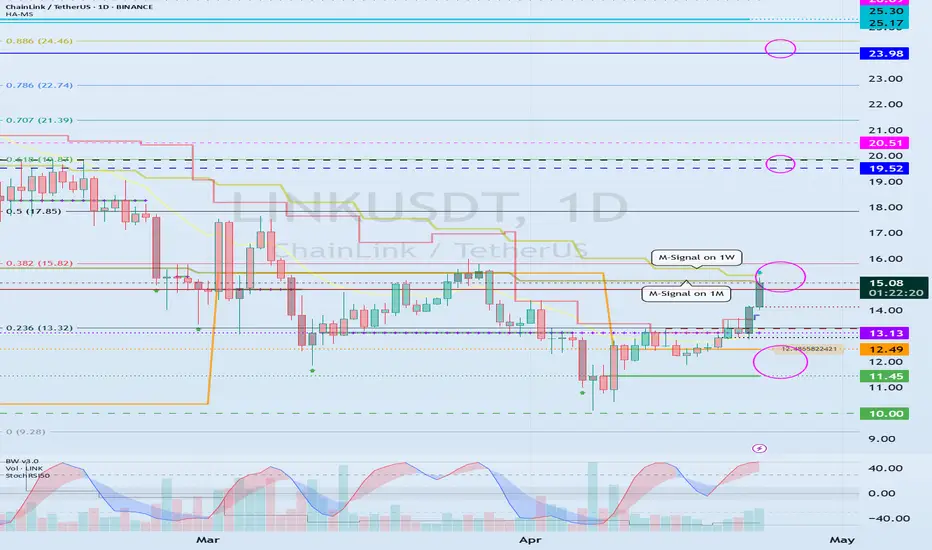
Support and Resistance Zone: 14.81-15.82
Hello, traders.
If you "Follow", you can always get new information quickly.
Please click "Boost" as well.
Have a nice day today.
-------------------------------------
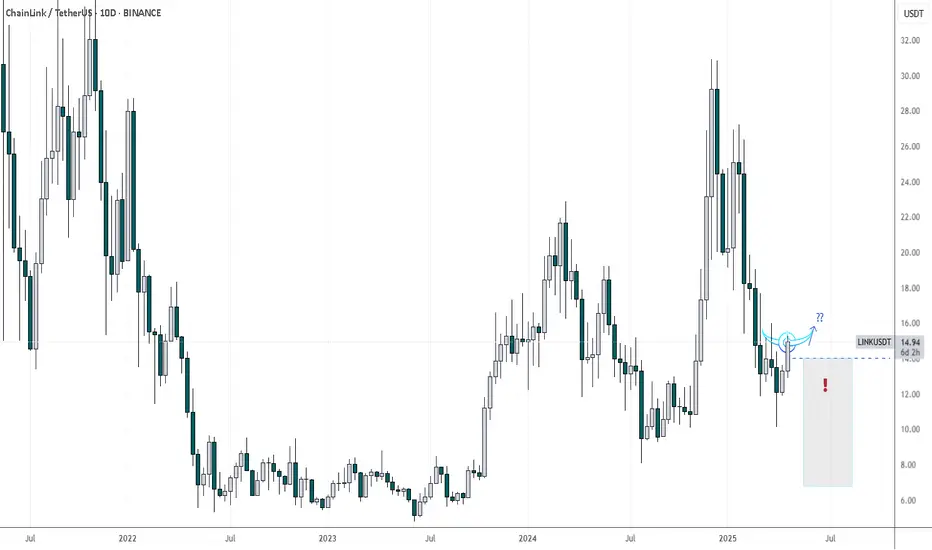
(LINKUSDT 1D chart)
In order to continue the uptrend, the price must be maintained above the M-Signal indicator on the 1M chart.
Accordingly, we need to see if it can rise above the Fibonacci ratio of 0.382 (15.82).
Therefore, the key is whether it can rise after receiving support near 14.81.
-
If not, it should fall, and we need to check whether it supports near 12.49.
-
Trading strategies can be created based on whether there is support near the HA-Low and HA-High indicators.
It is not suitable to start trading because it has already risen from the current HA-Low indicator (12.49).
Accordingly, when it receives support near 12.49 and rises to the Fibonacci ratio 0.382 (15.82), you can check whether there is support and start trading.
This trade requires a short and quick response.
Therefore, it is recommended to try to keep the stop loss point.
If it rises above the Fibonacci ratio 0.382 (15.82) and maintains the price,
1st: 19.52
2nd: 23.98
It is expected to rise to the 1st and 2nd above.
-
Thank you for reading to the end.
I hope you have a successful trade.
--------------------------------------------------
- This is an explanation of the big picture.
To check the entire range of BTC, I used TradingView's INDEX chart.
I rewrote the previous chart to update it by touching the Fibonacci ratio range of 1.902 (101875.70) ~ 2 (106275.10).
(Previous BTCUSD 12M chart)
Looking at the big picture, it seems to have been maintaining an upward trend following a pattern since 2015.
In other words, it is a pattern that maintains a 3-year upward trend and faces a 1-year downward trend.
Accordingly, the upward trend is expected to continue until 2025.
-
(Current BTCUSD 12M chart)
Based on the currently written Fibonacci ratio, it is displayed up to 3.618 (178910.15).
It is expected that it will not fall again below the Fibonacci ratio of 0.618 (44234.54).
(BTCUSDT 12M chart)
Based on the BTCUSDT chart, I think it is around 42283.58.
-
I will explain it again with the BTCUSD chart.
The Fibonacci ratio ranges marked in the green boxes, 1.902 (101875.70) ~ 2 (106275.10) and 3 (151166.97) ~ 3.14 (157451.83), are expected to be important support and resistance ranges.
In other words, it seems likely that they will act as volume profile ranges.
Therefore, in order to break through these ranges upward, I think the point to watch is whether they can receive support and rise near the Fibonacci ratios of 1.618 (89126.41) and 2.618 (134018.28).
Therefore, the maximum rising range in 2025 is expected to be the 3 (151166.97) ~ 3.14 (157451.83) range.
In order to do that, we need to see if it is supported and rises near 2.618 (134018.28).
If it falls after the bull market in 2025, we don't know how far it will fall, but based on the previous decline, we expect it to fall by about -60% to -70%.
Therefore, if it starts to fall near the Fibonacci ratio 3.14 (157451.83), it seems likely that it will fall to around Fibonacci 0.618 (44234.54).
I will explain more details when the bear market starts.
------------------------------------------------------
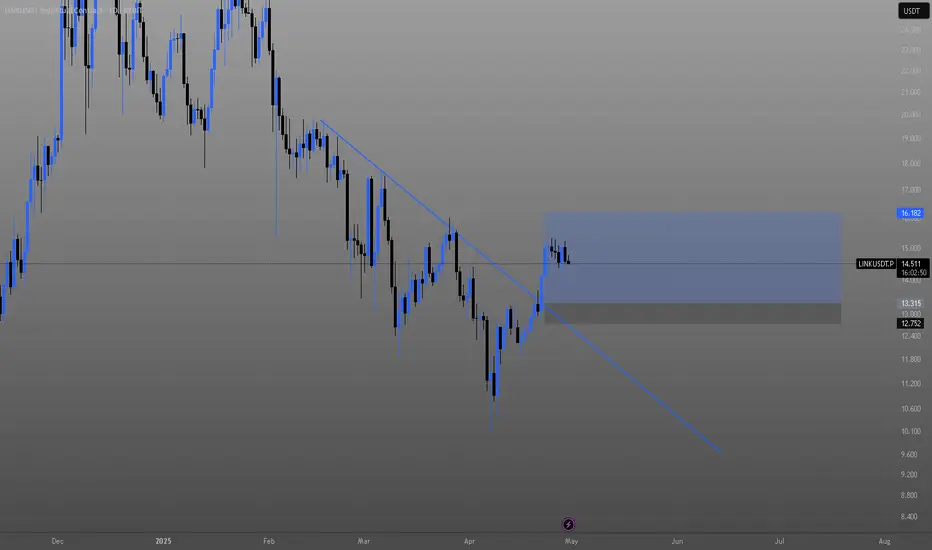
#LINKUSDT Analysis — Testing Channel Breakout📈 #LINKUSDT Analysis — Testing Channel Breakout
🗓 Published: April 23, 2025
🕰 Timeframe: 1D | 📊 Exchange: Binance
🔍 Technical Overview
Chainlink has been trading inside a falling channel since December 2024, with lower highs and lower lows. Price is now attempting a breakout from the upper trendline, signaling a potential trend shift.
📌 Pattern: Falling Channel
📌 Attempting Breakout at $14.79
📌 Support base held well at ~$12 zone
📈 Break + Retest = Key Confirmation Setup
🟩 Potential Entry Zone
📍 $12.55 – A strong support and re-entry zone if price rejects the first breakout attempt and retests.
🔻 Panic Level (Invalidation Zone)
📉 $9.5 – Breakdown below this level would invalidate the bullish setup and may trigger a sharp sell-off.
🎯 Upside Targets (If Breakout Confirmed):
TP1: $15.67 – Local structure resistance
TP2: $18.85 – Range mid-point
TP3: $22.37 – Channel high
TP4: $27.07 – Full recovery zone
TP5: $30.76 – Last breakout top
Ultimate Target: $35.19 (Cycle top)
⚠️ Targets should be scaled into — not all at once
🧠 Strategy Insight
This is a classic breakout-retest setup from a falling channel.
🟢 Ideal strategy: enter small now, add on retest of breakout line (~$13–14 zone).
Use tight stops under $12.14, or wider structure-based stop under $9.42 for position trades.
📊 High reward if trend shift confirms. Patience is key.
🗣 What’s Next?
Watch for volume on breakout, and monitor if BTC remains strong — altcoins like LINK can quickly outperform if the setup holds.
📢 A key decision point. Don’t chase — plan your risk and let price prove the breakout.
Please keep in mind that this is not financial advice and the purpose of these charts is to provide an idea of coin movement, not buy or sell signals. The cryptocurrency market is highly volatile and not suitable for everyone, so be aware of the potential risks before making any investment decisions. The information presented here is a personal effort and is subject to success or failure, and we welcome constructive criticism.
Good luck to all.
🙏we ask Allah reconcile and repay🙏

LINK Trade Setup – Pullback to SupportLINK has made a solid move from ~$10 to $15 over the past couple of weeks. With that rally showing signs of slowing, a pullback into support presents a potential opportunity to catch the next leg up.
📍 Entry Zone:
$13.00 – $14.00
🎯 Take Profit Targets:
🥇 $15.00 – $16.00
🥈 $17.00 – $18.00
🥉 $19.50 – $20.50
🛑 Stop Loss:
Just below $12.00
LINK/USDT Potential UpsidesHey Traders, in today's trading session we are monitoring LINK for a buying opportunity around 14.6 zone, LINK/USDT is trading in an uptrend and currently is in a correction phase in which it is approaching the trend at 14.6 support and resistance area.
Trade safe, Joe.
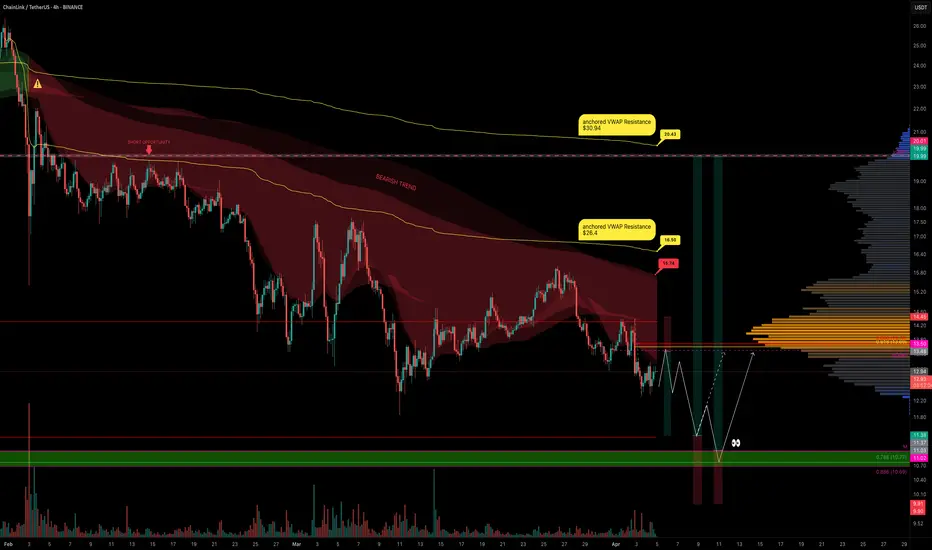
Panic Selling LINK? Here’s Your Master PlanBuckle up! LINK has been riding a relentless bearish trend for 113 days, ever since it kissed its peak of $30.94 back in December 2024. With economic uncertainty casting a shadow over the markets and fear gripping investors, the big questions loom: Is this the dip to buy while others panic-sell? Or is it wiser to sit on the sidelines? Let’s slice through the noise, dissect LINK’s chart like a seasoned pro, and uncover the setups that could turn this chaos into opportunity. Let’s dive in!
The Big Picture: LINK’s Bearish Blueprint
LINK is currently trading at $13, a far cry from its yearly open of $20. April has kicked off, and LINK has already surrendered the monthly open at $13.5, a critical level now acting as a brick wall overhead. Zooming out, the trend is unmistakably bearish: lower highs and lower lows dominate the chart. Adding fuel to the fire, LINK is languishing below the Point of Control (POC) at $14.32, derived from a 1.5-year trading range. This is a market screaming caution for bulls and whispering opportunity for bears, at least for now.
But charts don’t lie, and they’re packed with clues. Let’s map out the key levels, pinpoint trade setups, and arm ourselves with a plan that’d make even the most seasoned traders nod in approval.
Resistance Zones: Where Bears Sharpen Their Claws
1.) Resistance - The Golden Pocket ($13.6 - $13.7)
Using the Fibonacci retracement tool on the latest downward wave, the golden pocket (0.618 - 0.65 Fib) aligns beautifully with the monthly open at $13.5. Oh wait there’s more, this zone overlaps with a Fair Value Gap (FVG), making it a magnet for price action.
Trade Setup (Short):
Entry: ~$13.5 (if price tests and rejects this zone).
Stop Loss (SL): Above the recent swing high at $14.4.
Take Profit (TP): First target at $11.85 (swing low), with a stretch goal at $11.
Risk-to-Reward (R:R): A solid 2:1.
The Play: If LINK crawls up to this resistance and gets smacked down, bears can pounce. Watch for rejection candles (e.g., shooting star, bearish engulfing) to confirm the move.
2. Key Resistance - Cloud Edge & VWAP ($15.74 - $16.5)
The Cloud edge of my indicator sits at $15.74, while the anchored VWAP (from the $26.4 high) hovers at $16.5. A break above $16.5 would flip the script, snapping the bearish structure and signaling a potential trend reversal.
Bullish Scenario: If bulls reclaim $16.5 as support, it’s a green light for a long trade. Until then, this is a fortress for bears to defend.
The Play: No bullish setups here yet.
Support Zones: Where Bulls Build Their Base
1.) Support - Swing Low ($11.85)
This is the first line in the sand for bulls. A potential Swing Failure Pattern (SFP), where price dips below $11.85, sweeps liquidity, and reverses—could spark a long trade.
The Play: Watch for a bullish reversal candle or volume spike here.
2.) Major Support Cluster - The Golden Zone ($10 - $11.85)
This is where the chart sings a symphony of confluence:
Swing Low: $11.85.
POC: $11.33 (1.5-year trading range).
Monthly Level: $11.02.
Fib Retracement: 0.886 at $10.69 and 0.786 (log scale) at $10.77.
Psychological Level: $10.
Trade Setup (Long):
Entry: Dollar-Cost Average (DCA) between $11.85 and $10.
Stop Loss (SL): Below $10
Take Profit (TP): First target: $13.5 (monthly open), stretch goal: $20 (yearly open).
Risk-to-Reward (R:R): A monstrous 6:1 or better, depending on your average entry. This is the kind of trade we are looking for!
The Play: Patience is key. Wait for confirmation—think bullish engulfing candles, a surge in volume, or positive order-flow momentum. This isn’t a “hope and pray” trade; it’s a calculated ambush on the bears.
Market Structure: Bears Rule, But Bulls Lurk
Right now, LINK’s chart is a bear’s playground—lower highs, lower lows, and no bullish momentum to speak of. The $16.5 VWAP is the line in the sand for a trend shift, but until then, short trades take priority. That said, the $10 - $11.85 support zone is a coiled spring for bulls. If fear drives LINK into this range, it’s time to load the boat with longs—provided confirmation aligns.
Your Trading Edge
LINK’s 113-day bearish descent is a wild ride, but it’s not random chaos—it’s a roadmap. Bears can feast on rejections at $13.5 - $13.7 with a tidy 2:1 R:R short. Bulls, meanwhile, should stalk the $10 - $11.85 zone for a high-probability long with a 6:1+ R:R payoff. Whether you’re scalping the dips or swinging for the fences, these levels give you the edge to trade with confidence.
So, what’s it gonna be? Short the resistance and ride the wave down? Or stack bids at support and catch the reversal of a lifetime? The chart’s laid bare—now it’s your move. Drop your thoughts below, and let’s conquer this market together!
If you found this helpful, leave a like and comment below! Got requests for the next technical analysis? Let me know, I’m here to break down the charts you want to see.
Happy trading =)
LINK’s Swing Setup Could Push Past $15LINK bounced right off the $10 mark, charging upward toward the monthly open before slamming into resistance around $13.25. But now what?
Let’s break it down — because the next high-probability setup is taking shape, and it’s one you don’t want to miss.
The Current Situation:
LINK is:
Below the Point of Control (POC) of this trading range (~$11.35).
Below the monthly open at $13.5.
Still in a bearish trend on the 4H, showing lower highs.
Facing decent rejection from the monthly level.
We’re currently trading below the weekly open at $12.62, now sitting right on the Value Area Low (VAL) at $12.36. That puts us in a precarious spot and sets the stage for the next move.
Bearish, bearish, bearish. When bullish sir? Staying patient and waiting for a real shift in market structure is key.
The Bearish Play: Liquidity Grab Incoming?
There’s a liquidity pocket waiting below at $11.68, the most recent swing low. If LINK loses VAL and bearish pressure kicks in, this becomes the next logical target.
But here's where things get interesting...
The Bullish Setup: Confluence-Backed Long Opportunity
This isn’t just any random support zone — there’s a perfect confluence stack forming:
Swing low: $11.68
Daily support level: $11.45
Weekly support level: $11.28
POC of trading range: ~$11.35
0.618 Fibonacci retracement lands in this zone as well
That’s four layers of support in one tight cluster. This is where we want to scale into longs.
The Play: Scaling In
Entry: Ladder long positions from $11.68 down to the 0.786 fib (near $11.2)
Stop Loss: Below $10.35 for invalidation
Target: 0.786 fib retracement of the previous downward wave at ~$14.5
R:R: Approx. 3:1, with a potential +30% gain
The trend remains bearish but the chart is setting up a prime reversal zone. Patience is key here.
🔔 Set alerts. Watch for volume spikes. Look for SFPs or bullish engulfing candles etc.
The next move on LINK could offer one of the best swing setups especially since this trade could extend past the $15 mark, putting you ahead of the curve.
💬 Found this helpful? Drop a like and comment below. Want TA on another coin? Let me know and I’ll break it down for you.
Happy trading everyone! 💪
