Analyzing the trading chart for the LINK/USD perpetual contractAnalyzing the trading chart for the LINK/USD perpetual contract on the Bitget exchange, we can derive some conclusions about the price movement in the short term and suggest trading strategies.
Chart Analysis
Current Price: The current price of LINK is 17.308 USDT, with a volume of 1.28 K contracts traded in the last hour. This indicates moderate trading activity.
Moving Averages:
50-period MA (red line): This moving average is positioned above the current price, suggesting potential resistance and a possible short-term correction.
200-period MA (green line): This moving average is also above the current price, further reinforcing the idea of resistance.
Indicators RSI and MACD:
RSI: With a value of 47.11, the RSI indicates a neutral market condition, suggesting no strong buying or selling signals at this time.
MACD: The MACD lines show some stability, with momentum signals not particularly strong in either direction.
Support and Resistance:
Horizontal lines on the chart indicate various support and resistance levels. The presence of annotations like "BOS" (Break of Structure) and "ChoCH" (Change of Character) suggests that there could be imminent trading opportunities based on price movements.
Trading References
Long Strategy: Consider taking a long position if the price breaks the resistance level around 17.40 USDT. An entry point in this case would be around 17.35 USDT.
Profit Target: Set a profit target at 17.80 USDT, where there are signs of historical resistance.
Stop Loss: Set a stop loss at about 17.00 USDT to limit losses in case of a trend reversal.
Short Strategy: If the price drops below 17.00 USDT, consider a short position.
Entry Point: Wait for confirmation below this level, for example, at 16.90 USDT.
Profit Target: A profit target could be set at 16.50 USDT.
Stop Loss: Set a stop loss at 17.20 USDT to manage risk.
Conclusion
In summary, the chart indicates a neutral market condition with potential movements both upward and downward. Technical indicators and moving averages show significant resistance, while the RSI and MACD do not signal overbought or oversold conditions. Therefore, it is advisable to closely monitor key price levels and adopt both long and short trading strategies based on future movements. Ensure to stay updated on market dynamics and adjust strategies accordingly.
LINKUSDT.PS trade ideas

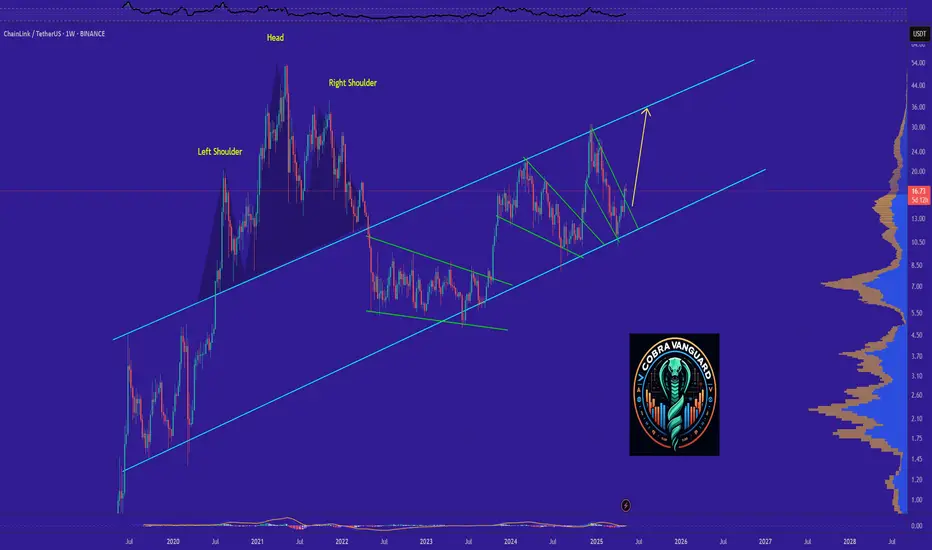
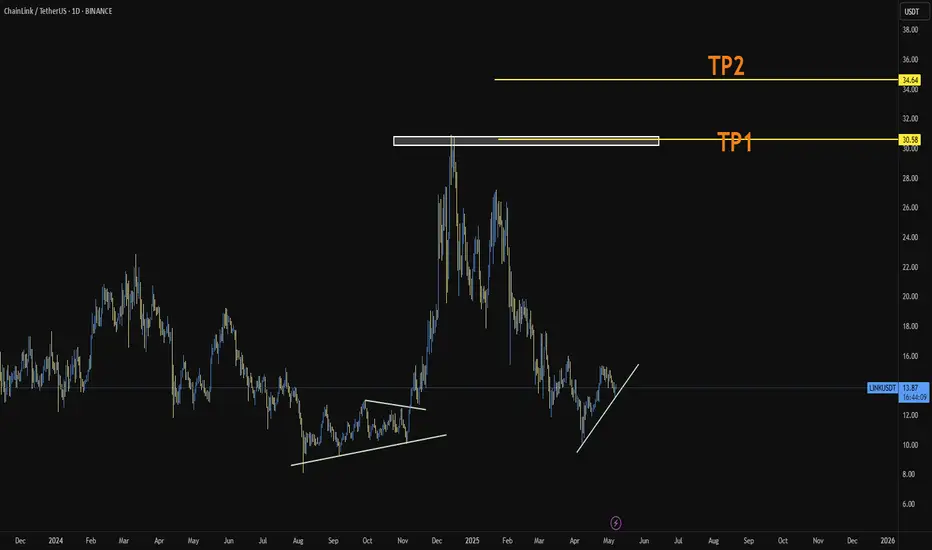
LINK in coming Weeks ...The pattern has broken, and now I expect the price to rise to $36 . AB=CD.
previous analysis
Give me some energy !!
✨We spend hours finding potential opportunities and writing useful ideas, we would be happy if you support us.
Best regards CobraVanguard.💚
_ _ _ _ __ _ _ _ _ _ _ _ _ _ _ _ _ _ _ _ _ _ _ _ _ _ _ _ _ _ _ _
✅Thank you, and for more ideas, hit ❤️Like❤️ and 🌟Follow🌟!
⚠️Things can change...
The markets are always changing and even with all these signals, the market changes tend to be strong and fast!!
LINK/USDT Analysis: Trend bullish, breakout at 16.600 USDT. Support at 16.366. Entry at 16.600, stop-loss 16.350, take-profit 16.800/17.000. Monitor for volatility! #CryptoTrading #LINK

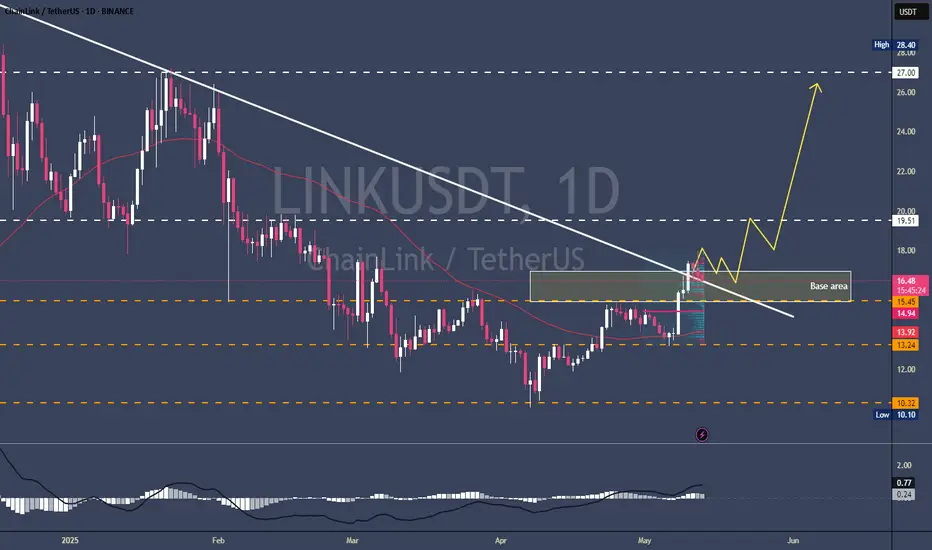
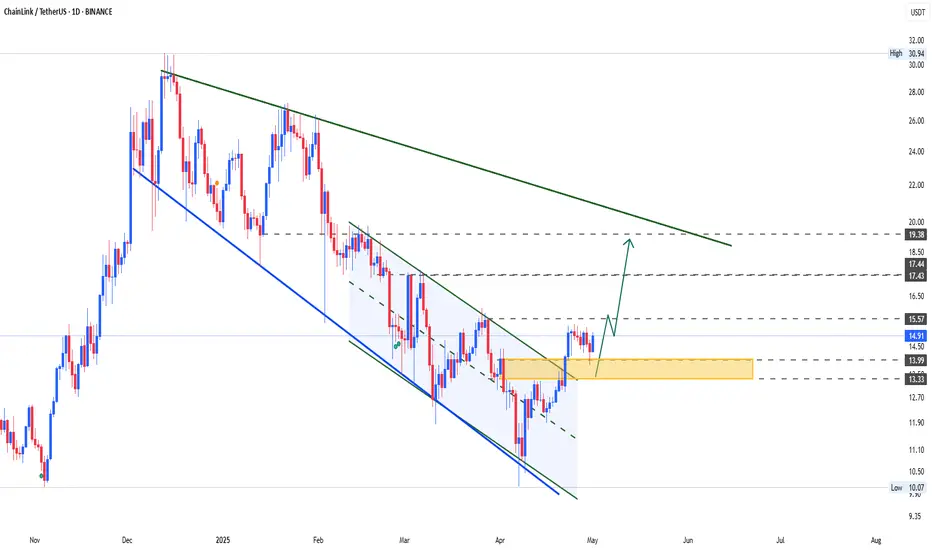
Daily down trend line just brokeOn the chart it is clear the daily candle is moving around my downward trend line meaning closing above it could lead us to new higher levels.
so here is my strategy for trade:
the price is moving into my base area trying to close above the daily trend line. if those conditions hold, then we can find proper entry for long position in lower time frames.
the first important level would be around 19.5$, breaking this level will lead us to upper levels. so if you eager to long this coin you can follow me and my next updates.
Enjoy the market
LINKUSDT | MONTHLY ANALYSIS
HTF BREAKDOWN :
Breaking down things from the start we have a sweap of the Prl while almost 1.5 years of Accumulation
before we saw a good Explansion to the Upside,
Price Currently Rejecting off the Monthly imbalance region that
was caused by the move higher so we can see a ltf (lower time frame) bearish trend getting acceptance off the Monthly Vwap + Bof ( Bullish Orderflow Region) where our dca bids are placed
DCA REGION
- 13.220
TARGETS
Strong Fundemetals,
Aiming for Long-term hold targets 52 - 73.20 - 81

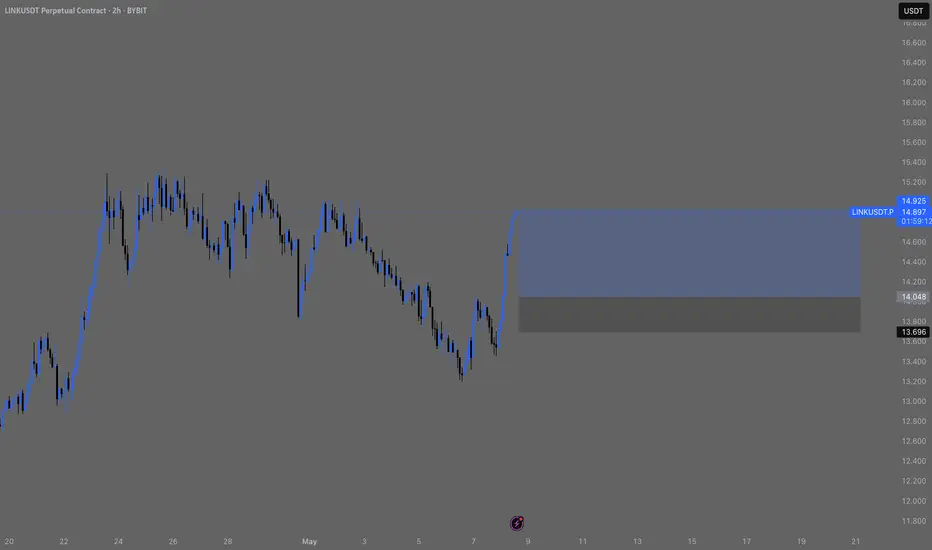
LINKUSDT | Long Bias | Post-Spring Setup | (May 12, 2025)LINKUSDT | Long Bias | Post-Spring Setup + Money Flow Shift | (May 12, 2025)
1️⃣ Short Insight Summary:
Chainlink is completing a corrective phase after a strong three-wave move up. With money outflow showing on the lower timeframes, a pullback toward the $14 zone could offer a solid long re-entry.
2️⃣ Trade Parameters:
Bias: Long
Entry Zone: $14.00
Stop Loss: $12.74
TP1: $15.50
TP2: $69.84
Final TP: $126.26 (longer-term, if trend extends)
Partial Exits: Advised at each TP for safer profit booking, especially at early resistance points
3️⃣ Key Notes:
✅ Money is flowing out on the 1H and 4H charts, suggesting we’re nearing the end of a short-term correction.
✅ Structure looks like a spring setup—ideal for entering on weakness before the next bullish leg.
✅ Already took profits around $16.60 from earlier long exposure—this setup reflects a refined re-entry with lower risk.
✅ $14 zone is a key technical level; will act as a decision point for bulls if defended on volume and reaction.
❌ No reason to chase high entries right now—better to be patient and protect capital.
4️⃣ Optional Follow-up Note:
Will update the idea if LINK reacts sharply at $14 or if larger market shifts invalidate the bias.
Please LIKE 👍, FOLLOW ✅, SHARE 🙌 and COMMENT ✍ if you enjoy this idea! Also share your ideas and charts in the comments section below! This is best way to keep it relevant, support us, keep the content here free and allow the idea to reach as many people as possible.
Disclaimer: This is not financial advice. Always conduct your own research. This content may include enhancements made using AI.

Will LINKUSDT Explode Soon — or Collapse Into a Trap?Yello Paradisers, are you prepared for the next big LINK move? The breakout you’ve been waiting for just happened — but before you jump in, let’s break down what’s really going on behind the chart.
💎LINKUSDT has officially broken out of its descending channel — a significant structural shift that immediately increases the probability of a bullish continuation. On top of that, we’ve seen a bullish CHoCH (Change of Character), a powerful sign that demand is stepping in. These are early but critical signs that bulls may be regaining control.
💎However, experienced traders know not to act on the first sign of strength alone. We now need to see how price behaves on the pullback. If LINK pulls back and takes out the inducement (removing weak hands), we’ll be looking for a bullish internal CHoCH (I-CHoCH) on the 1H timeframe. If that forms, the probability of a solid bounce from the support zone becomes extremely high — giving us the confirmation we need to position for upside.
💎On the other hand, if price breaks down and closes a candle below the support zone, this entire bullish setup becomes invalid. In that case, it would be wise to remain patient and wait for better, more reliable price action to develop before making any move. This is exactly where most traders lose by forcing trades instead of waiting for clear signals.
🎖A big liquidation event, which will first take both longs and shorts and fully get rid of all inexperienced traders before the real move happens, is very close to happening again. so make sure you are playing it safe Paradisers. It will be a huge money-maker for some and a total disaster again for the majority.
MyCryptoParadise
iFeel the success🌴

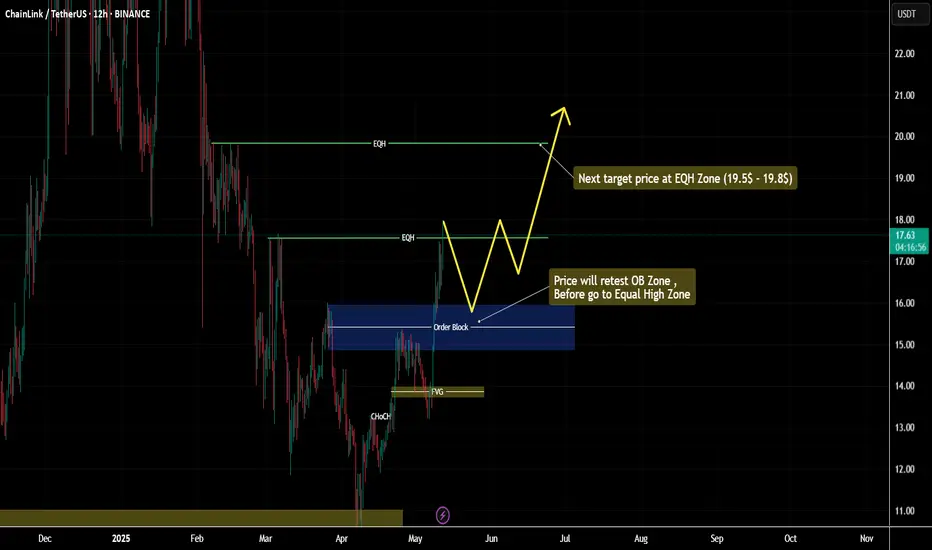
Chainlink Price - 12/May/2025Chanilink price has broken the Equal High Zone at 17.5$. It will retest to Order block zone (15.4$ - 15.8$) and need to break EQH ( 17.5$) again, before it visit next Equal High at 19$ zone.
Keep our eye on it. Long term focus is 100$ per coin #Chanilink #Topdifi
Chainlink Analysis for Intraday TradingWait for the entries to be filled from both side, I will prefer short entry here, Reason btc looks too weak now, USDT.D has reached the strong bullish zone and can hit 4.80-4.89% zone for correction. While I will short BTC from 105-106K SL if 4 candle closes above 107.8K, at the same time I will open short positions on ETH, and Link SL when BTC hits the SL.

LINK/USDT 1W chart reviewHello everyone, let's look at the 1W link to USDT, in this situation we can see how the price is fighting for the mountain from the downward trend line over which we are currently.
Going further, let's check the places of potential target for the price:
T1 = $ 18.38
T2 = $ 21
Т3 = $ 23.53
Let's go to Stop-Loss now in case of further declines on the market:
SL1 = 15.31 $
SL2 = $ 13.17
SL3 = 10.53 $
Looking at the RSI indicator, we see a clear increase on the indicator and a return to the upper part of the range, but there is still room for continuing the ongoing strong growth.

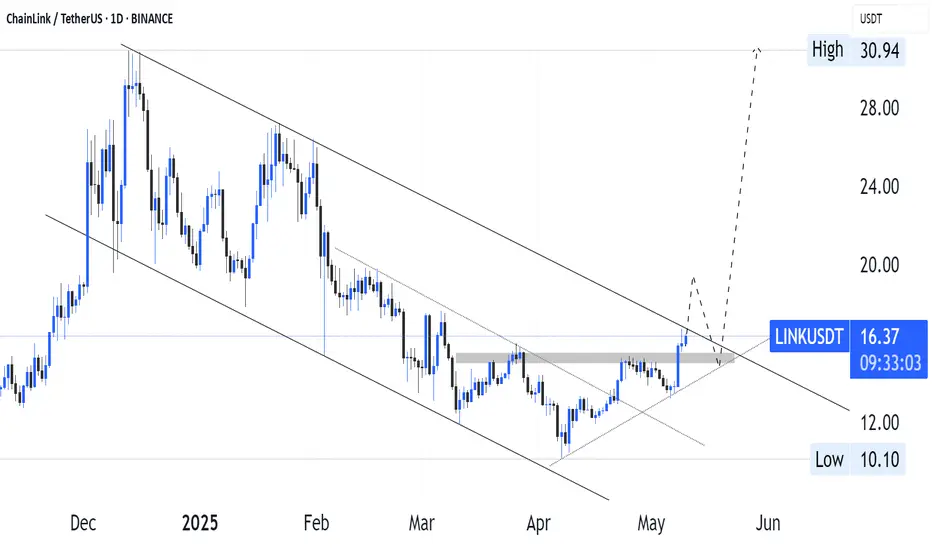
POSSIPBLE BULL SET UP ON LINKUSDTLINK broke out of consolidation phase . IT also broke out of downward counter channel and 15.27 resistance level signaling a potential upward movement. If price eventually break out of the main channel ,the bullish trend will hold.
LINK to make a new ATH?LINK is showing great strength and respecting EW theory.
The ABC correction finished in JUNE-2023 and since then, LINK has likely finished its wave (1) and wave (2). Now in motion to complete its wave (3).
Big Question is whether LINK will break its previous ATH of $52.88?
If it goes key targets are $70-80 (wave 3), $90-120 (wave 5).
Could it be that LINK becomes one of the strategic reserve assets for the US? Time will tell.

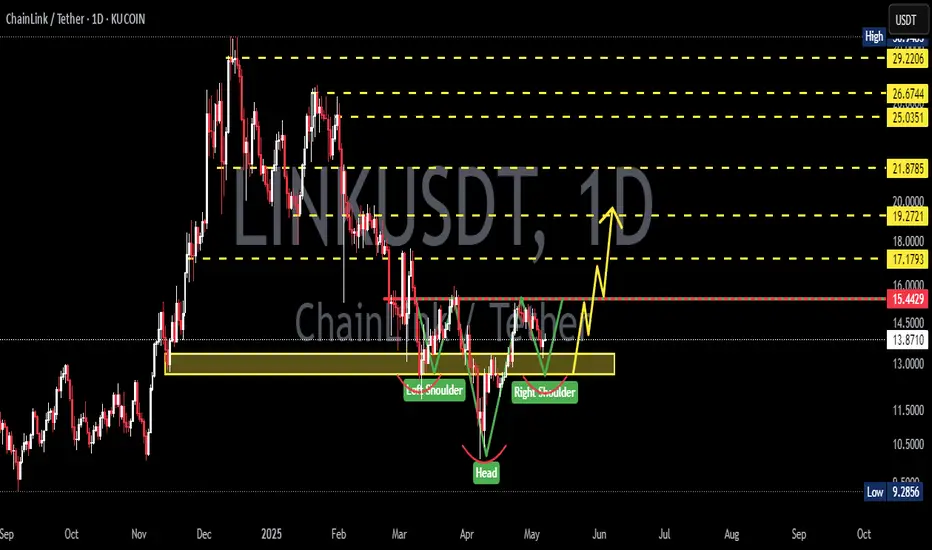
LINK — Time to Load Up!
CRYPTOCAP:LINK has just confirmed a bullish inverse Head & Shoulders breakout and smashed through the crucial $15.5 resistance — the strongest price level since late 2024!💥
This breakout unlocks massive upside potential:
🎯 Target 1: $22.22
🎯 Target 2: $26.09
🎯 Target 3: $30.62
Technicals are aligning for a major trend reversal, and the breakout signals the start of a possible multi-week rally. 🔓📈

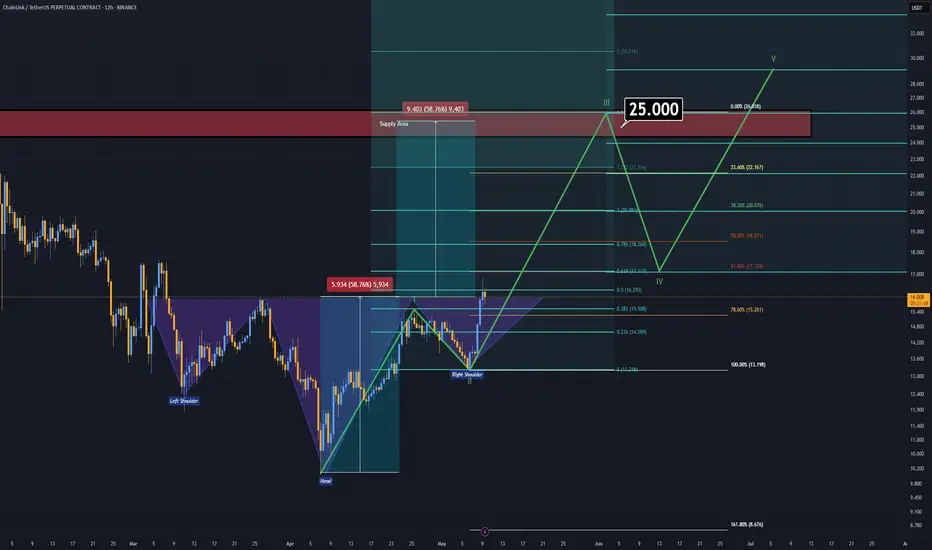
Chainlink (LINK) Update (12H) – Bullish Structure StrengthensIn our previous analysis, I outlined multiple technical reasons suggesting that LINK was preparing for a major bullish phase. Since then, LINK has surged over 25% from the level I initially highlighted.
Upon reassessing the chart from a broader perspective, I’ve identified a reversed Head and Shoulders pattern forming on the higher timeframes — a classic bullish reversal signal. This has also prompted a revision of the Elliott Wave count on the macro structure.
Updated Technical Insights:
Wave Count: LINK is currently in Wave 3 of a larger bullish impulse, based on Elliott Wave Theory.
Breakout Confirmation: The neckline of the reversed Head and Shoulders pattern is being breached, which aligns with the 1.618 Fibonacci extension — a typical target zone for Wave 3.
If you entered based on the prior setup, you’re likely sitting on a 20–25% gain even on a 1x position. There’s no need to add or chase the price at this point — the optimal move is to secure profits by moving stop-loss to break-even and continue managing your position with discipline.
Updated Target:
The mid-term projection for LINK now stands around the $25 mark.
— Thanks for reading.
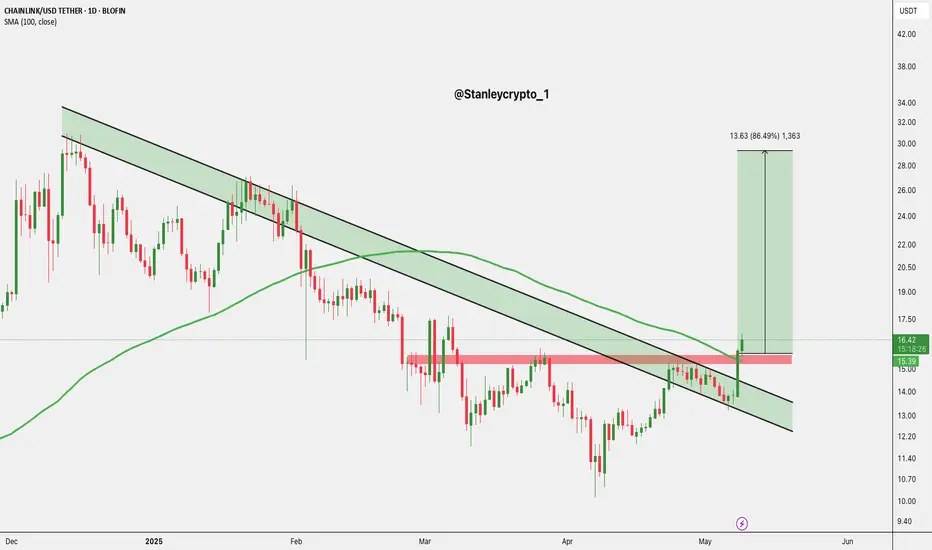
$LINK just broke out CRYPTOCAP:LINK just broke out of its downtrend and 100-day SMA!
Bullish reversal confirmed eyes on $30 +86%.
Entry: CMP
- TP1: $18.90
- TP2: $23.50
- TP3: $29.90
Stop Loss: $14.80
Use 3–5x leverage max. DYOR, NFA.
LINK Broading wedged Currently it comes out of this support zone. Maybe this support block you can consider to start buying back from here with a short -term target of at least 10%+.
LINKIm waiting again for confirmation on this trade, my entry lies on a 30m order, why? because the same zone use to be a resistance hence why the orderblock is valid.
Link/USDT"This is Link . Based on the daily timeframe, we’re in an uptrend aiming for the targets you can see. If you enjoy this kind of analysis, make sure to like and subscribe to our channel!"
LINKUSDT 1D Analysis LINK ~ 1D Analysis
#LINK Successfully retested this support block. This would be a very good buy for now, with a short term target of at least 10%+.
Chainlink (LINK): Possible Reclaim of Bearish CMESellers are showing strong dominance where recently we had broken and secured the 200EMA line and also reached one of our targets on other analysis from last week.
We are now looking and aiming at that bearish CME gap where we might be seeing some sort of sideways movement to form and eventually an MSB with price movement towards the bullish CME—so for now we want to see more downward movement and once we are down, then we get back to Chainlink!
Swallow Academy

Chainlink Trend update on 06/May/2025Chainlink market update on 06/May/2025. Currently, it break 13.8$ and keep our eye to see whether it touch 12.8$ zone and reverse or not.
#Chainlink #Defi

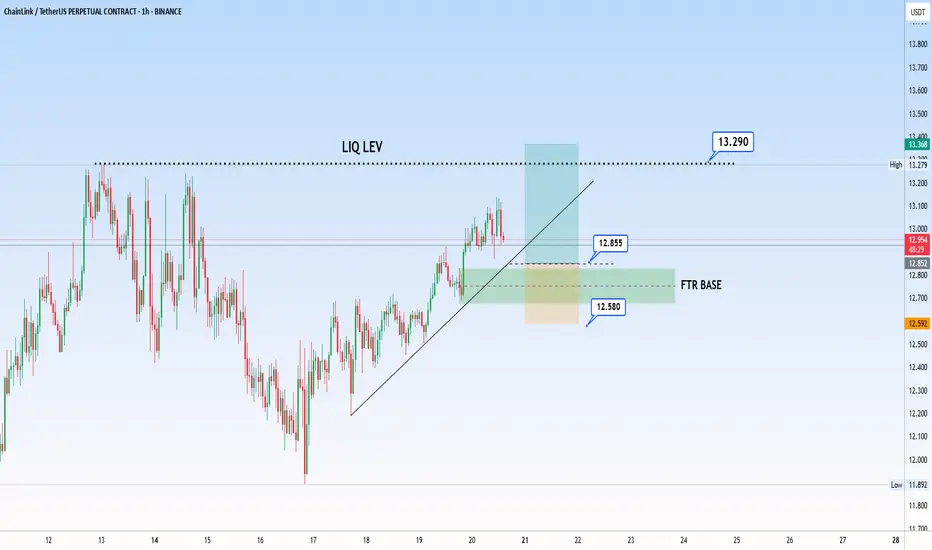
LINKUSDT.P LONG SIGNSL 1hHello dear traders,
LINK is showing a bullish structure on the 1-hour timeframe, and it has the potential to move toward the liquidity zone around 13.290.
The trade setup is shown on the chart.
Please make sure to manage your risk properly.
Chainlink Market View - on 03/May/2025Price need to retest on FVG1 or FVG2 , before it break OB and visit the Equal High (17$).
#chainlink
