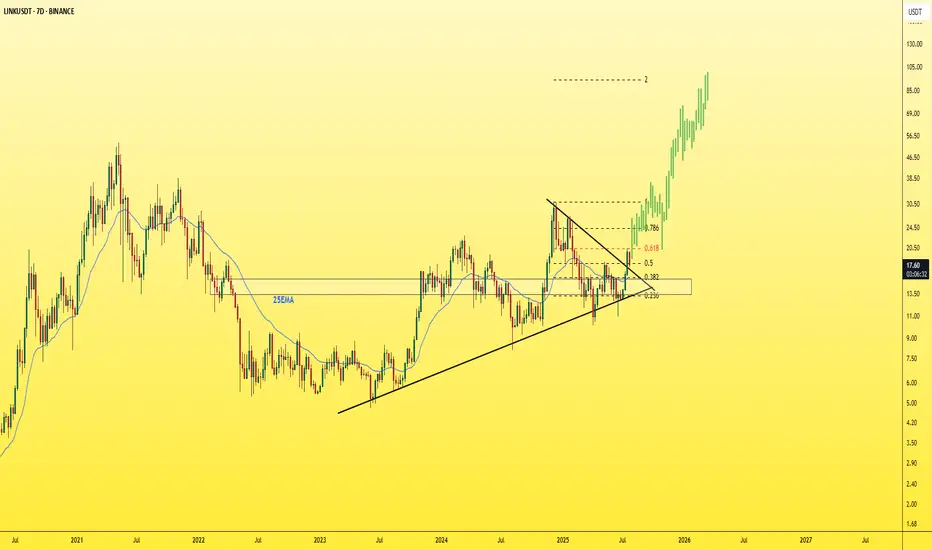
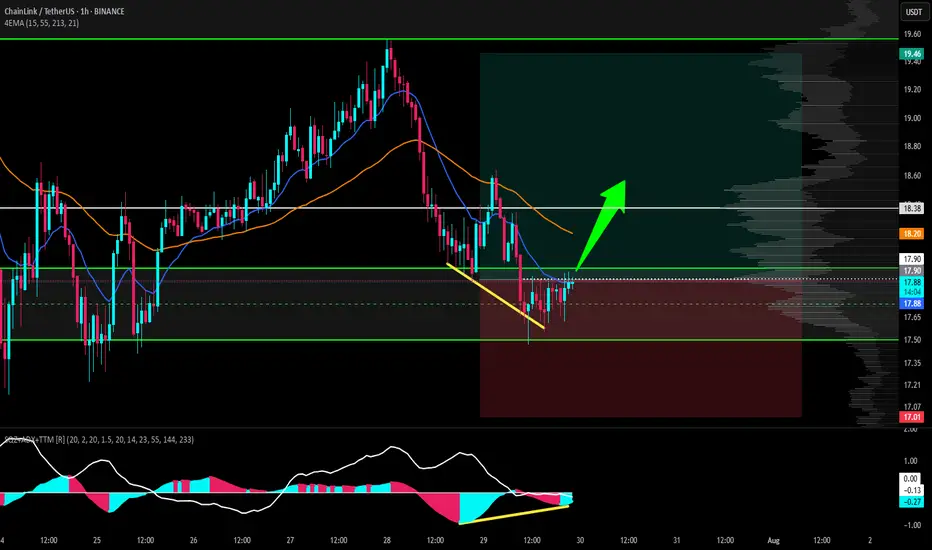
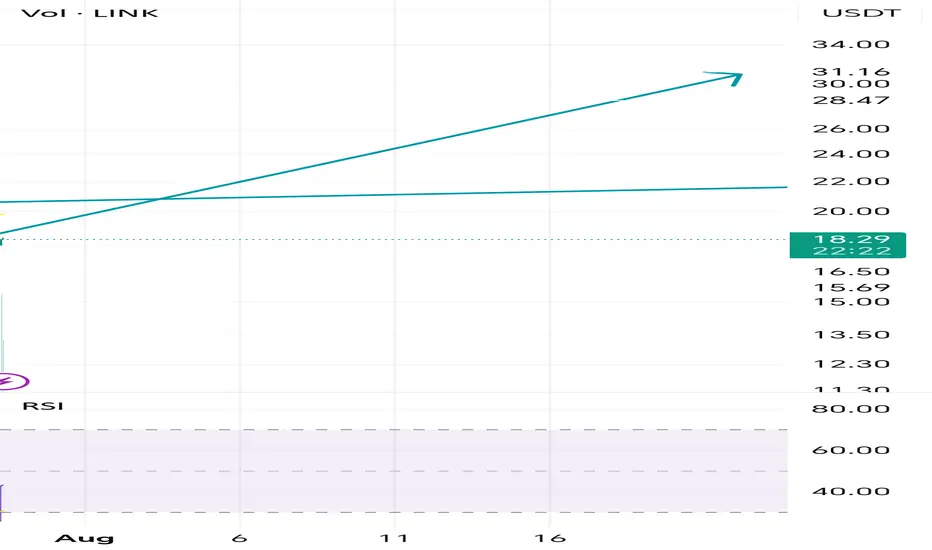
LINK - The sleeping Giant ready to wake!Don't forget to add LINK to your watchlist — it's a solid project with long-term investment potential.
The weekly chart shows that LINK is currently retesting the downtrend line it recently broke — a textbook bullish retest.
The lower trendline now acts as a key support level, and as long as price holds above it, the structure remains healthy.
Currently trading around $17.6, the price hasn’t moved significantly yet —
You’ve got:
✅ A strong fundamental project
✅ A bullish technical setup
✅ Large market cap
✅ Still early entry
What more do you need to enter?
Accumulate now... and thank me later.
Best Regards:
Ceciliones🎯
LINKUSDT trade ideas
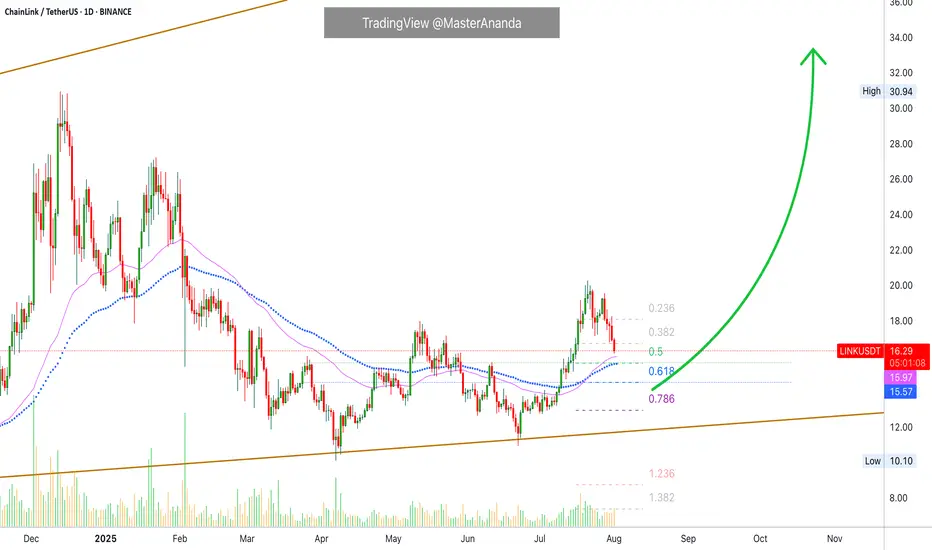
ChainLink · Short-Term Correction (Retrace) · 2025 Bull MarketWe have evidence that ChainLink won't be moving much lower. There are mainly two reasons: 1) There aren't that many sellers and 2) we have strong support. We have an active support range between $14.5 and $15.95. This is the reversal point. Either current prices or this lower range which shows an intersection between two strong moving averages as well as Fib. retracement levels.
The rise between June and July has a stronger slope compared to the one before. The April-May rise was more spread out and so the correction lasts longer. The present one has a stronger slope, it is more steep, and thus a retrace will have a shorter duration because prices will continue growing.
Volume is extremely low on the drop and bearish momentum is not present. There can be one final flush reaching the levels mentioned above or lower on a wick and the market turns. The flush would make everything seen pretty bad and red but the truth is that this would be the end. When the major sell is in, the market turns around and moves the other way.
LINKUSDT is retracing within a bullish bias mid-term. Long-term growth is possible based on the bigger picture.
LINKUSDT is facing an intersection of multiple support zones, if these levels hold, we can see a resumption of the bullish move and prices grow. Each time a retrace is over, the bullish wave that follows will be many times stronger than the previous one until the bull market ends.
We are still looking at bottom prices. The best is yet to come.
Namaste.
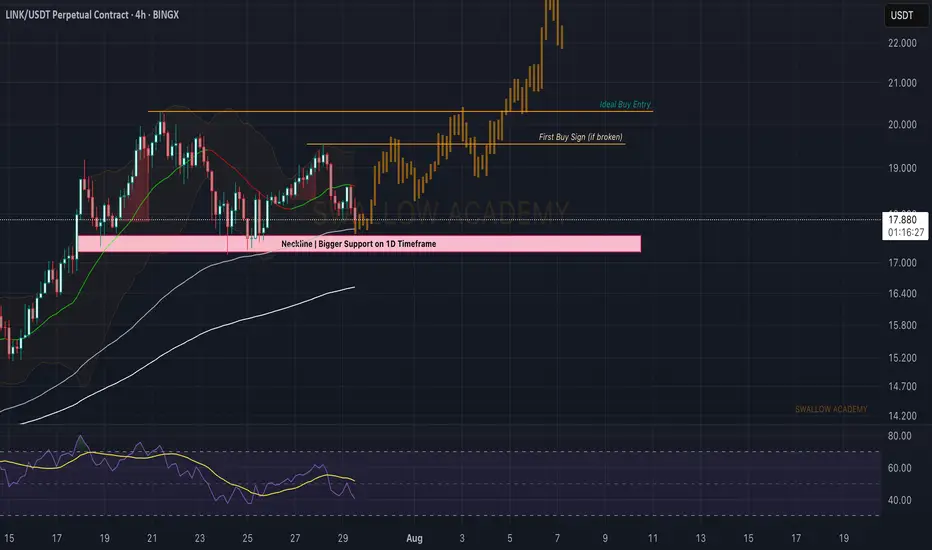
Chainlink (LINK): Potential Bounce Incoming | Eyes on Neckline!Chainlink is in an accumulation zone currently bouncing from that neckline zone (which has aligned with 100 EMA).
We are looking for proper bounce or buyside signs here, which would give us a good opportunity for a potential buy entry here
Swallow Academy
Chainlink (LINKUSDT) has shown strong bullish momentumKey Points
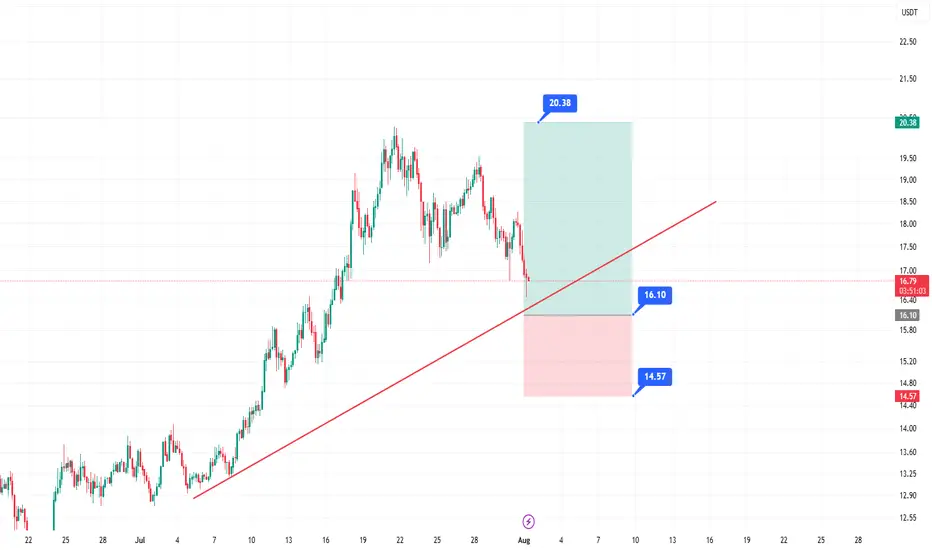
It seems likely that a long entry for LINKUSDT at $15.70–$16.10 using a limit order is a valid strategy, given recent bullish trends and technical support levels.
The take profit at $20.38 and stop loss at $14.57 suggest a favorable risk-reward ratio, but market volatility could affect outcomes.
Research suggests waiting for a pullback to the entry range, as the current price ($16.86) is slightly above it.
Market Context
Chainlink (LINKUSDT) has shown strong bullish momentum, rallying from $11.45 to $19.66 earlier in 2025, and is currently consolidating. The $15.70–$16.10 entry range aligns with key technical levels, including a 0.618 Fibonacci retracement and the 20-period EMA on the 4H chart, making it a potential support zone for a long entry.
Trade Plan
Entry: Use a limit order between $15.70 and $16.10, splitting entries for better average price.
Take Profit: Aim for $20.38, offering a significant upside potential.
Stop Loss: Set at $14.57 to manage risk, ensuring a clear invalidation level.
Risk Management: Risk 1–2% of your account, adjusting position size based on the stop distance.
Considerations
Given the current price is $16.86, you may need to wait for a pullback to enter at the desired range. Monitor Bitcoin’s price action, as it can influence altcoins like LINKUSDT. Always do your own research, as crypto markets are highly volatile.
Survey Note: Detailed Analysis of LINKUSDT Long Entry Strategy
This survey note provides a comprehensive analysis of the proposed LINKUSDT long entry strategy, incorporating your specified parameters (entry at $15.70–$16.10, take profit at $20.38, and stop loss at $14.57) and recent market data as of 09:31 AM +0530 on Friday, August 01, 2025. The goal is to create a detailed trading idea suitable for publishing on TradingView, with technical analysis, risk management, and community engagement considerations.
Market Overview and Recent Price Action
Chainlink (LINKUSDT) has demonstrated significant bullish momentum throughout 2025, breaking out of a multi-month descending channel and rallying from a low of $11.45 to a high of $19.66. As of today, the current price is $16.86 USD, based on the most reliable price data available. This price reflects a pullback from recent highs, suggesting a consolidation phase after a 58% rally, which is typical for healthy trend continuation.
Recent analyses on TradingView and X posts indicate a bullish outlook, with several traders targeting levels above $20, supported by strong fundamentals such as Chainlink’s role as a leading DeFi oracle. For instance, an X post from @cryptoolivee on July 29, 2025, suggested that if $17 holds, targets could reach $22.50–$30.60, while another from @Solfishsoul highlighted a descending wedge breakout with a potential target above $20, backed by RSI crossing 50 and volume spikes.
However, the current price of $16.86 is slightly above your proposed entry range of $15.70–$16.10, which may require waiting for a pullback or adjusting the strategy. Given Bitcoin’s price above $95,000, altcoin strength is supported, but monitor BTC dominance for potential impacts on LINKUSDT.
Technical Analysis
To justify the entry range and targets, let’s break down the technical setup:
Price Action and Structure:
On the 4H and 1D charts, LINKUSDT is forming higher highs and higher lows, confirming a bullish trend. The pullback to $15.70–$16.10 aligns with:
A 0.618 Fibonacci retracement level from the $11.45 low to $19.66 high, a common reversal zone.
A previous resistance-turned-support zone around $16.00, based on historical price action.
The 20-period EMA on the 4H chart, acting as dynamic support, which recent analyses on TradingView confirm as a key level.
Key Levels:
Support Zone: $15.70–$16.10, with stacked confluence from Fib, prior structure, and EMA.
Resistance Targets:
T1: $17.50 (recent consolidation low, +9% from entry).
T2: $19.80 (prior high, +23% from entry).
T3: $21.00 (channel breakout target, +31% from entry).
Your specified take profit at $20.38 fits within this bullish range, offering a significant upside potential.
Invalidation: A 4H close below $15.20 signals a potential trend reversal, but your stop loss at $14.57 provides a wider buffer, which is prudent given crypto volatility.
Indicators:
RSI (4H): Currently at 58, indicating bullish momentum without being overbought, with room for upside before reaching 70.
Volume: Recent breakouts ($15–$17 and $19) showed increasing volume, suggesting strong buying interest. The current pullback shows lower volume, typical of a healthy retracement, as noted in TradingView analyses.
MACD (4H): Bullish crossover intact, with the histogram showing slight weakening but no bearish divergence, supporting the setup.
Market Context and Sentiment:
TradingView’s technical ratings as of today show a neutral signal, but a buy signal for 1 week and a strong buy for 1 month, aligning with the bullish sentiment. Volatility is 3.28% today, with a 24-hour change of -0.11%, -2.70% for 1 week, but +32.31% for 1 month and +32.37% for 1 year, indicating strong longer-term momentum.
X posts, such as one from @Arvintd on July 25, 2025, suggest long entries at $17.150–$17.600 with targets up to $19.650, slightly above your range but supportive of bullish moves. Another from @2gentledude echoed similar levels, using 50x leverage, though caution is advised for such high leverage.
Trade Plan and Execution
Given your parameters, here’s how to structure the trade for TradingView publication:
Setup: Long LINKUSDT with a limit order in the $15.70–$16.10 range.
Entry Zone: Place limit orders between $15.70 and $16.10, splitting entries for better average price to manage slippage.
Take Profit Targets:
Your specified TP at $20.38 can be the primary target, offering a significant upside. For scaling, consider:
T1: $17.50 (50% position, R:R 2.5:1).
T2: $19.80 (30% position, R:R 5:1).
T3: $21.00 (20% position, R:R 6.5:1), given the bullish targets in analyses.
Stop Loss: Set at $14.57, as specified, which is below the $15.20 invalidation level, providing a wider buffer for volatility.
Risk Management:
Risk 1–2% of your account per trade, adjusting position size based on the stop distance (from $15.90 average entry to $14.57 SL, ~8.5% risk, so size accordingly).
Use spot or low leverage (3–5x) to manage risk, as futures trading amplifies losses, especially given recent X posts suggesting 50x leverage, which is high risk.
Trade Duration: Expected 3–10 days, depending on momentum and BTC price action.
Execution Notes:
Wait for price to enter the $15.70–$16.10 zone and show bullish confirmation, such as a 1H bullish candle, RSI bounce, or volume increase, to ensure entry at support.
Avoid chasing if price breaks above $16.50 without testing the entry zone, as it may indicate a stronger upward move bypassing your range.
Risk Assessment and Considerations
Crypto markets are highly volatile, and several factors could impact this setup:
A Bitcoin drop could drag LINK below $15.20, potentially hitting your SL at $14.57. Monitor BTC dominance and LINK/BTC pair for correlations.
False breakouts are possible; if $15.70 fails to hold, price may test lower supports like $14.00–$14.20, as noted in some TradingView analyses.
Given the current price of $16.86, you may need to wait for a pullback, which could take time or not occur, adding uncertainty. Adjust expectations if the market continues upward.
Community Engagement and Publishing Notes
To maximize engagement on TradingView:
Chart Setup: Attach a 4H or 1D chart with:
Marked entry zone ($15.70–$16.10).
Fibonacci retracement levels (0.618 at ~$16.00).
20 EMA on 4H.
Support/resistance zones ($17.50, $19.80, $21.00).
Stop loss level ($14.57, as specified).
Tags: #LINKUSDT #Chainlink #CryptoTrading #BullishSetup #TechnicalAnalysis #Altcoins
Visibility: Set to public for maximum reach.
Engagement: Encourage comments, such as “What’s your take on LINKUSDT? Are you bullish or waiting for a deeper dip? Drop a comment below, and let’s discuss!” and respond to feedback to build credibility.
Summary Table of Key Levels and Targets
Level/Type
Price (USD)
Description
Entry Range
15.70–16.10
Limit order zone, Fib and EMA support
Take Profit (TP)
20.38
Primary target, aligns with bullish targets
Stop Loss (SL)
14.57
Wide buffer below invalidation at $15.20
Support Levels
14.00–14.20
Potential lower test if entry fails
Resistance Targets
17.50, 19.80, 21.00
Scaling targets for partial profits
This table summarizes the critical levels for your trade, ensuring clarity for TradingView readers.
Disclaimer and Final Notes
Trading cryptocurrencies involves high risk, and you may lose more than your initial capital. Always use proper risk management and consult your financial advisor before trading. This idea is based on available data and analyses but is not financial advice—do your own research (DYOR).
Given the current price of $16.86, this setup may require patience for a pullback, but the technical confluence and bullish sentiment support its validity. Adjust as needed based on market developments.
Key Citations
Chainlink/Tether Price Chart Analysis
Recent LINKUSDT Trade Ideas
Chainlink Price and Chart Data
LINKUSDT Trading Idea from Arvintd
LINKUSDT Monthly Analysis from cryptoolivee
LINKUSDT Breakout Analysis from Solfishsoul
LINKUSDT Long Idea from 2gentledude
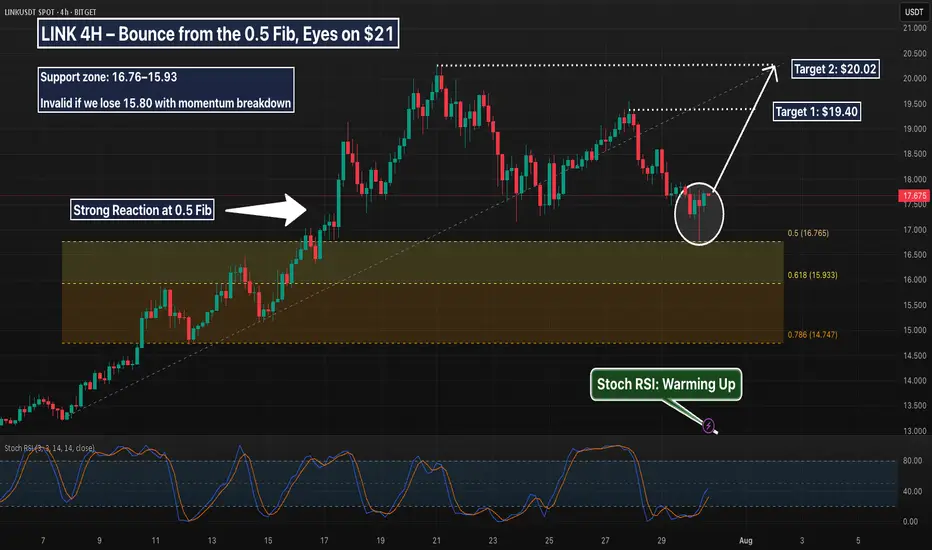
LINK 4H – Bounce from the 0.5 Fib, Eyes on $21Chainlink just posted a clean reaction off the 0.5 Fibonacci retracement (16.76), reclaiming trend structure after a sharp pullback.
The last time LINK bounced from this zone, it ripped straight through resistance. Now we’ve got:
Strong support reaction off the 0.5 Fib
Higher low forming inside structure
Stoch RSI resetting from oversold
Clear measured move potential toward $21.00
This setup gives a defined invalidation zone just below 16.50, with upside targeting the previous high and beyond.
🔍 Key Levels:
Support zone: 16.76–15.93
Target 1: 19.50
Target 2: 21.08
Invalid if we lose 15.80 with momentum breakdown
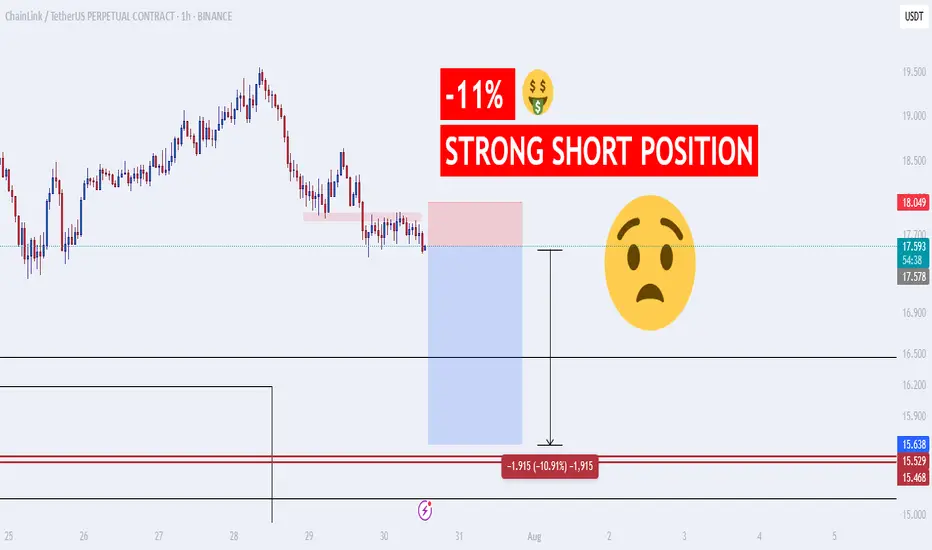
OMG!!! Srtong Short Position!! -10%The price of BIST:LINK is expected to drop by 10% soon. If you enter a short position with 10x leverage, you can potentially make a 100% profit and double your capital! This is an excellent opportunity. Strong sell signal: just take a look at the chart.
Link targeting 30$In my view after a deeper retracement to 0.618 fibonacci level , about 16.3$, Link bullish trend will resume to target 30.4$
Link pump today at least $18.78Am taking this #Link long. Anticipate tp to hit today if goes according to plan.
Weekly bullish
Daily bullish
4hr bearish
1hr bullish
I think the market will soon attempt to flip back bullish on the 4hr tf. Market is making...(Further breakdown on my X page with more charts)
LINK/USDT, 1H chart, Futures - Bullish projection.based on 1H chart, we have a confirmed bullish divergence, this divergence is supported by potential bullish divergence in formation for 4 chart
H, so it could boost the movement with much more upward probabilities.
Smart Robbery Plan: LINK/USDT Long Setup | Swing/Day Trade Idea🚨CHAINLINK HEIST PLAN 🚨 | LINK/USDT Market Robbery (Thief Trader Style) 💰🔐
🌍 Hola! Bonjour! Hallo! Marhaba! What’s up, Money Makers & Market Robbers?! 🕶️💵
Get ready to raid the LINK/USDT vault with Thief Trader’s high-precision strategy based on 🔥 Technical & Fundamental fusion 🔥.
This is not your regular setup. This is a robbery roadmap. Designed for swing & day traders, and spiced with smart DCA entries, risk control, and a bold vision. Let's get into the game plan before the market alarms go off! 🚓📉📈
🎯 Master Plan – LINK/USDT | Bullish Setup
Entry:
📌 “The vault is open – grab the loot!”
Start entering long anywhere within the nearest price pullback zone. Use 15m to 30m TFs for sniper-style limit entries.
🛠️ Deploy DCA-style multiple limit orders (layered strategy), preferably around recent swing lows or major liquidity zones.
Stop Loss:
🔐 Place SL just below the 4H swing low wick (Currently at $16.50), adjusting for your risk, lot size, and how many limit orders you're stacking.
Take Profit:
🎯 Main TP target: $21.50
⛔ Or bail early if momentum weakens. Your profit, your decision.
⚡️Scalper’s Memo:
Only scalp on the bullish side – stay with the smart money.
Have deep pockets? Jump in now.
On a budget? Join swing traders and follow the full heist plan.
📉 Use trailing SL to secure profits during volatile rallies.
🔍 Fundamental & Sentiment Snapshot:
LINK is gaining bullish traction due to a combo of strong sentiment, favorable macro outlook, and on-chain flows aligning.
📊 Keep eyes on COT reports, intermarket data, and liquidity metrics.
🧠 Sentiment leans bullish while late bears are trapped in the supply zones above.
🛑 Risk & News Management Alert:
🚨 News releases can spike volatility and mess with clean entries.
📵 Avoid placing trades during high-impact events.
📍 Use trailing stop-loss to protect your running profits and preserve capital.
💖Support the Plan, Join the Heist:
Love the trade idea? 💥Hit the BOOST💥 button and show some love to the strategy that lets traders "rob the market" with confidence.
Every like helps build the strongest heist crew on TradingView.
✅ Stay sharp. Stay patient. Stay profitable.
👤 Thief Trader signing out… until the next raid. 🐱👤💰🚀
#LINK #LINKUSDT #CryptoTrading #ThiefTrader #SwingTrade #DayTrade #DCA #BullishSetup #TradingPlan #TA #RobTheMarket #ChainlinkHeist #SmartMoneyMoves

LINK/USDT: A+ Long Setup at Key Support with Daily OversoldHello traders,
I am monitoring a high-probability long setup on LINK/USDT on the 4H timeframe. The chart is presenting a classic reversal scenario where multiple technical factors are aligning perfectly, suggesting the recent corrective move may be over.
1. Trend & Context (The "Why")
After a strong uptrend, LINK experienced a necessary pullback, confirmed by a Bearish Change of Character (ChoCh). The price has now reached a critical zone where we can anticipate a bullish resumption.
Here are the key confluences for this setup:
Major Dynamic Support: The price is finding strong support directly on the EMA 200, a significant long-term moving average that often marks the end of a correction in a larger uptrend.
Price Action Signal (Liquidity Sweep): The most recent candle performed a perfect Liquidity Sweep (LQDT), wicking below the prior low to take out stop losses before quickly reclaiming the level. This is a classic institutional pattern that often precedes a strong move up.
Momentum Confirmation (MC Orderflow): The momentum oscillator provides the final, high-conviction confirmation:
The MC Orderflow is deep in the OVERSOLD territory, indicating that selling pressure is completely exhausted.
CRITICAL MTF CONFLUENCE : The Multi-Timeframe Cycle Table is showing that both the 4H and Daily timeframes are "Oversold". This HTF alignment is extremely powerful and significantly validates the strength of the reversal signal from this support level.
2. Entry, Stop Loss, and Targets (The "How")
The confluence of these signals provides a clear trade plan with an excellent risk-to-reward profile.
Entry: An entry around the current price ($16.70 - $16.90) is optimal, directly at the EMA 200 support.
Stop Loss (SL): $16.25. This places the stop loss safely below the low of the liquidity sweep wick, providing a clear invalidation point for the trade.
Take Profit (TP) Targets:
TP1: $18.20 (Targeting the cluster of short-term EMAs and the recent consolidation zone).
TP2: $19.50 (The next major swing high resistance).
TP3: $20.28 (The major high of the range, a full trend-reversal target).
Conclusion
This trade presents a textbook "A+" setup. The synergy between a key price action pattern (liquidity sweep) at a major technical level (EMA 200), combined with validated momentum exhaustion on both the 4H and Daily timeframes, creates a very high-probability environment for a significant bullish move.
Disclaimer: This is not financial advice. This analysis is for educational purposes only. Always conduct your own research and manage your risk appropriately.
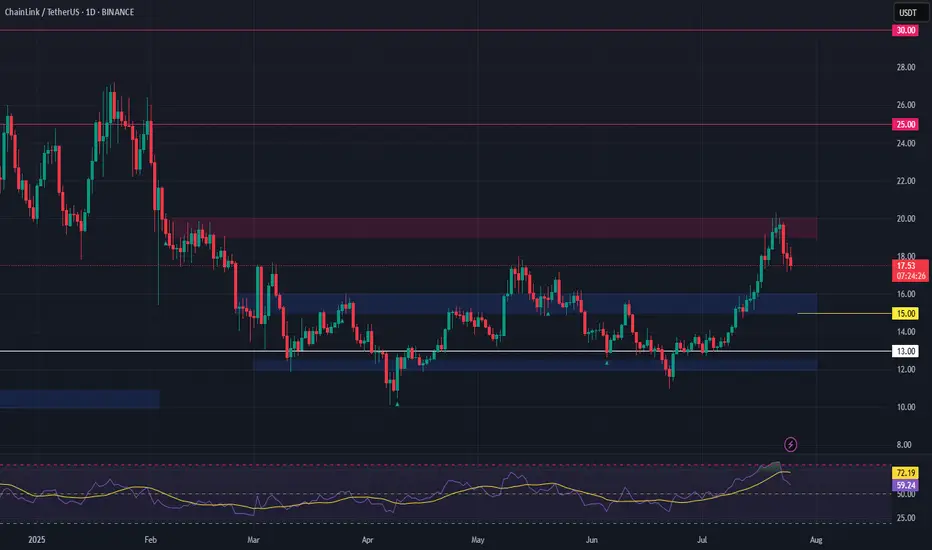
LINK's Technical Signals Point to a 50% Rally by Years-EndLINK is trading at approximately $19.26. The price has shown significant volatility and upward momentum over the past few months, moving from around $10-11 in early 2025 to the current levels near $19, representing an impressive 80-90% increase.
Technical Indicator Analysis
RSI (Relative Strength Index)
The daily RSI is currently at 61.60, which is in bullish territory but not yet overbought
The 4-hour RSI is showing similar strength at 61.60
This indicates robust momentum without reaching extreme levels that would trigger immediate profit-taking
Historical data shows LINK can sustain RSI readings in the 60-70 range during strong uptrends
Price Action Patterns
LINK has formed a series of higher highs and higher lows since May 2025
The price recently consolidated in the $17-19 range before showing signs of continuation
There was a significant price surge from $13-14 levels to above $19 in mid-July, indicating strong buying pressure
The consolidation after rapid gains suggests healthy market behaviour rather than exhaustion
Volume Analysis
Volume has been increasing during upward price movements
Notable volume spikes occurred during the breakout from $15 to $17 and again during the move above $19
This suggests genuine buying interest rather than a low-volume pump
The Volume-Weighted Average Price (VWAP) continues to slope upward, confirming the strength of the trend
Support and Resistance Levels
Strong support has formed around $17.50-18.00
Previous resistance around $19.00 is now being tested as support
The next major resistance appears to be in the $20-21 range based on previous price action
After that, there's relatively little historical resistance until the $25 level
Fibonacci Projections
Using the recent swing low of approximately $11.45 (May 2025) to the recent high of $19.66:
The 161.8% extension projects a target of approximately $24.70
The 200% extension suggests a move toward $28.00
These Fibonacci levels often serve as magnets for price during strong trend movements
LINK Price Projection
Based on the technical indicators analysed:
Short-term (August-September 2025):
LINK appears poised to break through the $20 psychological barrier
Initial target around $22-23 as the next resistance level
Support should hold around $17.50-18.00 on any pullbacks
The clean break above previous resistance at $18.50-19.00 suggests momentum remains strong
Medium-term (October-November 2025):
If the current trend structure remains intact
LINK could target the $24-25 range, aligning with the 161.8% Fibonacci extension
Previous all-time highs near $30 could come into play by year-end
The steady stair-stepping pattern of rallies followed by consolidation suggests this move would be sustainable
Key Factors to Watch:
Volume on breakouts above $20 and $25
RSI readings for signs of exhaustion or continued strength
Development updates and adoption news specific to Chain-link
Maintenance of the higher lows pattern on any pullbacks
Conclusion
The technical picture for LINK appears bullish, with multiple indicators suggesting continued upward momentum. The price has established a strong uptrend with healthy consolidation periods. The recent price action shows accumulation rather than distribution, with higher lows forming during consolidation phases.
The most likely scenario based on current data suggests LINK could reach the $24-25 range in the next 2-3 months, with potential for movement toward $28-30 by the end of 2025, representing a 30-55% increase from current levels. However, investors should monitor key support levels around $17.50-18.00 for any signs of trend reversal.
The clean chart structure, steady volume profile, and measured RSI readings all point to a continuation of the current uptrend, making LINK's technical outlook decidedly positive for the remainder of 2025.
LINKUSDT 12H#LINK has broken below the neckline of the double top pattern on the 12H timeframe.
📌 Place your buy orders near the key support levels:
$15.90 – $15.42
If the price reclaims the neckline and breaks above it, the potential upside targets are:
🎯 $18.96
🎯 $20.28
🎯 $21.54
⚠️ As always, use a tight stop-loss and apply proper risk management.

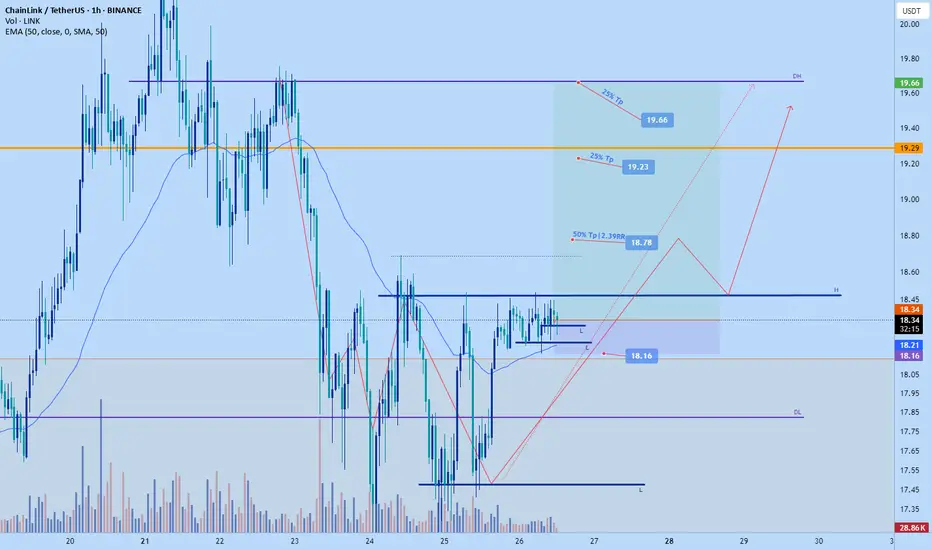
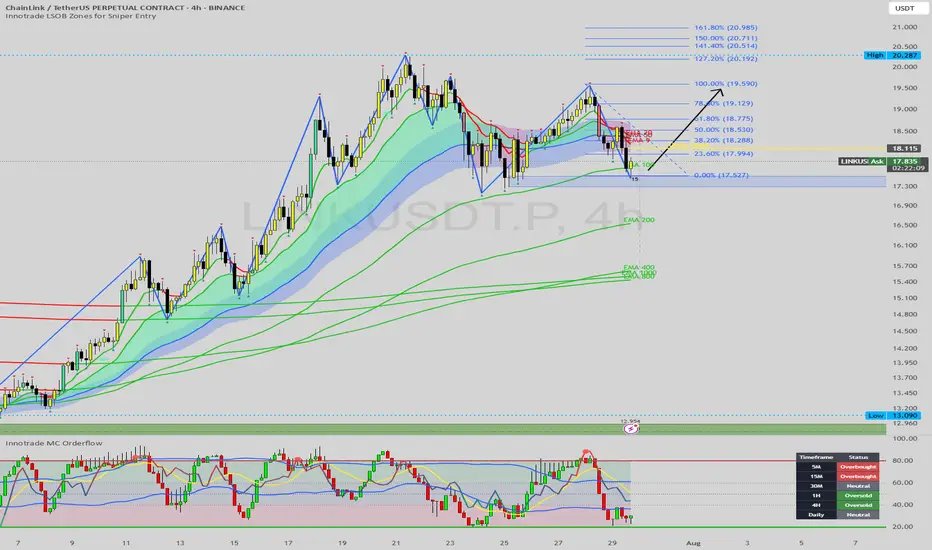
LINK at a Crossroads: A High-Confluence Setup at Key SupportToday we're analyzing Chainlink (LINK), which is currently testing a critical support level after a sharp pullback from the $20.28 highs. The price is now situated at a technical crossroads that will likely determine its next major directional move.
This analysis will detail the powerful confluence of technical factors that make the current zone a high-probability area for a bullish reversal. This is an educational breakdown of how to stack multiple signals to identify a strong "buy the dip" opportunity within a larger uptrend.
The Analysis: A Convergence of Bullish Factors
The most reliable trade setups occur when several independent indicators all point to the same conclusion. On this 4-hour chart for LINK, we have a textbook example of such a convergence.
1. The Overarching Bullish Structure:
First, let's look at the big picture. The Zig-Zag indicator shows a clear and healthy uptrend, defined by a series of higher highs and higher lows. This establishes our primary bias. The current downward move is corrective, not a trend reversal, meaning our focus should be on finding logical entry points to rejoin the dominant trend.
2. The Critical Support Cluster:
LINK is currently testing a powerful floor of support between $17.30 and $17.80. This is not just one level, but a cluster of three key support elements:
Prior Swing Low: The price is testing a key structural low, a natural point where buyers are expected to show interest.
Demand Zone / Order Block: A significant demand zone (the blue-shaded area) is located here, representing an area of prior institutional buying interest.
The EMA 100: Providing a strong layer of dynamic support, the EMA 100 is flowing directly into this structural and order block zone. The confluence of these three factors creates a formidable support area.
3. The Momentum Exhaustion Signal:
This provides the crucial timing for our setup. While the price has been dropping, our momentum dashboard shows that sellers are running out of steam precisely as price hits this key support cluster.
The 1H and 4H timeframes are both registering as "Oversold." This indicates that on the timeframes most relevant to our chart, selling pressure is exhausted. It's a classic sign that the corrective move is overextended and a reversal is likely.
The Potential Trade Plan
Based on this strong alignment of structure, support, and momentum, here is a potential trade plan:
Entry Zone: The current support cluster between $17.30 and $17.80 is the ideal zone to watch for bullish price action and potential entries.
Stop Loss: A logical stop loss can be placed just below the recent swing low and the demand zone, around $17.10. A break below this level would invalidate the immediate bullish thesis.
Potential Targets:
Target 1: A reclaim of the Daily Open at $18.11.
Target 2: A test of the overhead resistance and the descending short-term MAs in the $18.80 - $19.20 area.
Target 3: A full retest of the major swing high at $20.28.
Conclusion
We have a powerful confluence of bullish factors: the price is respecting a primary uptrend structure, it has entered a key support cluster (swing low + demand zone + EMA 100), and multi-timeframe momentum is signaling that sellers are exhausted. This presents a compelling, high-probability setup for a long position on Chainlink.
Disclaimer:
This analysis is for educational purposes only and does not constitute financial or investment advice. Trading involves a high level of risk. Always conduct your own thorough research and consult with a licensed financial advisor before making any trading decisions.
LinkOn the higher TF Link is breaking out from its structure, my first target is 21.5
2nd target 28
3rd 30
Good luck
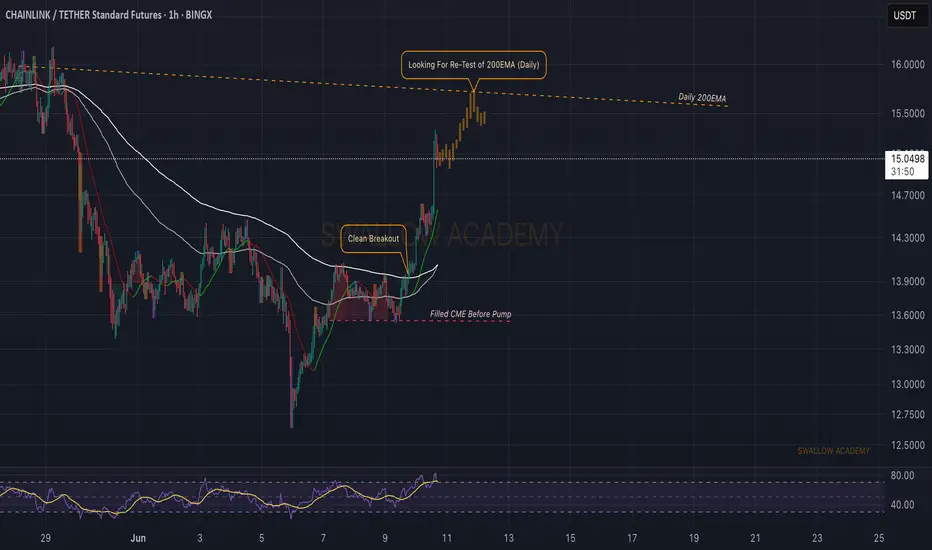
MY idea
Chainlink (LINK): Looking For Target of 200EMA (Daily)Chainlink has done very well, and we have also opened one long position near the breakout area at $14. Now we are looking for the price to have a proper retest after what we expect to see some downward movement so eyes on the daily 200EMA line for now!
Swallow Academy
LINK Swing Trade – Watching for a PullbackLINK has rallied 58% since June 24th and is now consolidating after making a higher high. Price action is facing resistance and looks overheated, so a pullback toward support could offer a fresh long entry.
📌 Trade Plan:
• Entry Zone: $15.00 – $16.00 (on pullback)
• Take Profit Levels:
o 🥇 $20
o 🥈 $25
o 🥉 $30
• Stop Loss: Close below $13
link buy midterm"🌟 Welcome to Golden Candle! 🌟
We're a team of 📈 passionate traders 📉 who love sharing our 🔍 technical analysis insights 🔎 with the TradingView community. 🌎
Our goal is to provide 💡 valuable perspectives 💡 on market trends and patterns, but 🚫 please note that our analyses are not intended as buy or sell recommendations. 🚫
Instead, they reflect our own 💭 personal attitudes and thoughts. 💭
Follow along and 📚 learn 📚 from our analyses! 📊💡"

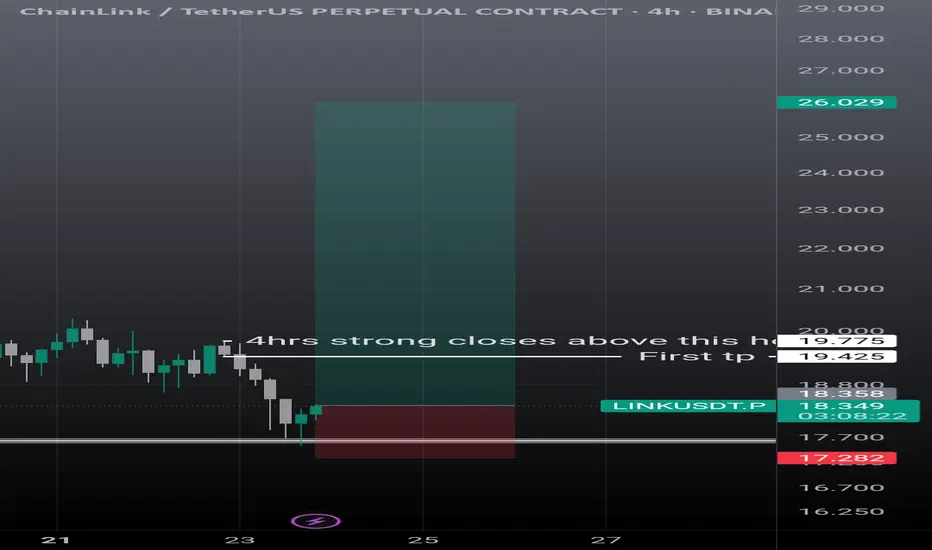
Linkusdt scalp n swing setupLink showing some strong momentum. On 4hrs it can go easily 19.30, then if it breaks strong and closes above the mentioned candle it's next stop is 26$. Must use sl as it can take further correction is it failed to break the mentioned level.
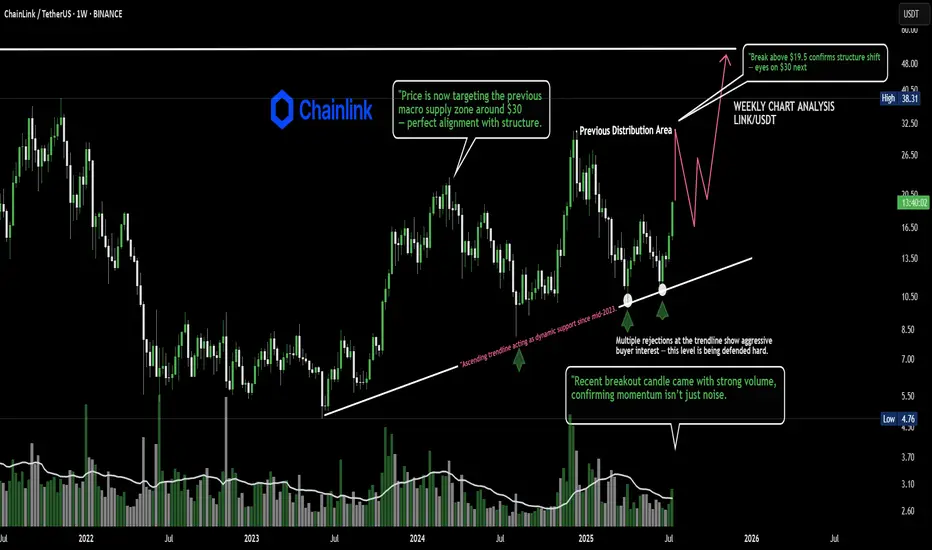
The 2-Year trendline held again.Chainlink just broke out of a 2-year ascending trendline with +70% gains in the last 28 days.
Momentum is backed by strong volume and a clean bullish structure.
Next target? The $30 macro supply zone. 📈🔗
LINK your Idea! Its time!Buying at the right time is the best thing you can do and selling at the right time too! aint it?
Link / UsdtBINANCE:LINKUSDT
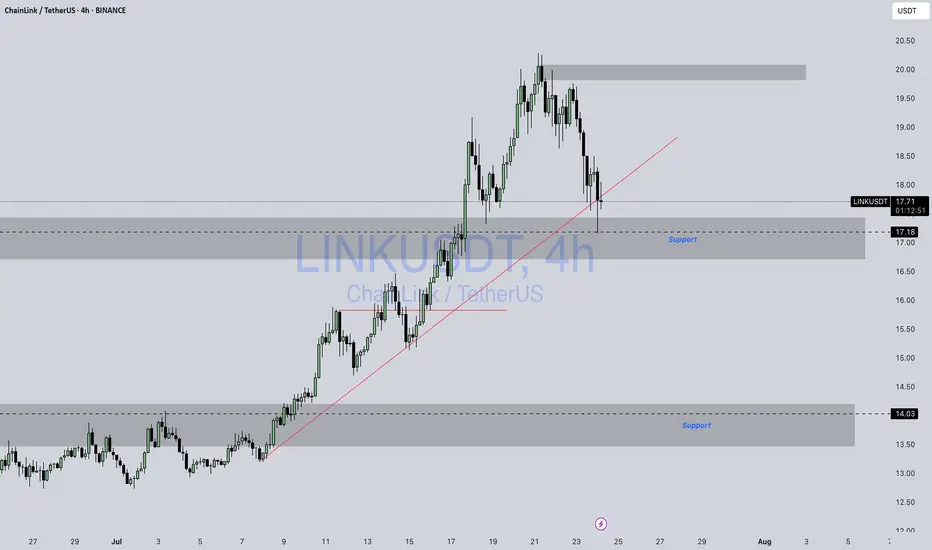
### 📊 **Chart Overview – LINKUSDT (4H):**
* **Current Price:** \$17.65
* **Recent Trend:** Pullback from the \$20.00 resistance zone.
* **Key Support Zones:**
* Immediate: **\$17.00 – \$17.20** (gray demand zone).
* Stronger: **\$14.00 – \$14.20**.
* **Resistance:** \$20.00 psychological level.
---
### 🔍 **Technical Breakdown:**
1. **Trendline Interaction:**
* Price is testing the **ascending red trendline**, which could act as dynamic support.
* A break below could push LINK toward **\$17.18 or even \$14.16** for a deeper correction.
2. **Bullish Scenario:**
* If the \$17.00 zone holds, LINK could bounce and aim for **\$18.50 – \$19.80** in the short term.
3. **Bearish Scenario:**
* A decisive break below \$17.00 may trigger a larger move down to the **\$14.00 support zone**, offering better accumulation levels.
---
### 📌 **Summary:**
LINK is at a **critical decision point** — watch the \$17.00 support zone and the trendline closely for direction confirmation.
---
⚠️ **Disclaimer:**
*This analysis is for informational and educational purposes only. It is not financial advice. Always DYOR and manage your risk before trading.*
Buy Trade Strategy for LINK: Powering Smart Contracts with RealDescription:
This trading idea is centered on LINK, the native token of the Chainlink network—one of the most crucial infrastructures in the blockchain ecosystem. LINK fuels decentralized oracles that connect smart contracts with real-world data, enabling everything from DeFi platforms to insurance protocols and gaming applications. With countless integrations across blockchains and institutional partnerships, Chainlink has positioned itself as a foundational layer for Web3 development. The growing need for reliable, tamper-proof data feeds strengthens the long-term fundamentals of LINK.
That said, the crypto market remains highly speculative and volatile. The price and adoption of LINK can be significantly impacted by macroeconomic conditions, regulatory developments, and overall market sentiment. As promising as the project may be, investing in it should always be approached with caution and a solid risk management strategy.
Disclaimer:
This trading idea is provided solely for educational purposes and should not be considered financial advice. Trading cryptocurrencies like LINK involves substantial risks, including the risk of complete capital loss. Always conduct your own research, evaluate your financial situation carefully, and consult with a licensed financial advisor before making any investment decisions. Past performance is not indicative of future results.
