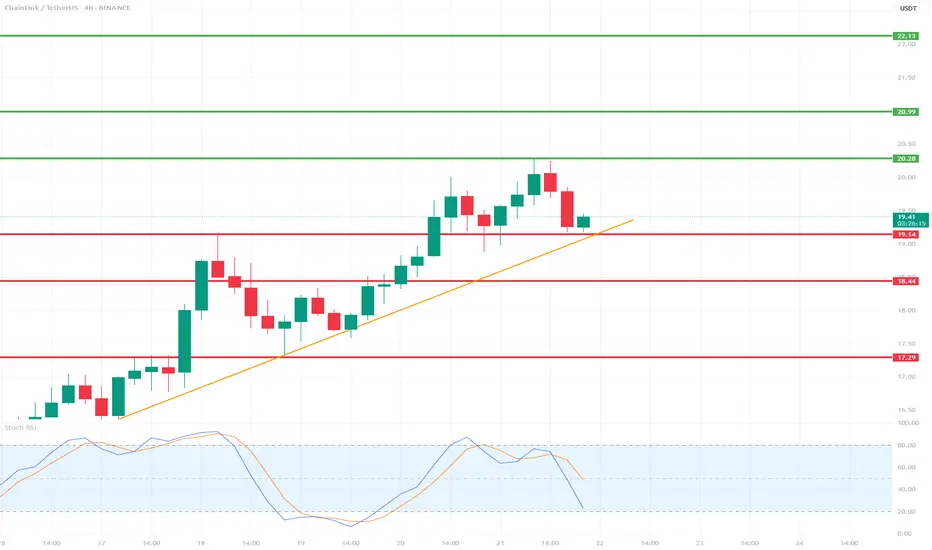
LINK/USDT 4H Chart📉 Indicators and Market Structure:
🔶 Trend:
Current trend: up, as long as it remains above the trend line and the 19.14 USDT level.
Local resistance: 20.28 USDT (recent high).
Next resistances: 20.99 USDT and 22.13 USDT (green lines).
Supports: 19.14 USDT, 18.44 USDT, 17.29 USDT (red lines).
🔷 Stochastic RSI (lower indicator):
Located in the oversold zone (below 20) and starting to reverse upward.
Potential signal of buying pressure if the %K and %D lines cross bullishly.
🧠 Scenarios:
✅ Bullish scenario (trend continuation):
Bounce from the trend line and the 19.14 level → breakout of 20.28 → test of 20.99–22.13.
Confirmation will be a clear bullish candle with high volume and a Stochastic RSI cross up.
❌ Bearish scenario (trend break):
Closing below the trend line and the 19.14 level → correction towards 18.44, and then even to 17.29.
An oversold RSI could support continued declines if a rebound does not occur.
📌 Summary:
Currently, the key level is the trend line and support at 19.14 USDT.
The market is waiting for a reaction – a rebound or a downward breakout.
Stochastic RSI suggests a possible rebound, but candlestick confirmation is needed.
LINKUSDT trade ideas
LINK to 30$ or more?Hi Padawans,
Hope you’re doing well.
I’m anticipating some good short scalp opportunities around the levels marked in the chart.
Do your own research padawans.
Best regards,
Crypto Obi
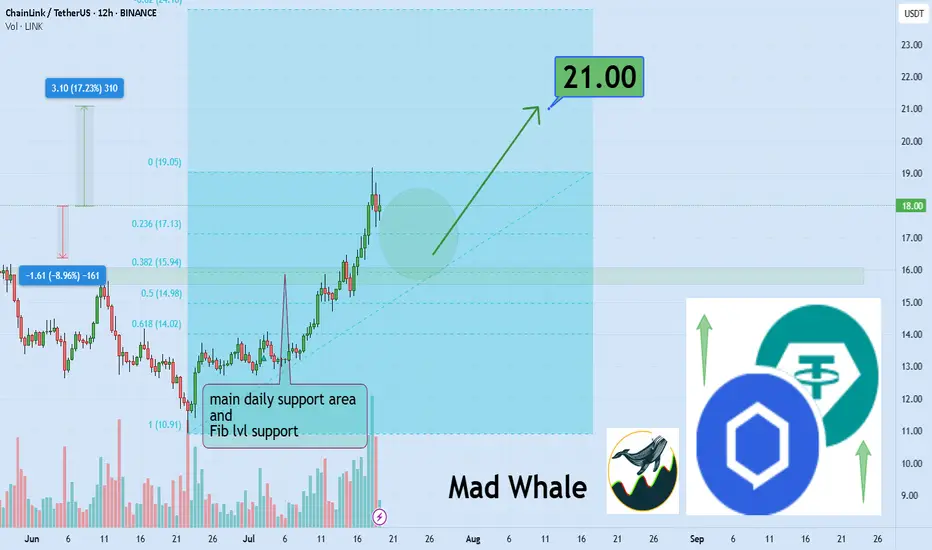
Chainlink Breaks Channel, Eyes 17% Upside Toward $21 TargetHello✌
Let’s analyze Chainlink’s upcoming price potential 📈.
BINANCE:LINKUSDT has broken out of its daily descending channel, printed a multi-month high, and is now pulling back toward daily and Fibonacci support levels; I'm eyeing a 17% potential move higher with $21 as the main target. 🔍📊
✨We put love into every post!
Your support inspires us 💛 Drop a comment we’d love to hear from you! Thanks , Mad Whale

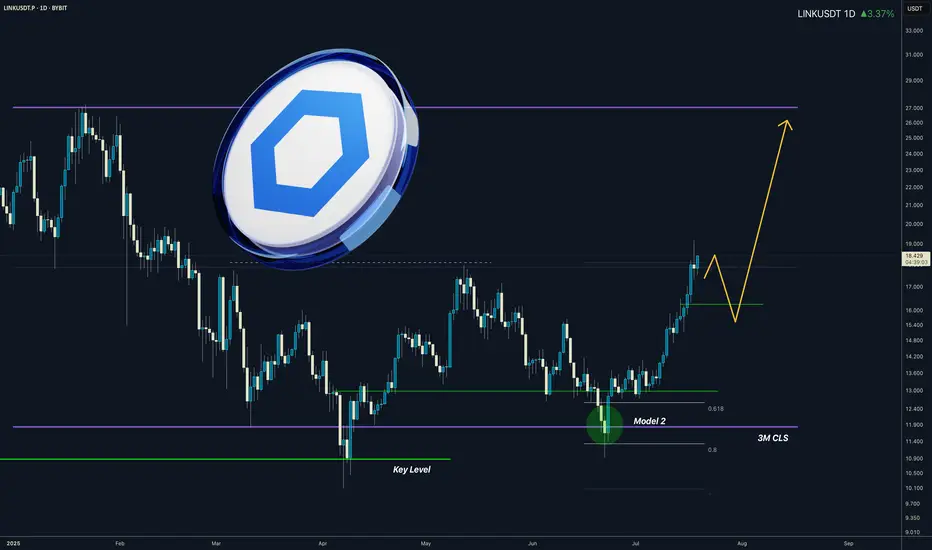
LINK I 3M CLS I Model 2 In the Motion I Target Full CLS rangeYo Market Warriors ⚔️
Fresh Crypto Analysis— if you’ve been riding with me, you already know:
🎯My system is 100% mechanical. No emotions. No trend lines. No subjective guessing. Working all timeframes. Just precision, structure, and sniper entries.
🧠 What’s CLS?
It’s the real smart money. The invisible hand behind $7T/day — banks, algos, central players.
📍Model 1:
HTF bias based on the daily and weekly candles closes,
Wait for CLS candle to be created and manipulated. Switch to correct LTF and spot CIOD. Enter and target 50% of the CLS candle.
For high probability include Dealing Ranges, Weekly Profiles and CLS Timing.
Analysis done on the Tradenation Charts
Disclosure: I am part of Trade Nation's Influencer program and receive a monthly fee for using their TradingView charts in my analysis.
Trading is like a sport. If you consistently practice you can learn it.
“Adapt what is useful. Reject whats useless and add whats is specifically yours.”
David Perk aka Dave FX Hunter
💬 Comment any Coin I ll give you my quick view
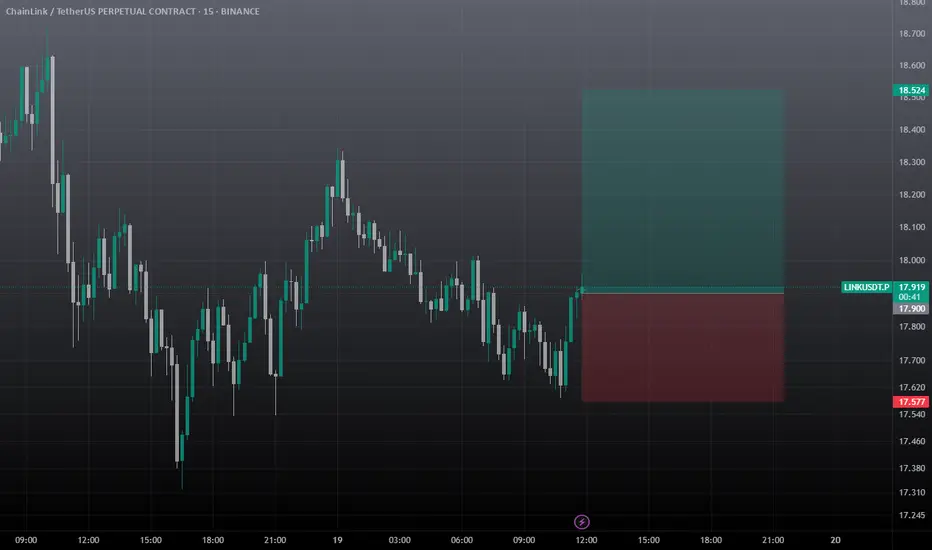
Link Scalp Trade IDEA / Long Scalp Setuplink looking to take out 18.5 area. can take at cmp 17.91, must use sl, it's a scalp trade so don't hold it for long time.
LINKUSDT Forming Falling Wedge LINKUSDT is currently forming a classic falling wedge pattern, a bullish reversal setup that often signals the end of a downtrend and the beginning of a strong upward move. The recent price action within the wedge shows decreasing volatility and tightening price levels, suggesting accumulation is underway. This setup, combined with increasing volume, indicates that a breakout to the upside could be imminent.
Chainlink (LINK) continues to draw investor interest due to its critical role in the decentralized oracle network ecosystem, which bridges blockchain smart contracts with real-world data. The project has maintained relevance in both DeFi and traditional enterprise solutions, and its consistent development activity keeps it on the radar of long-term crypto investors and short-term traders alike. With current market sentiment shifting more favorably toward altcoins, LINK’s technical and fundamental setup makes it a top watch.
The expectation for a 60% to 70% gain is well-supported by previous price performance following similar wedge breakouts. Traders are advised to monitor for a strong volume breakout above resistance lines, as this would confirm the move and likely initiate a new upward trend. If broader market conditions remain positive, LINKUSDT could move swiftly toward higher levels, fueled by both technical momentum and renewed investor confidence.
✅ Show your support by hitting the like button and
✅ Leaving a comment below! (What is You opinion about this Coin)
Your feedback and engagement keep me inspired to share more insightful market analysis with you!

#LINK/USDT targeting 17.77 $ ?#LINK
The price is moving within a descending channel on the 1-hour frame and is expected to break and continue upward.
We have a trend to stabilize above the 100 moving average once again.
We have a downtrend on the RSI indicator that supports the upward break.
We have a support area at the lower boundary of the channel at 15.60, acting as strong support from which the price can rebound.
We have a major support area in green that pushed the price higher at 15.30.
Entry price: 15.84
First target: 16.47
Second target: 17.00
Third target: 17.77
To manage risk, don't forget stop loss and capital management.
When you reach the first target, save some profits and then change the stop order to an entry order.
For inquiries, please comment.
Thank you.

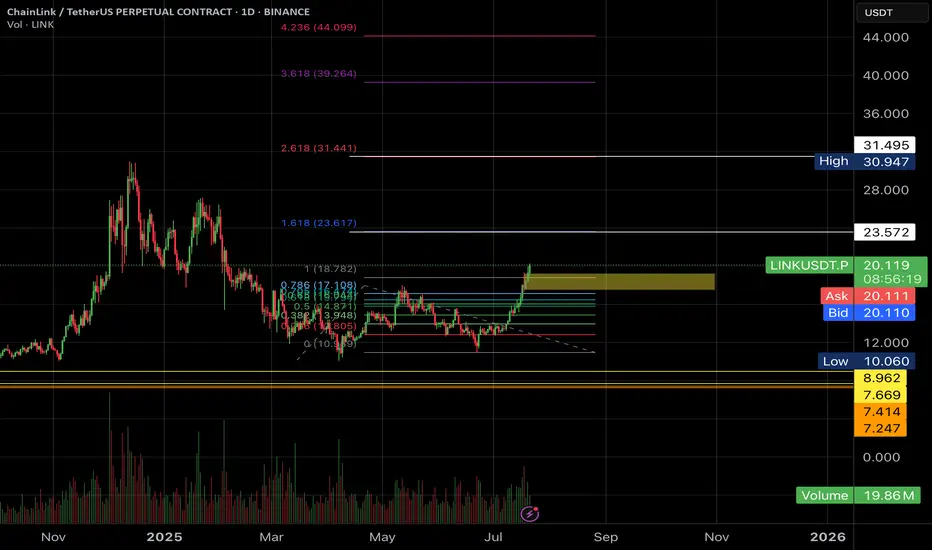
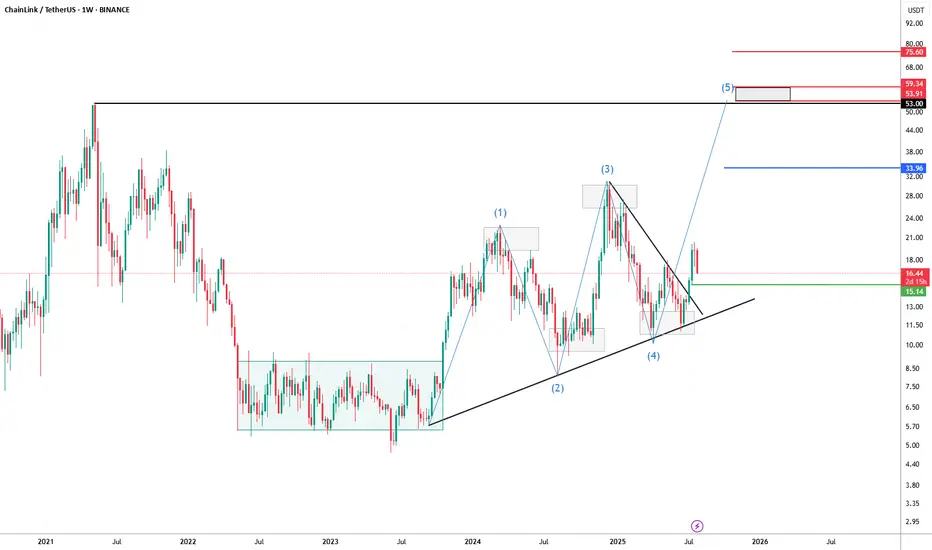
LINK/USDT Weekly Chart – Wave 5 in Play?Chainlink has been showing a textbook technical setup. After spending most of 2023 in a prolonged accumulation phase (highlighted in the range-bound consolidation box), price action broke out and has since been respecting a clear harmonic and Elliott Wave structure.
We’ve now likely completed waves (1) through (4), with a clean breakout from the wedge suggesting the beginning of the final 5th impulsive wave. The projected target zone for wave (5) sits between $53 and $59, aligning with key historical resistance and Fibonacci extension levels.
🔹 Support Zone: $15.14 — key structure and prior breakout level.
🔹 Mid-Level Target: $33.96 — potential resistance and consolidation area.
🔹 Final Target Area: $53.00–$59.34 — Wave 5 objective.
🔹 Stretch Target: $75.60 — if momentum exceeds expectations.
The ascending trendline from mid-2022 continues to act as dynamic support, helping guide this move. As long as the structure holds, the bullish thesis remains intact.
📈 Watching for confirmation of continuation and volume follow-through as we head into Q4.
#LINK #Chainlink #LINKUSDT #CryptoTA #ElliottWave #Harmonics #Altcoins
LINK/USDT 15M SETUP.LINK/USDT 15m Setup 🔥
Price confirmed a bullish shift with a clear ➜ ChoCH.
Now retracing and heading toward a Hidden Demand Zone, with Sell-Side Liquidity (SSL) resting above it.
📍 Expecting price to sweep SSL and tap the zone before a potential bullish reversal.
Perfect SMC setup — wait for reaction and confirmation! 📈

$Link/USDTLINK has taken on a strong upward trend on the daily timeframe and has the potential for solid growth. The EMA cross also confirms this trend. You can either wait for a pullback or consider entering a partial position at the current level

LINK at Resistance | Breakout or Fakeout? 🚨 LINK at Resistance | Breakout or Fakeout?
📉 Watch BTC Dominance – It Might Decide Everything!
🔍 Technical Analysis: Chainlink (LINK/USDT) – 4H Timeframe
📊 Current Setup:
LINK broke through the key $18 resistance and is now pulling back near the $19.15 level.
✅ Price remains above all key moving averages (EMA & SMA) — a sign of strength in the current uptrend.
⚠️ However, oscillators show neutral to slightly overbought signals, increasing the need for caution.
🔸 Market Context (Macro View):
• BTC is consolidating in a tight range.
• BTC Dominance (4H) has broken a key support zone 📉.
If the current bullish candle in btc.d fails, it could confirm a continued drop in dominance → bullish for altcoins.
📌 These conditions are crucial for LINK:
If BTC stays sideways and dominance keeps falling, LINK could see another leg up.
🧮 Technical Signals:
📌 Moving Averages (MAs):
✅ 13 Buy vs. 1 Sell → Strong bullish momentum
✅ Price is above all key MAs, including EMA-200 & HMA
📌 Oscillators:
🔸 Mostly Neutral
🔸 RSI at 69.8 → Near overbought zone
🔸 CCI and Momentum → Showing Sell signals, suggesting possible short-term pullback
✅ Conclusion & Scenarios:
📈 Bullish Scenario:
If LINK breaks $19.15 with a strong candle and volume, the next targets are $20.4 to $21.0.
🟢 This move is more likely if BTC.D drops further and BTC remains flat.
📉 Bearish Scenario:
Failure to break $19.15 or BTC breaking down from its range could trigger a correction back to the $18 or $17.64 support zones (aligned with EMA 20-30).
This area could offer a good long entry with a wider stop.
⚠️ Risk Management Notes:
• Market is showing early overbought signs
• 📉 Volume is declining
• 🚪 Enter with reduced position size and wider stop-loss to avoid volatility traps
🚀 If you found this helpful, smash that rocket icon and follow me to catch the next trade setup!

LINK START...Hello friends🙌
📈As you can see, the upward trend has started, and the power is in the hands of buyers, and here we have an opportunity to enter a buy trade with risk and capital management to move with the specified goals.
🔥Follow us for more signals🔥
*Trade safely with us*

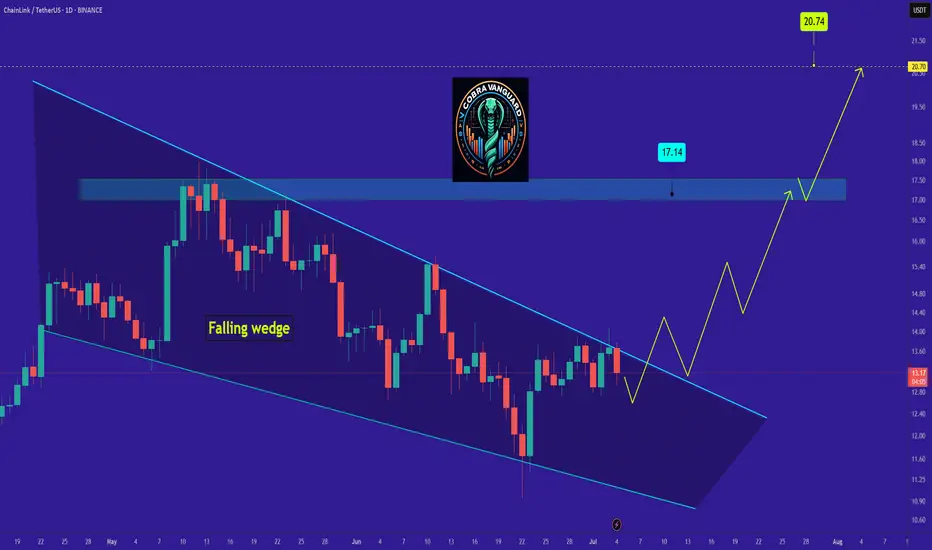
LINK's Situation, A Comprehensive Analysis !!!So if you pay attention to the LINK chart you can see that the price has formed a Ascending wedge which means it is expected to price move as equal as the measured price movement.( AB=CD )
NOTE: wait for break of the WEDGE .
Best regards CobraVanguard.💚
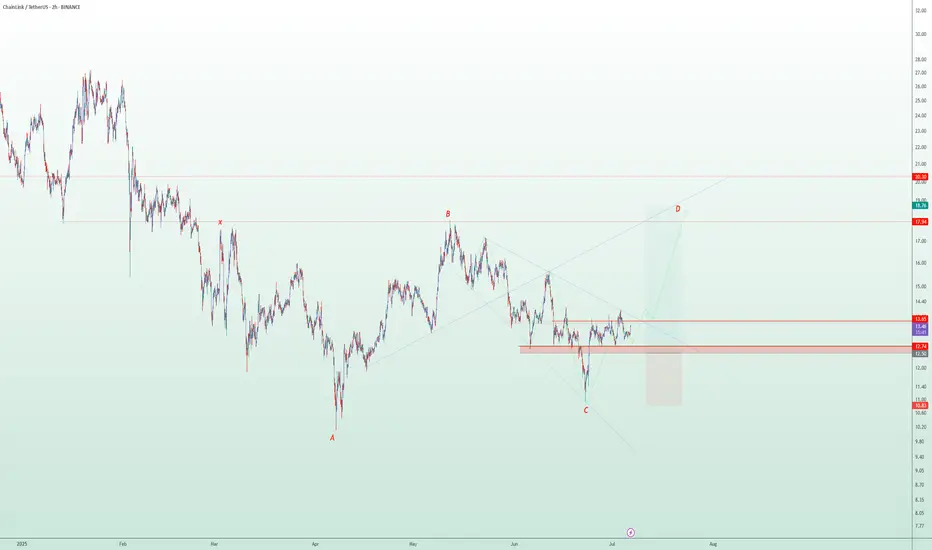
Wings of Opportunity: LINK’s Harmonic Setup Unfolding🦋 Title: A Butterfly on the Edge – But Only with Confirmation
On the 2H timeframe, a Bullish Butterfly Harmonic Pattern is unfolding. The wave structure (X → A → B → C → D) aligns closely with harmonic principles, and point D lies above X, within the 1.27 to 1.618 Fibonacci extension of XA — reinforcing the pattern’s validity.
📌 No entry has been triggered yet.
We are currently waiting for price to break and hold above the key resistance at 13.60 to confirm the bullish scenario.
🔹 Bullish Scenario (our primary and preferred outlook):
Given the strong reaction around the 12.74 demand zone and the harmonic structure completion, we are primarily focused on a long opportunity, if and only if confirmation is achieved above 13.60.
📥 Entry Zone: 13.05 – 13.65
🎯 Target 1: 17.94
🎯 Target 2: 18.76
🛑 Stop-Loss: Below 12.74 (structural invalidation)
🔻 Alternative Bearish Scenario:
If price fails to break 13.60 and instead loses the 12.74 support, the bullish setup becomes invalid, and the market could enter a deeper correction phase.
Potential downside targets in that case:
📉 11.80
📉 10.90 – 10.30 (if bearish momentum continues)
📊 Risk Management Notes:
Position sizing should not exceed 1% of total capital
Avoid early entries before confirmation
Prefer partial entries after breakout and retest
Stick to the invalidation level strictly
📈 While both scenarios are on the table, we are currently favoring the bullish setup, as long as price action supports it. Discipline and patience are key — confirmation first, trade second.
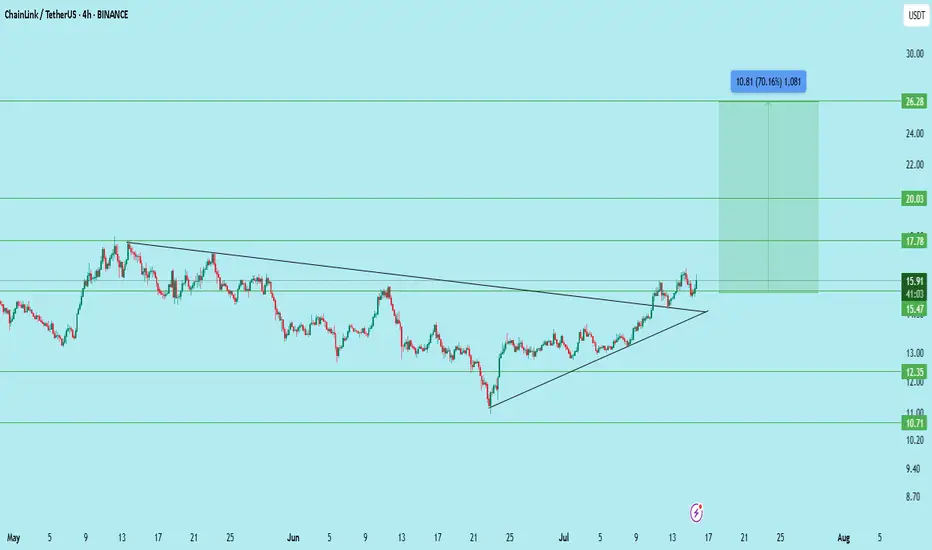
LINKUSDT – Breakout Retest | Ready for 70% Move?LINK has broken out of a long-term descending trendline on the 4H timeframe and retested the breakout zone. Price is holding well above the trendline and support levels, indicating strong momentum and a bullish structure.
Entry: 15.4–15.6
Support: 15.47
Resistance: 17.78
Targets: 17.78 / 20.03 / 26.28
Stoploss: Below 15.00
Structure: Triangle breakout
Potential: +70% upside if all targets are achieved
LINK is looking primed for a strong breakout continuation. Keep it on your radar.
DYOR | Not financial advice
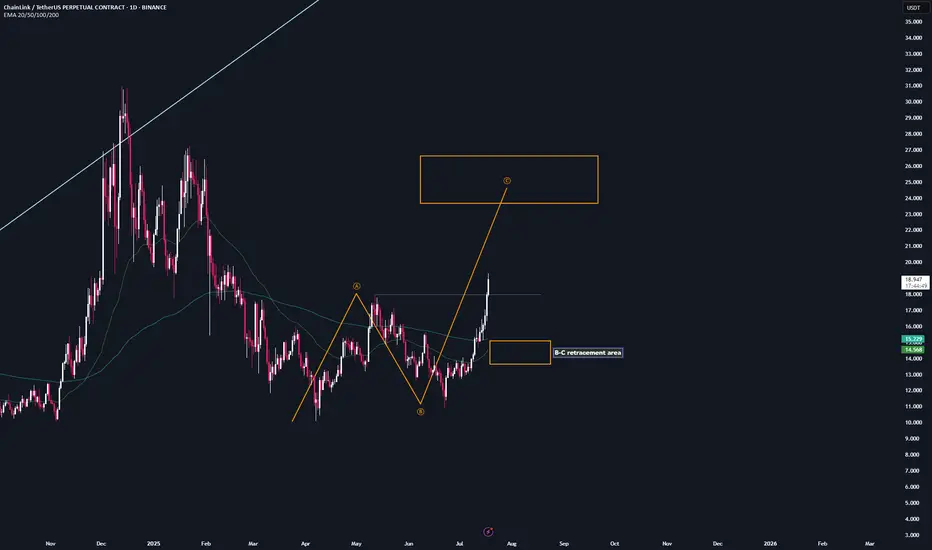
CHainLink | Trade-Setup📌 After the breakout from the last high at $18, a bullish sequence (orange) has now been activated.
📊 These setups typically occur no more than twice per year on any given altcoin, so I’ll be aggressively buying each level at the B-C retracement area.
Trademanagement:
- I'm placing long orders at each level. ((If the price continues climbing, I’ll adjust the trend reversal level (green) accordingly and update my limit orders.)
- Once the trade reaches a 2 R/R, I’ll move the stop-loss to break-even.
- From a 3 R/R onward, I’ll start locking in profits.
✅ I welcome every correction from here on —
but I won’t enter any new positions at these top levels.
Stay safe & lets make money
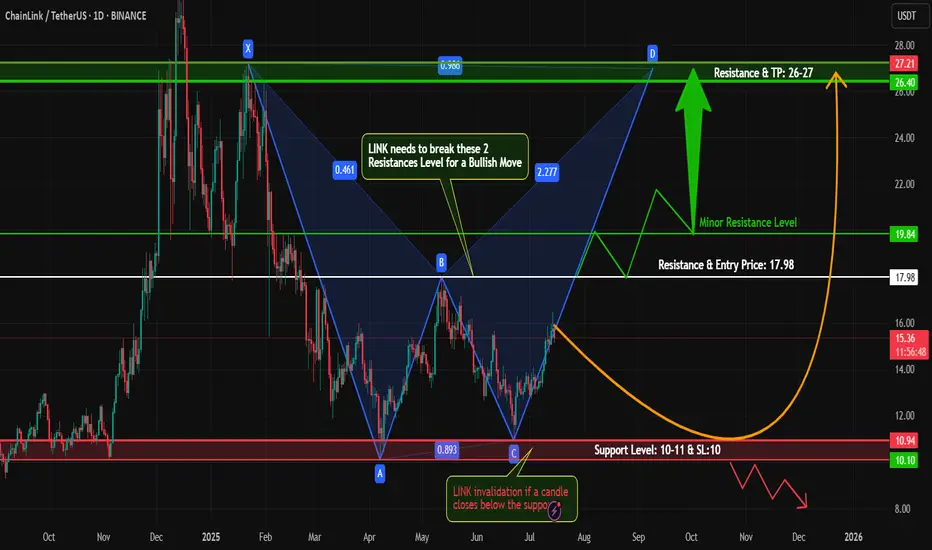
#LINKUSDT – Bullish Harmonic Pattern in Play!Hey Traders!
#LINK is currently trading near the bottom and forming a potential harmonic pattern, suggesting a possible move towards the D-point completion.
Technical Outlook:
Price action is respecting the harmonic structure.
We're watching closely for a break above key minor and major resistance levels.
A successful breakout and retest could confirm a bullish reversal.
Entry on retest with tight risk management and SL as marked on the chart.
Caution: Stay alert for fake breakouts, bearish divergence, or any signs of rejection near resistance. Patience is key — wait for confirmation!
What are your thoughts on #LINK? Are you bullish or bearish? Drop your analysis below!
If you found this setup helpful, like, comment, and follow for more high-probability trading setups every week!
#Crypto #LINK #HarmonicPattern #Altcoins #ChartAnalysis #CryptoTrading #TradingView #BullishSetup #BreakoutTrade #RiskManagement
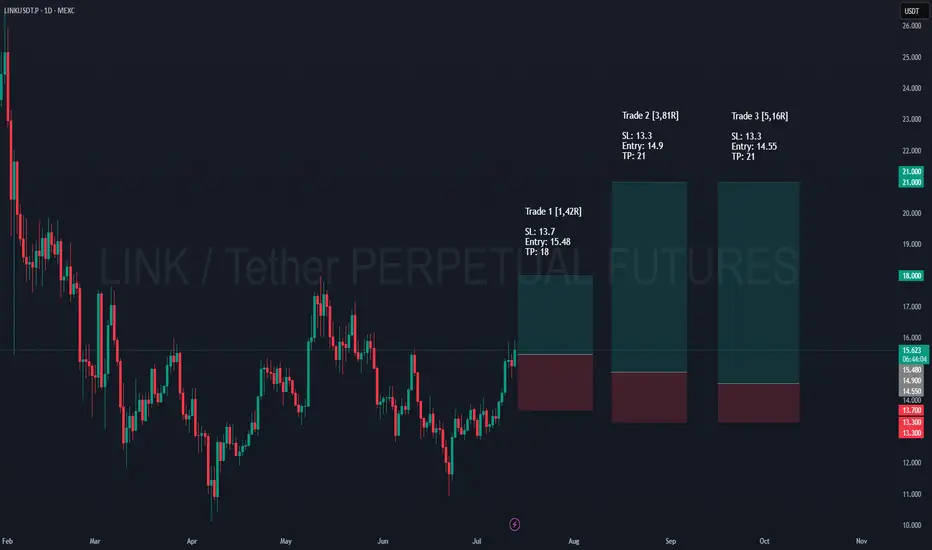
HTF Plan in Action: Scaling into LINKIn the last couple of days, momentum and structure have aligned across the board. Daily reclaimed its breakout zone with conviction, and 4H structure held strong through the recent pullback. We’re seeing clear confluence stack up in the key support zones, including order blocks, breaker blocks, and fair value gaps, all pointing toward healthy re-accumulation rather than a full reversal. Volume profile confirms strong support beneath, and Stochastic RSI on 4H has reset and started turning upward. All of this gives solid reason to scale in confidently across the mapped zones rather than chase strength, so I’ve placed 3 limit long orders on LINK, all anchored in the HTF zones I outlined in my recent idea (link below).
________________________________________
Limit Long Orders:
• Trade 1 → SL: 13.7 | Entry: 15.48 | TP: 18
• Trade 2 → SL: 13.3 | Entry: 14.9 | TP: 21
• Trade 3 → SL: 13.3 | Entry: 14.55 | TP: 21
________________________________________
📍 Trade 1 is positioned higher, just around the 15.20–15.50 decision zone — tighter TP at 18 and wider SL to allow some breathing room. The goal here is to catch continuation early if momentum holds.
📍 Trades 2 & 3 are set deeper, around the 14.80 and 14.50 zones — key areas of volume and fib confluence I highlighted earlier. Both target 21 for higher R.
🧩 The idea: scale in as price dips, adjusting SL/TP to match the depth and structure. No need to chase — just let the levels work.
DISCLAIMER: I am not providing trading signals or financial advice. The information shared here is solely for my own documentation and to demonstrate my trading journey. By openly sharing my process, I aim to put pressure on myself to stay focused and continually improve as a trader. If you choose to act on any of this information, you do so at your own risk, and I will not be held responsible for any outcomes. Please conduct your own research and make informed decisions.
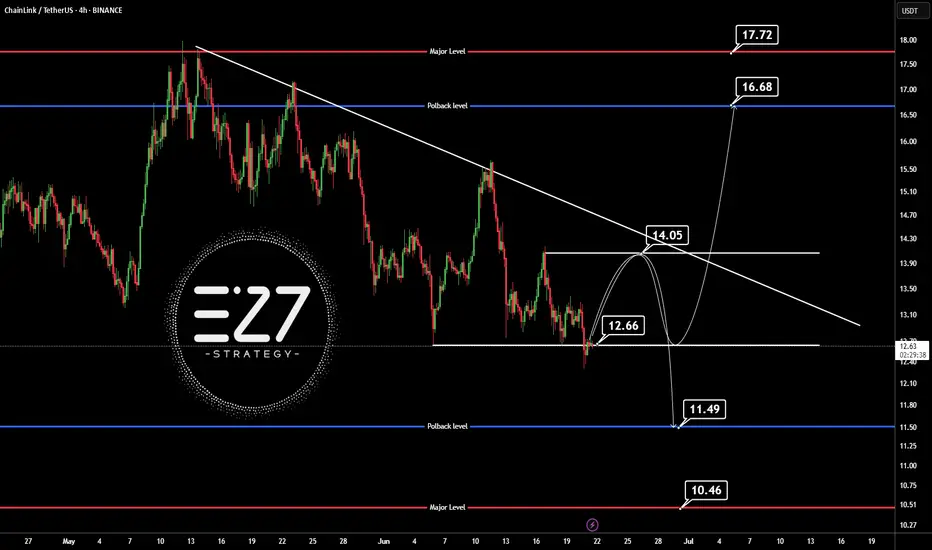
LINKUSDTThis is chart ready for pump but wait for break 14$. BINANCE:LINKUSDT
I in below say best supports and resistance's.
Support:
12.66
11.50
10.50
resistance's:
14
16.68
17.70
⚠️Contorl Risk management for trades.
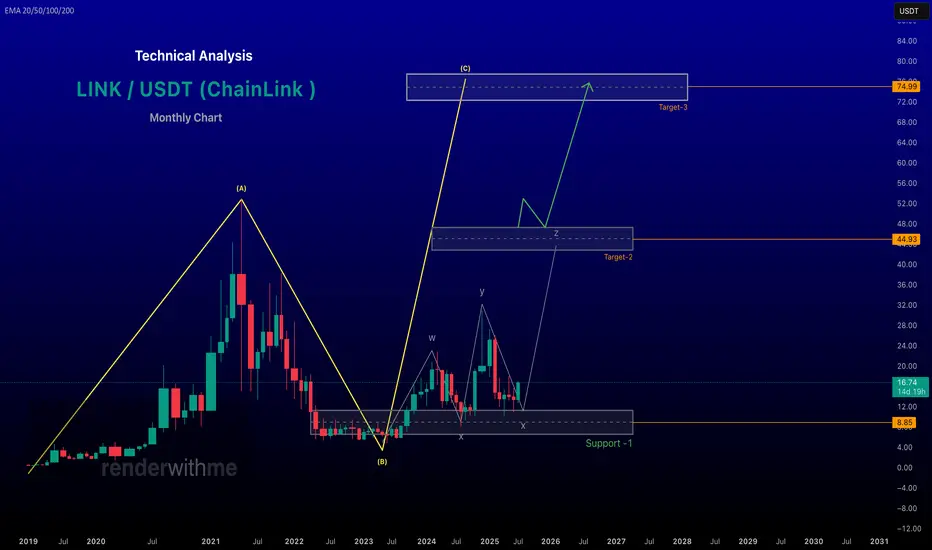
renderwithme | The unbreakable bond of Chainlink TechnicalBelow is a technical analysis of Chainlink (LINK/USD) based on the provided real-time financial data and general market insights. Please note that cryptocurrency markets are highly volatile, and this analysis is for informational purposes only, not financial advice. Always conduct your own research before making investment decisions.
# Current Price and Market Overview
Current Price: $16.70 USD at the time of posting
24-Hour Trading Volume: Not specified in the provided data, but recent sources indicate significant trading activity, with volumes around $422.74M to $672.42M.
52-Week Range: $3.25 (low) to $10.90 (high)
Previous Day Close: $16.67
chart for your reference
Will LINKUSDT Explode Soon — or Collapse Into a Trap?Yello Paradisers, are you prepared for the next big LINK move? The breakout you’ve been waiting for just happened — but before you jump in, let’s break down what’s really going on behind the chart.
💎LINKUSDT has officially broken out of its descending channel — a significant structural shift that immediately increases the probability of a bullish continuation. On top of that, we’ve seen a bullish CHoCH (Change of Character), a powerful sign that demand is stepping in. These are early but critical signs that bulls may be regaining control.
💎However, experienced traders know not to act on the first sign of strength alone. We now need to see how price behaves on the pullback. If LINK pulls back and takes out the inducement (removing weak hands), we’ll be looking for a bullish internal CHoCH (I-CHoCH) on the 1H timeframe. If that forms, the probability of a solid bounce from the support zone becomes extremely high — giving us the confirmation we need to position for upside.
💎On the other hand, if price breaks down and closes a candle below the support zone, this entire bullish setup becomes invalid. In that case, it would be wise to remain patient and wait for better, more reliable price action to develop before making any move. This is exactly where most traders lose by forcing trades instead of waiting for clear signals.
🎖A big liquidation event, which will first take both longs and shorts and fully get rid of all inexperienced traders before the real move happens, is very close to happening again. so make sure you are playing it safe Paradisers. It will be a huge money-maker for some and a total disaster again for the majority.
MyCryptoParadise
iFeel the success🌴

Chainlink (LINK): Looking For Buying Entry | Seeing Further PushChainlink has a good chance for upward movement, which would give you a good opportunity for a smaller long position here.
What we are seeing is a decent uptrend forming where, after a breakout at $14, we have seen a good rally, which now has seen some kind of resistance, or, as we think of it, an accumulation zone.
We are seeing a good buyside opportunity to form here where we have set 2 entries for us, either a bounce from the lower buy area, which would be ideal if we form there MSB, or a break of structure on upper zones (near the current market price).
Swallow Academy
