link is in bullish rectangle pattern.link is in bullish rectangle pattern, it could complete its continuation pattern after breakout at 19.291, sl could be 18.408 and tp 20.175
LINKUSDT trade ideas

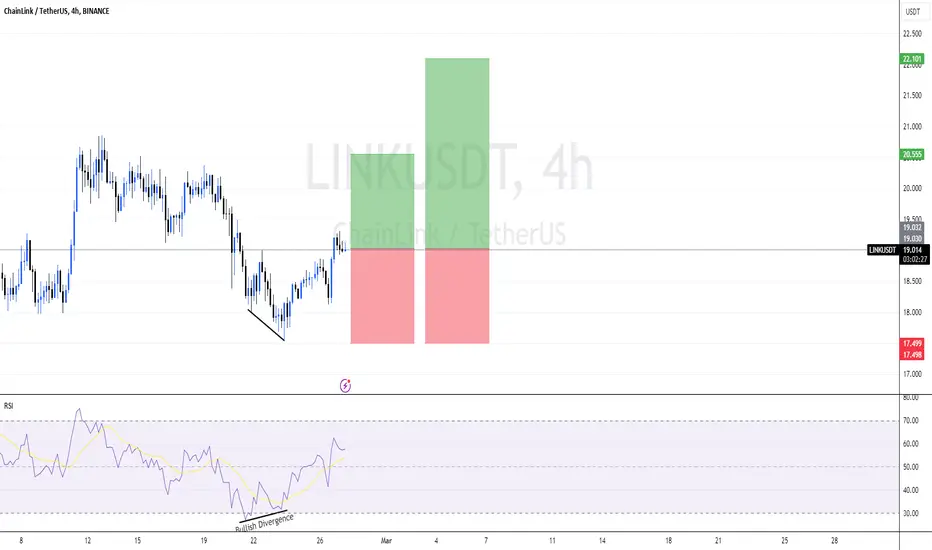
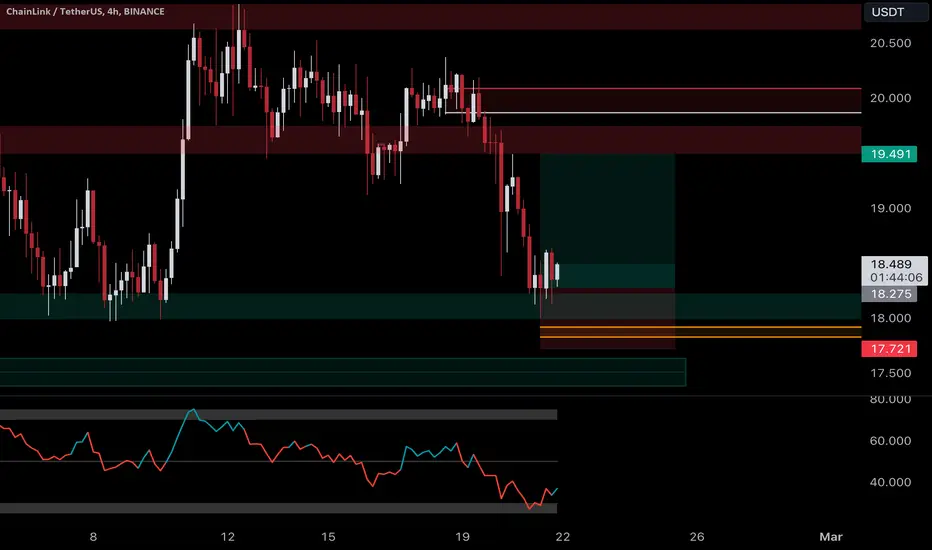
LINKUSDT - BULLISH OUTLOOKLINKUSDT is currently exhibiting a bullish divergence on the 4-hour (4H) timeframe, signaling a potential reversal in the prevailing downtrend. Additionally, the price has broken its lower high and formed a higher high, further supporting the bullish outlook.
Based on this analysis, a trading plan can be formulated as follows:
Entry: Consider entering a long position at the current market price of $19.03 to capitalize on the anticipated bullish reversal.
Stop Loss (SL): Place a stop loss order at $17.49 to manage risk and limit potential losses in case of adverse price movements.
Take Profit (TP): Set take-profit levels to achieve a 1:1 and 1:2 risk-reward ratio:
TP1: Set the first take-profit level at $20.57
TP2: Aim for the second take-profit level at $22.11
This trading strategy anticipates a bullish reversal based on the observed bullish divergence and the breakout above the lower high level. However, as with any trading strategy, it's essential to monitor the market closely and adjust the plan according to evolving price action.
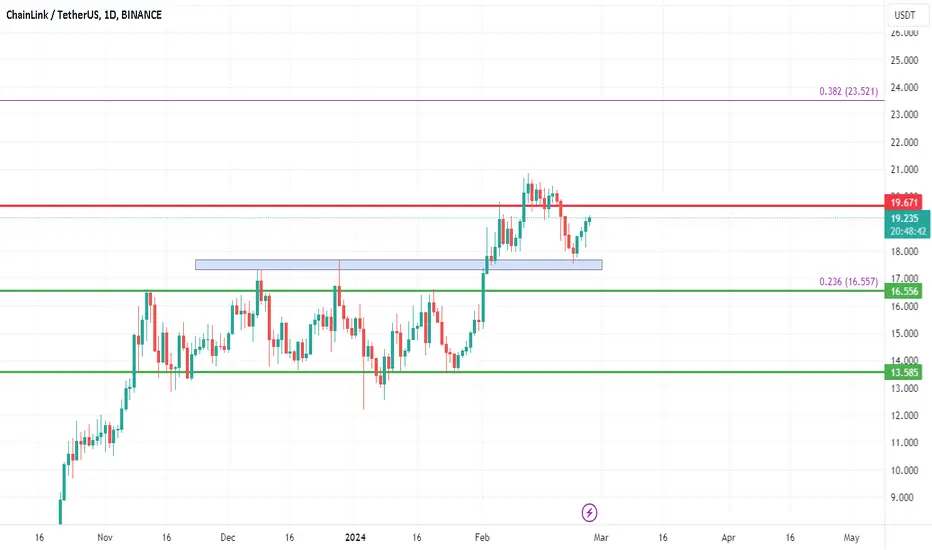
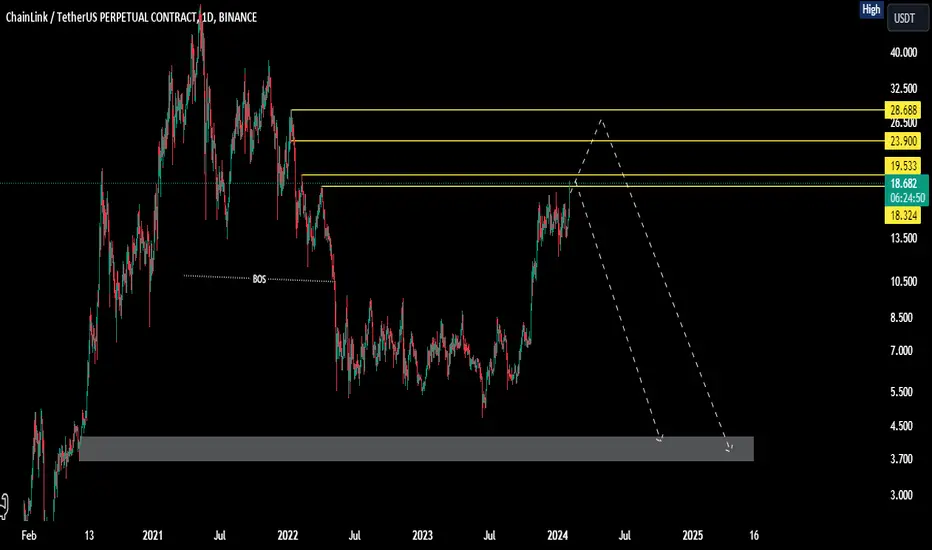
Link/USDT Bullishthe chart shows Link weekly (red) and daily (green) support and resistance levels along with fib. on the daily time frame, Link has boken a resistance level (blue area) and retested successfuly broken the red resistance level will take link to the following targets:
T1: 23.5
T2: 29:1
T3:34.7
the fib levels were drawn from link ATH March 21
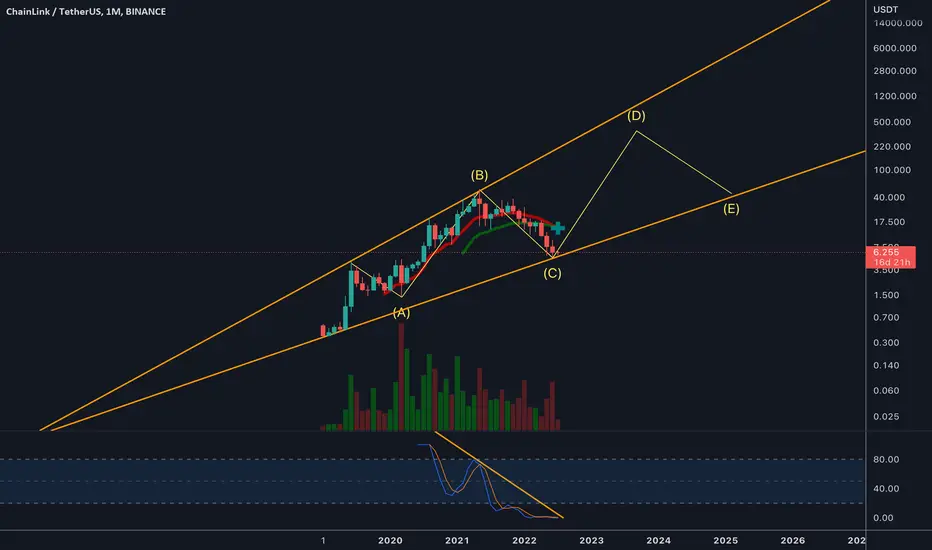
Link on the path, rough road though. If you find this information inspiring/helpful, please consider a boost and follow! Any questions or comments, please leave a comment!
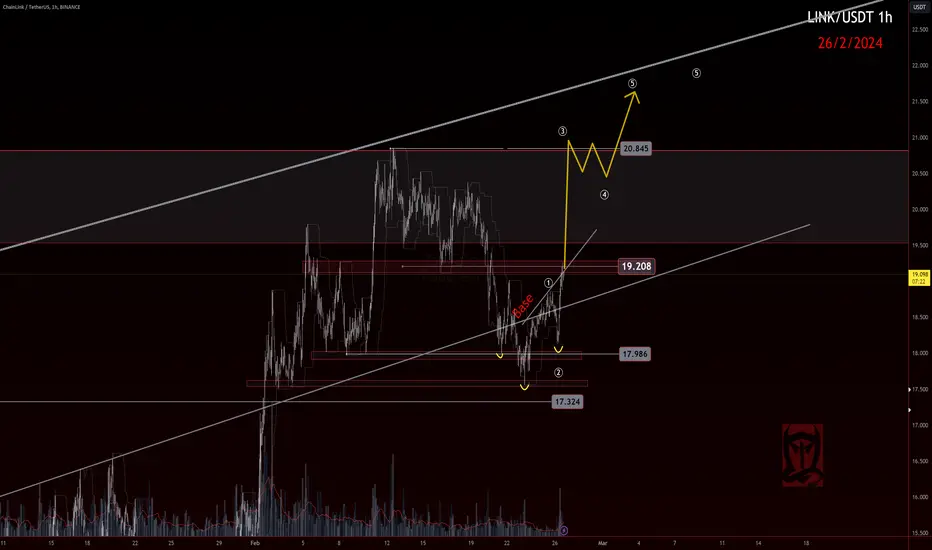
BIST:LINK update 🧵
Followed the original path from the first rejection.
And been tracking pretty good recently.
Held above
17.986 and bounced out of algo land.
Not there yet, a blast or flip through
19.208 is ideal here.

What if you are too horny about LINK?I'm not shorting it but I see too much eyes on LINK.
Would be a shame if a big speculator is distributing it to you.

Chainlink going for $30?●ChainLink has a weekly FVG:
•FVG high 17.806
•C.E at 16.897.
•FVG low 15.974.
●In case of a dump I will be buying Chainlink at these 3 specific levels & upper targets will be $25.620 & $28.710.
●To run up ChainLink has to hold the Weekly FVG for bullish continuation.

Chain link Long positionThe resistance zone has been broken and it has the potential to continue its uptrend. My first take profit would be at the yellow line, and the second at the $28 resistance zone.

Link 💡 Link rejects from the support level. It may bounce from here. If things go south, I have set my stop loss below the swing low.

LINK/USDT Looking BullishTRADE ALERT!LINK
Ticker: LINK/USDT
Entry: 17.5$ - 18.45$
Take Profit: 21-23$
Stop Loss: 16$
Risk to reward: 1:2
Technical Thesis: Link breaked the support of one day also took the retest and start pumping, we can expect a good Movement toward a the Next support

LINKUSDT.Psmart money concept analysis: Don't get caught in whale traps.
What do you think of this idea? What is your opinion? Share it in the comments📄🖌
If you like the idea, please give it a like. This is the best "Thank you!" for the author
ChainlinkIf you found this analysis helpful or support my work, consider making a donation via Binance Pay: 57841095
Thank you for your support! 🙏💰
#LinkIt is moving in an ascending corner pattern, which can retest the red box area again if it maintains the range support.

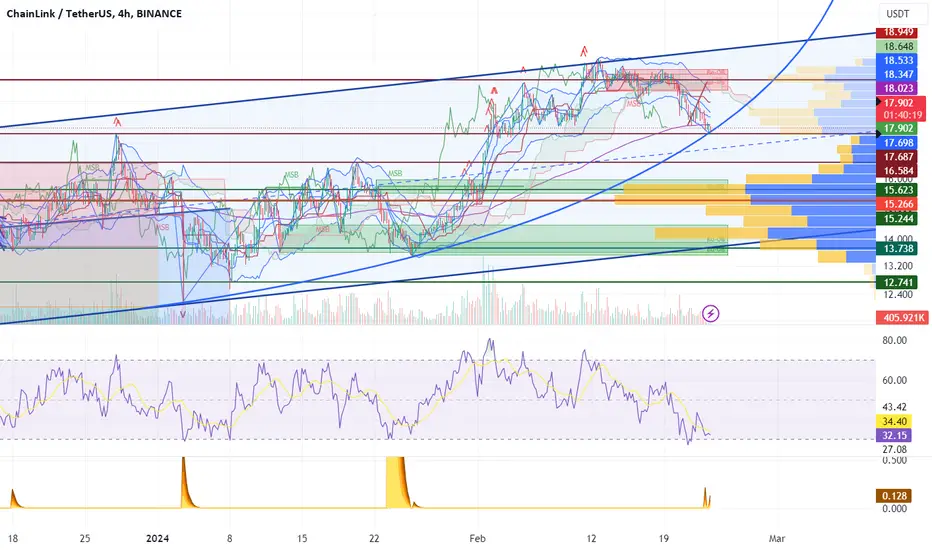
LINK up from here?In some respects LINK looks like it is heading down from the top of the channel and there are a lot of predictions for a correction. Initially I thought so too but now I'm not so sure. BTC is holding well at the top of its channel and could be consolidating for another move up, but even if it holds its current level that would work for an increase in alts. LINK is at support, has bullish divergences on the RSI on the 4h, 1h and 15m charts, and shows buying spikes on all of those timeframes. There has also been significant whale accumulation at this level. I think the ETFs have really changed the market and it just doesn't make sense to me that we have a further big correction from here. There was a bearish divergence at the top but there are short term bearish divergences all the way up every major bull run. I think this may now go up again, after the halving maybe a bit more of a correction until October/November time.
Just an idea, not investment advice.
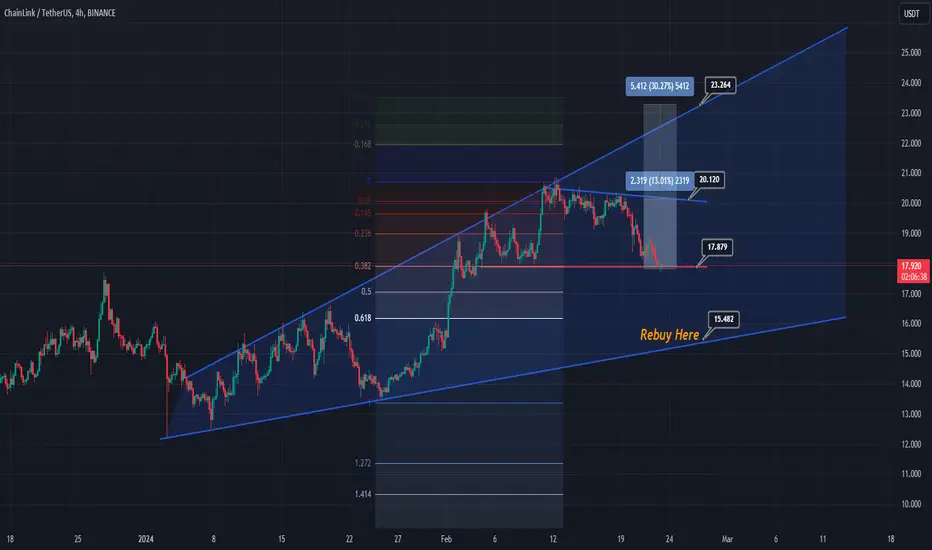
ChainLink 30% profit projectionChainLink reach support level inside expanding channel up. This support also fibonacci .382
we can follow bullish wave from this level and aim for 30% profit projection at expanding channel up resistance. If this support broken, we can rebuy (martingale) at 15.482
Trading setup :
Buy now at around 17.879
Take profit 1 : 20.120
Take profit 2 : 23.264
Martingale :
Re-buy at 15.482
Good luck,
I will update more if I found new key level.
Make sure you support this analysis to get quick notification of any update.