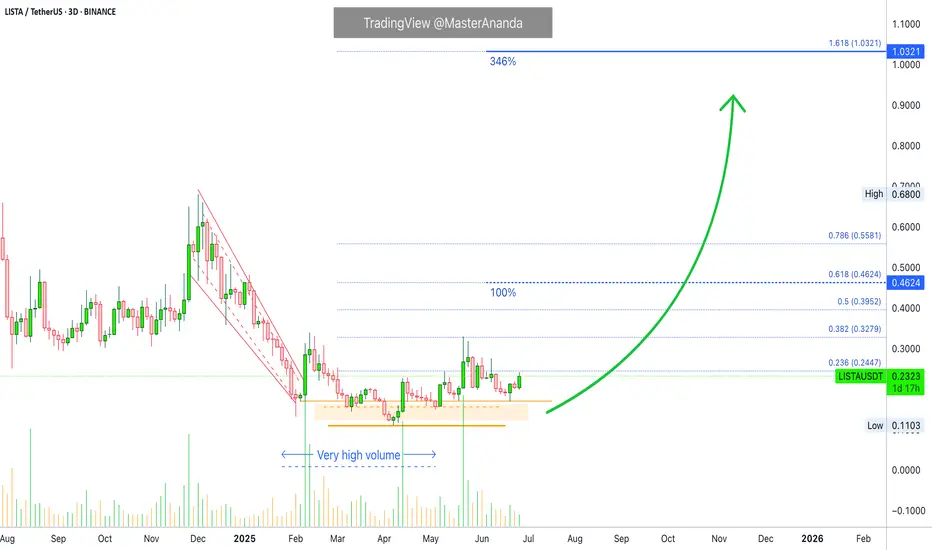
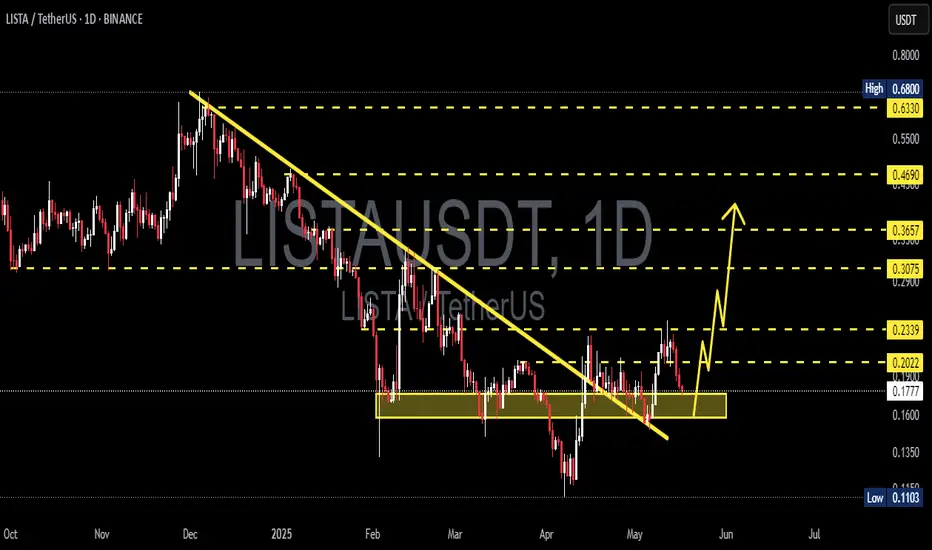
Lista DAO: 100% & 346% TargetsAnother interesting chart here, the candles might seen small but LISTAUSDT produced more than 200% between April and May, and it is ready to move again.
The action is happening now as a strong higher low and buy-volume has been really hiiiiigh lately going up, up, up. This type of chart supports a
#LISTA/USDT#LISTA
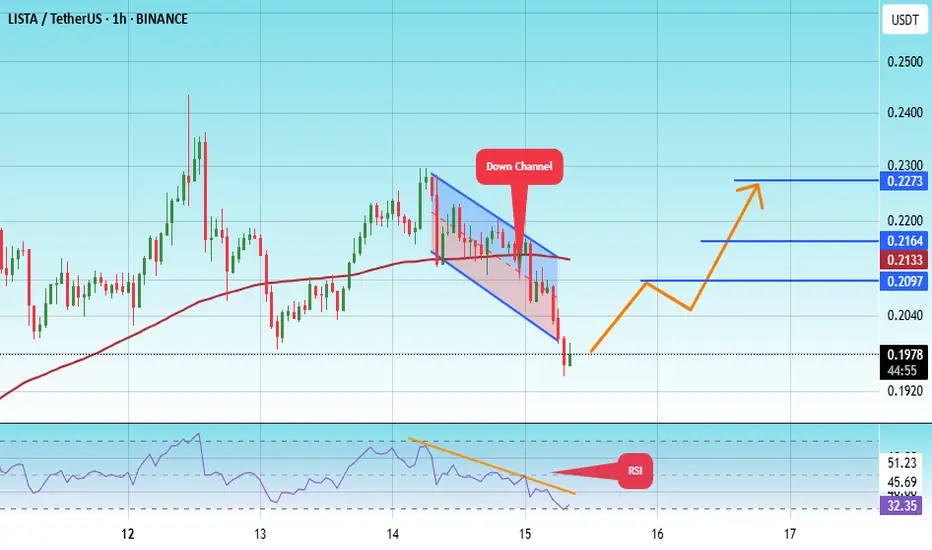
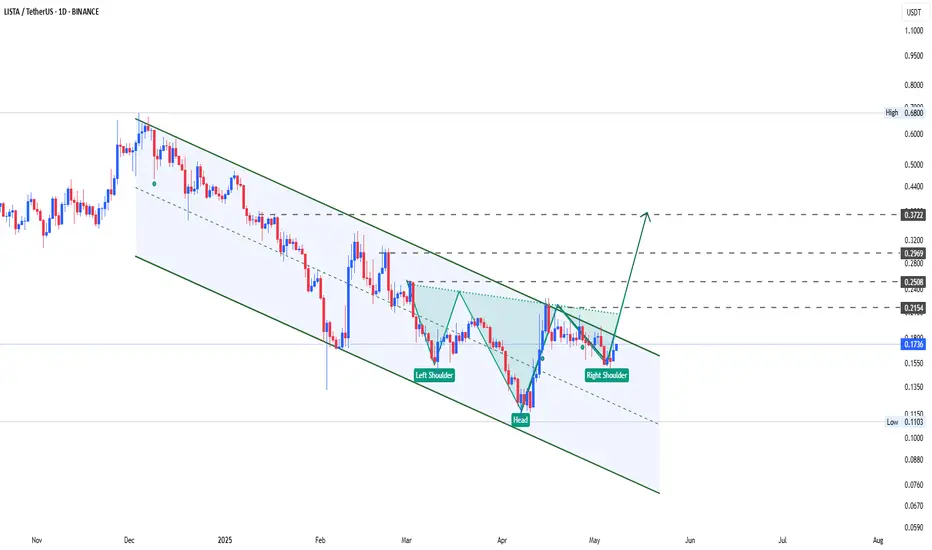
The price is moving within a descending channel on the 1-hour frame, adhering well to it, and is heading for a strong breakout and retest.
We are seeing a bounce from the lower boundary of the descending channel, which is support at 0.1970.
We have a downtrend on the RSI indicator that is a
LISTAUSDT Forming Falling WedgeLISTAUSDT is setting up a promising technical scenario with its clear falling wedge pattern, a structure known for signaling bullish reversals after a period of consolidation. The wedge is narrowing nicely, suggesting that selling momentum is weakening while buying pressure is starting to build. Wit
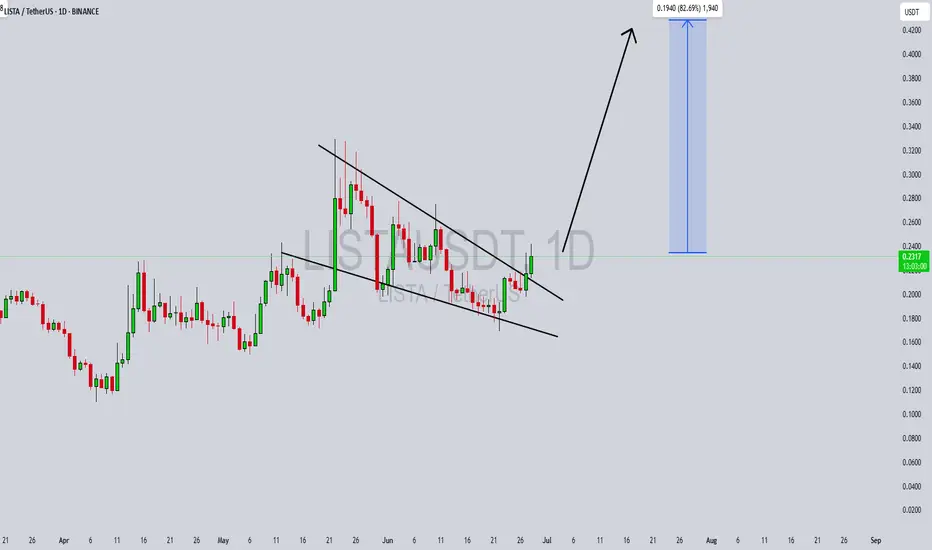
LISTAUSDT 1D#LISTA — Breakout Brewing? ⏳
#LISTA is currently trading inside a symmetrical triangle on the daily chart — a potential consolidation before a move.
🟢 Buy zone: Near the support level at $0.2177 and the daily EMA100
A bounce from this level could lead to a strong bullish breakout.
If a breakout o

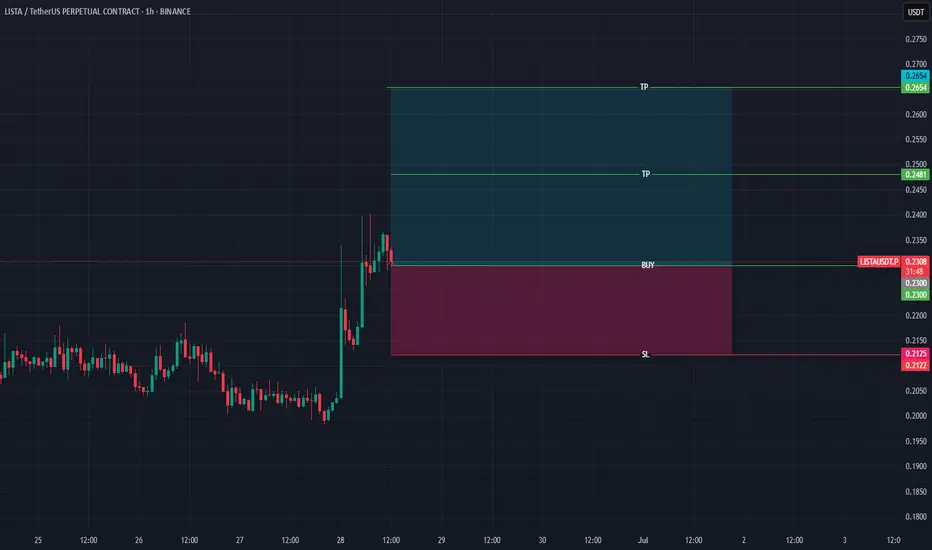
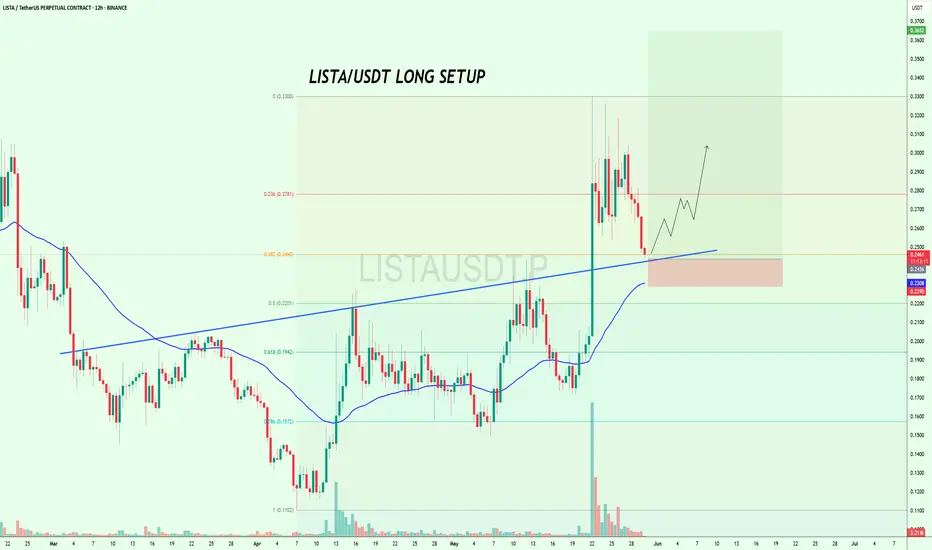
$LISTA at Key Support – Long Opportunity Loading?$LISTA looks good to long here with a short SL🚀
It is approaching a key confluence support zone right at the 0.382 Fib level (~0.2460), the rising trendline, and the 100EMA on the 12H chart.
This level held well in the last move and could once again act as the launchpad for a bullish breakout towa
LISTA – Long Position IdeaThis setup is based on my Fibbo Time Levels strategy, showing a bullish signal aligned with a key time-based reversal point. Market structure and timing suggest a potential upward move.
📌 Timeframe: 15M
🎯 Target & SL: Marked on chart
⏳ Confidence: Confirmed by Fibbo timing alignment
Watch for follo

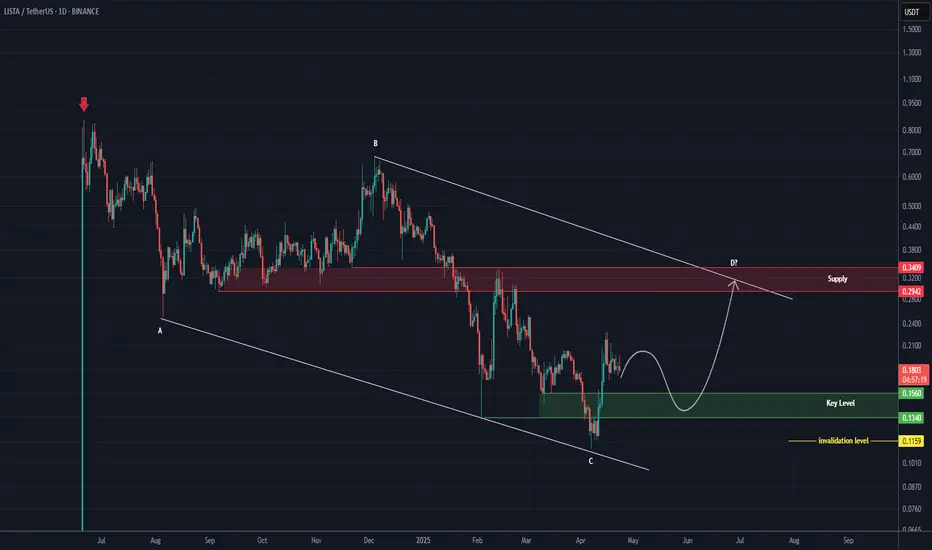
LISTA Looks Bullish (1D)It appears that wave C of a complex correction has completed. The price has reclaimed key levels and consolidated above them.
Also, if you look closely at the chart, you can spot a bullish Quasimodo (QM) pattern forming.
The price is expected to move from the green zones toward the red zones.
A d
LISTAUSDT 1D AnalysisLISTA ~ 1D Analysis
#LISTA Buy gradually from here if you still have confidence in this coin with a short term target of at least 10%++ from here
LISTA potential gain 10-50%Buy gradually from here or wait for breaking through this resistance line with a short-term target of at least 10%+.
See all ideas
Summarizing what the indicators are suggesting.
Oscillators
Neutral
SellBuy
Strong sellStrong buy
Strong sellSellNeutralBuyStrong buy
Oscillators
Neutral
SellBuy
Strong sellStrong buy
Strong sellSellNeutralBuyStrong buy
Summary
Neutral
SellBuy
Strong sellStrong buy
Strong sellSellNeutralBuyStrong buy
Summary
Neutral
SellBuy
Strong sellStrong buy
Strong sellSellNeutralBuyStrong buy
Summary
Neutral
SellBuy
Strong sellStrong buy
Strong sellSellNeutralBuyStrong buy
Moving Averages
Neutral
SellBuy
Strong sellStrong buy
Strong sellSellNeutralBuyStrong buy
Moving Averages
Neutral
SellBuy
Strong sellStrong buy
Strong sellSellNeutralBuyStrong buy
Displays a symbol's price movements over previous years to identify recurring trends.