LPTU is CHARGED!! $30?LPTU as addressed on my previous analysis ditto happened, Hiragagna on the make! Yellow Boxes is the STOPS ideal buys go now ( Though little bit more down can be done) and look for the big trades. SUCH Big candles much wow!
LPTUSDT.P trade ideas
LPTU is done? What's nExt? 50$?Ive mentioned LPTU alot of times and did mark my words a lot. Upon finding I've seen its on the verge of a formation of triple tops, As shown below on the 12H chart below
and the below is contrasting squeezed LPTU 4HR charts to get a good contrast where to initiate it.
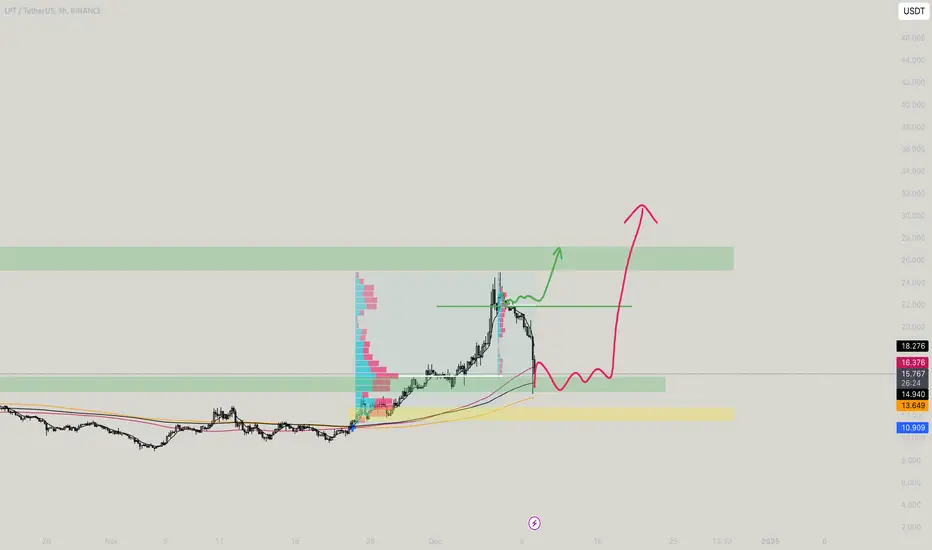
For FOMO people, Small shorts can be taken from CMP, with slowly maximising it to all on the green box at 27 dollars, High chances are there small shorts, can be closed when reaches the green line, So if u are taking shorts here, book on the green line to again buy it from it. Once it breaks, 15.583 is evident!
So what you need to do? - Short now to green line and again after moving or showing actions of reversal book it and initiate final shorts from the top!
TradeCityPro | LPT : Testing Key Levels with Bullish Momentum👋 Welcome to TradeCityPro!
In this analysis, I’m going to review the LPT coin, one of the projects in AI and Media. The analysis will cover both weekly and daily timeframes.
📅 Weekly Timeframe: Engaging with a Key Resistance
In the weekly timeframe, after breaking 9.415 and reaching the resistance at 22.569, the price entered a range between these two levels. Currently, it has reached the resistance at 22.569 for the third time. Significant buying volume has entered the market, and considering Bitcoin’s bullish momentum and the correlation between altcoins and Bitcoin, the probability of breaking this level is high.
📈 If this level is broken, the next resistances will be 31.516 and 63.738. Breaking 63.738 could likely lead to a new ATH.
✨ In the case of a correction, the most critical factor is the 41.57 level on the RSI, which should not be lost. As long as the RSI remains above this level, the market momentum is seen as bullish.
🔽 The key price level for a potential correction is 9.415. If this support is broken, the next levels are 5.451 and 3.787.
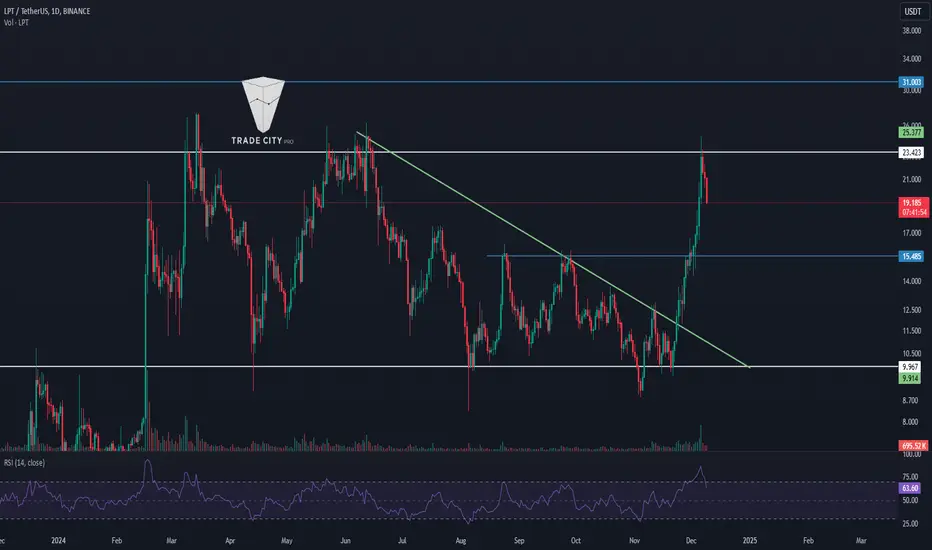
📅 Daily Timeframe: Decreasing Bullish Momentum
On the daily timeframe, after breaking the ascending trendline near the bottom of the range, the price managed to move toward the top of the box without any significant correction. However, with the RSI returning below 70, the bullish momentum has decreased.
📉 In the event of a correction, the first support level in this timeframe is 15.485. If this level is broken, the next support is the bottom of the box at 9.967.
🔼 If the price breaks through 23.423, the next resistance will be 31.003, which the price could reach upon a successful breakout.
📝 Final Thoughts
This analysis reflects our opinions and is not financial advice.
Share your thoughts in the comments, and don’t forget to share this analysis with your friends! ❤️
LPTUSDT: Critical Levels to Watch – Will Bulls Defend the Line?Yello, Paradisers! Are you prepared for the critical moves ahead on #LPTUSDT? This setup is heating up, and the next few days could define the trend’s future. Let’s dive in.
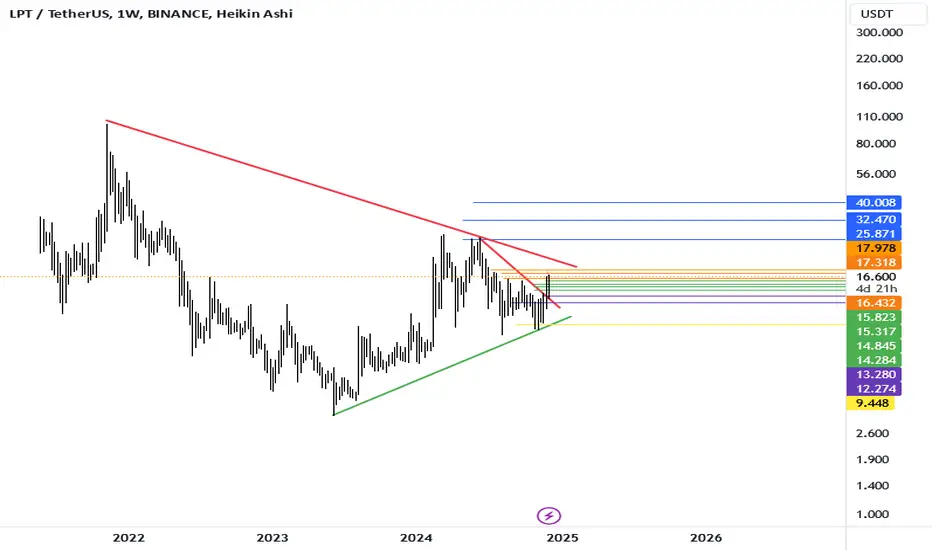
💎#LPT is eyeing a retest of the $17.7 - $16.4 support zone. If this area holds, we could see buyers stepping in to fuel a bullish continuation, potentially targeting the major resistance zone. This would align with the broader bullish trend we’ve been tracking.
💎But here’s where it gets tricky. Things could turn ugly if LPT fails to rebound at this support and breaks below it. The price could spiral down toward the $13.7 - $12.5 demand zone. From here, bulls must make a stand and reclaim the lost support to keep the bullish scenario alive.
💎If the daily candle closes below the demand zone, it will confirm a bearish breakdown, with the potential for an even deeper dip.
Stay focused and wait for clear signals before making your move. This is how you ensure long-term profitability.
MyCryptoParadise
iFeel the success🌴

$Lptusdt 2x long term tradingHi everyone,
Please take a look the chart carefully. There are short and long term trading opportunities combined. Also you can use arrow on the chart for long and short positions.
At the end of day minimum 100% profit guaranty. Simply follow black arrow for all positions
enjoy
** Please show your support if you like to see more idea from me. LIKE 👍, FOLLOW ✅, SHARE 🙌 and COMMENT ✍ if you enjoy this idea! Also share your ideas and charts in the comments section below! This is best way to keep it relevant, support me, keep the content here free and allow the idea to reach as many people as possible. **
#trading #BTC #bitcoin #coin #scalping #crypto

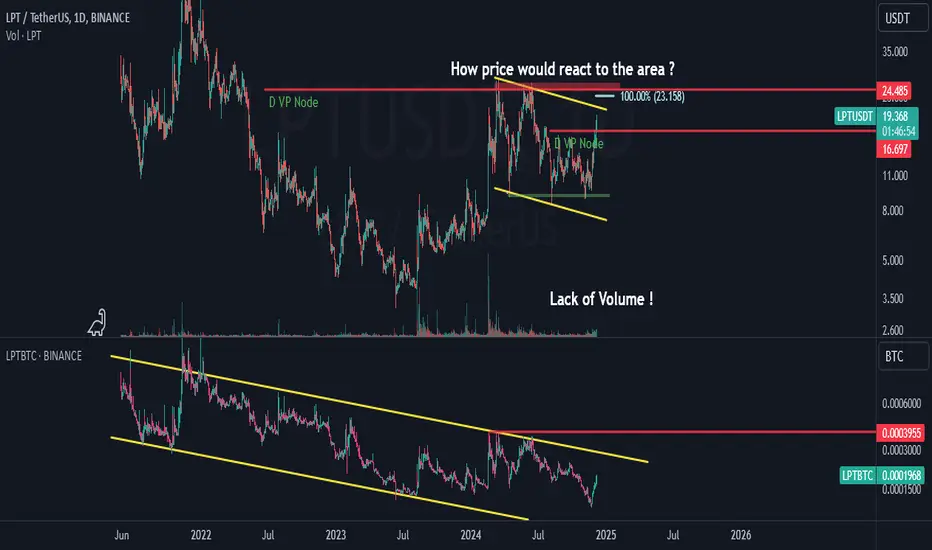
LPT USDTI'm in position but it's important for me how price would react to the resistant area.
When people will long LPT-BTC is also important.
lptIn the orange lines, we have a resistance zone, at lower points, check for buying, if the resistance is broken, it can go to higher points.
Livepeer Rising Channel (Targets Up To 370% Included)I think we can appreciate here a switch from a bearish bias to a bullish bias. The switch happened around June 2023, when the bottom was hit.
We went from a descending channel to a sideways channel with bearish tendencies. From the sideways channel the pair transitioned to an ascending channel (bullish wave).
This week we have the classic volume breakout pattern. The highest volume bar on a weekly basis since May 2024, and this in a sequence of strong and sustained higher lows.
It is easy to assume that this pair is going up, because we have a pattern of higher highs and higher lows.
Will this pair continue to grow? We will see, but we have something already when we look at LPTBTC (see 'Related publications' below).
Thank you for reading.
Namaste.

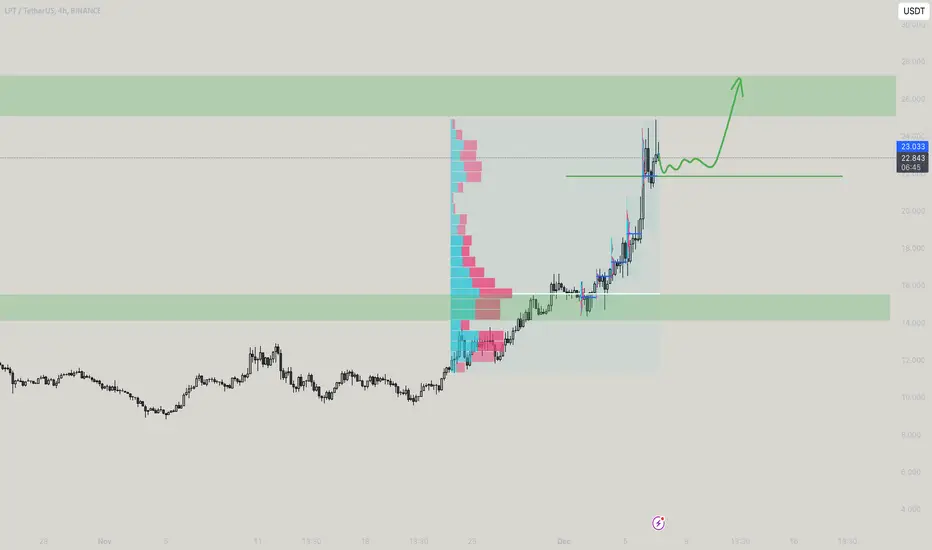
LPTUSDT | Buy Now, Thank Later | Near Term (4HR)LPTUSDT | Buy Now, Thank Later | Near Term (4HR)
I think another impulse is inbound.
BTCUSDT | Alts Poised to Explode | Near Term (2H)
MYRIAUSDT | Interested to see where this goes | Mid Term (2D)
Mock Up Price Action for VRA w/ Timeline | Mid Term (3D)
Mock Up Price Action for XCH | Mid Term (12HR)
OGNUSDT | Interested to see where this goes | Mid Term (3D)
Mock Up Price Action for CSPRUSDT | Near/Mid Term (2D)
VIDTUSDT | Interested to see where this goes | Mid Term (3D)
RAREUSDT | Interested to see where this goes | Mid Term (3D)
Mock Up Price Action for ALGOUSDT | Mid Term (12HR)

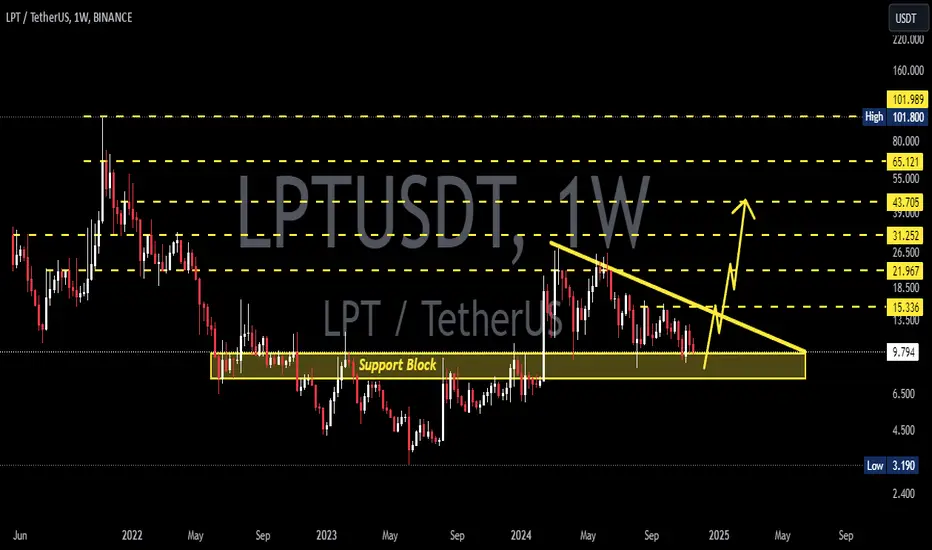
LPTUSDT 1WLPT ~ 1W
#LPT Do you still have Conviction on this coin? If yes,. This support block would be a good buy spot for now. buy in stages, Target 20%+
LPTUSDT weekly falling wedge HOLD BUYYYBINANCE:LPTUSDT weekly chart doing falling wedge. Very nice for 5x margin holding.
Cheap stop loss.

#LPT/USDT breaks the Diagonal Trendline in 1-Hour TF!#LPT/USDT breaks the Diagonal Trendline in 1-Hour TF!
Wait for a successful retest to long $LPT. The local resistance level is PWH $12.71 and the support level is PML $10.11.

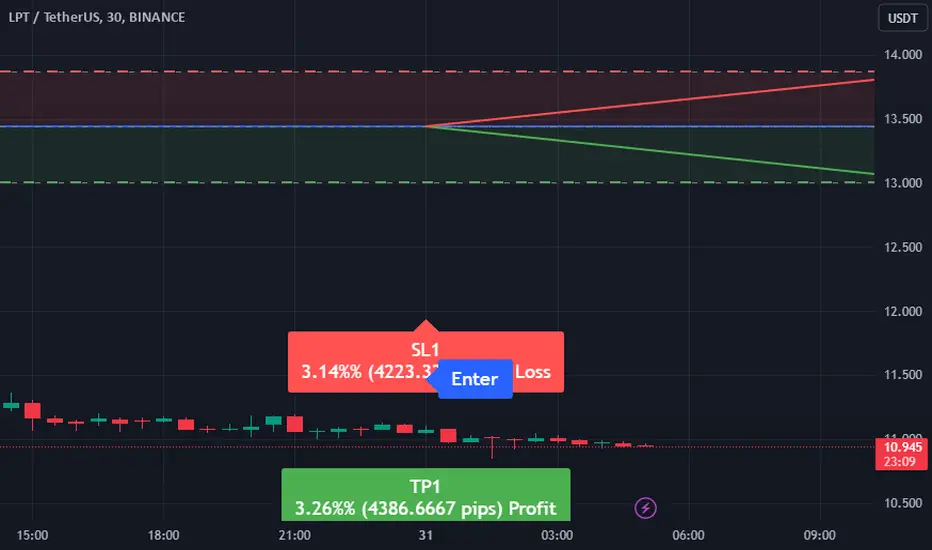
LPTUSDT Forex Trading SignalDirection: Sell
Enter Price: 13.445
Take Profit: 13.00633333
Stop Loss: 13.86733333
We have detected a potential downward movement for the LPTUSDT currency pair using the EASY Quantum Ai strategy. The strategy analyzes multiple market indicators and historical data to forecast market trends and suggests an optimal moment to enter the trade.
Justification:
1. Market Momentum: Recent analysis shows a weakening momentum in the upward direction, reflecting potential for bearish movement.
2. Resistance Levels: LPTUSDT has shown consistent resistance near the current price level, indicating a challenge in surpassing this threshold.
3. Volume Analysis: There has been a noticeable decrease in buying volume, further supporting the indication of bearish sentiments among traders.
4. Trend Analysis: The assessment reveals a downtrend in short-term moving averages crossing below the longer-term averages, which is often a sell signal.
Monitoring these factors suggests that selling at the Enter Price of 13.445 may yield profitable results if the market continues this projected direction. Please ensure to manage your risk with the specified Stop Loss and Take Profit levels.
LPT 8H Update
After a 50% pullback for green X, the blue WXY correction should target the 100% extension of the green WX leg.
This would lead to a test of 8.970, which also matches a support zone from August low.
The lack of RSI divergence also supports this scenario.
Invalidation is above 13.700 (pink level in chart).

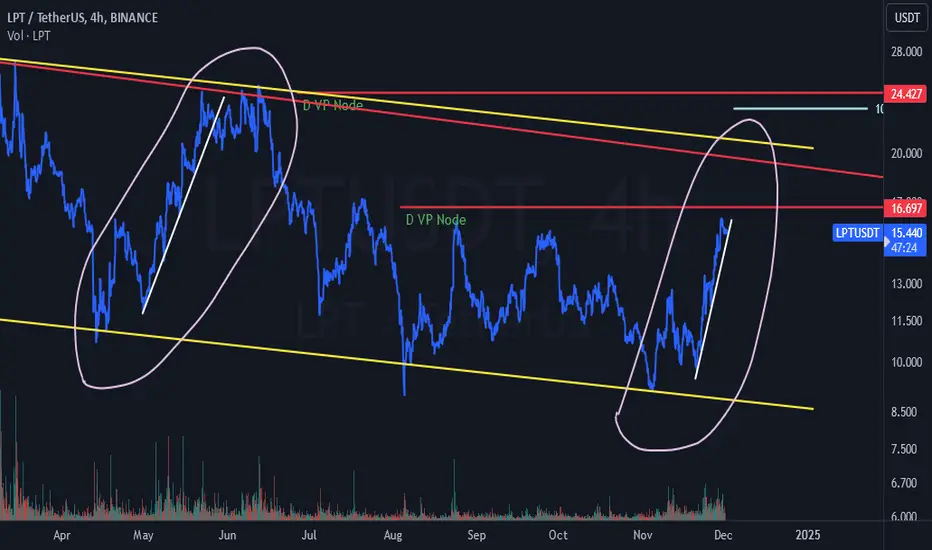
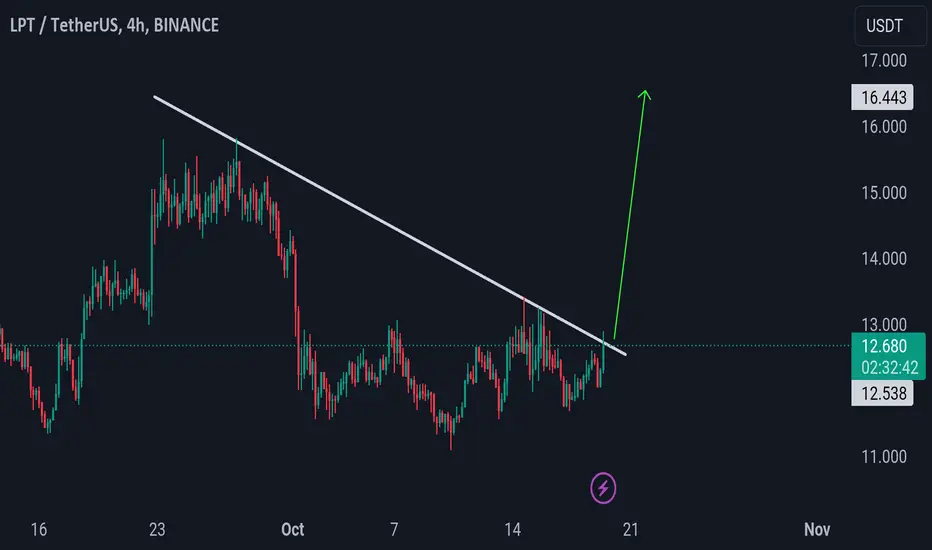
LPT/USDT on the Verge of a Breakout LPT/USDT on the Verge of a Breakout 🚀
LPT/USDT is currently attempting a breakout on the 4-hour time frame. If this breakout is successful and followed by a retest, we could see a strong bullish move ahead. 📈 The price action is showing signs of momentum, but it's crucial to monitor key levels for confirmation.
Keep an eye on this pair, as a sustained breakout could lead to a solid upward trend. However, always remember this is not financial advice – do your own research (DYOR) before making any decisions! 🔍📊
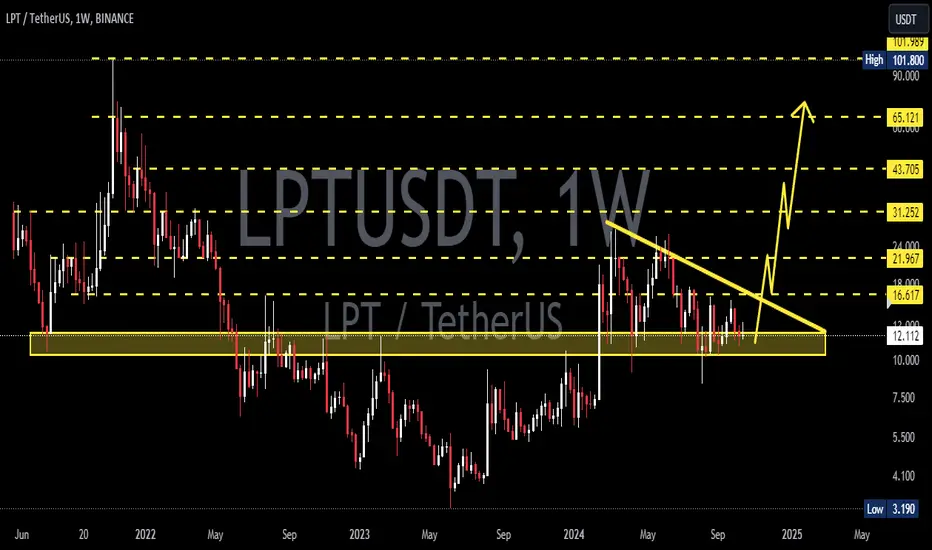
LPTUSDTLPT ~ 1W
#LPT This support block for now continues to keep the price from falling any further. Maybe a small purchase here is quite interesting.
LPT long termLPT looks very good if previous lows hold. Keep in mind that FUD can break down any support right now. But as we know from the history, this is just the game. Be ready, stay focused. If you need help, let me know.
MANAGE YOUR RISK AND USE STOPLOSS IN EVERY TRADE
NOT A FINANCIAL ADVICE
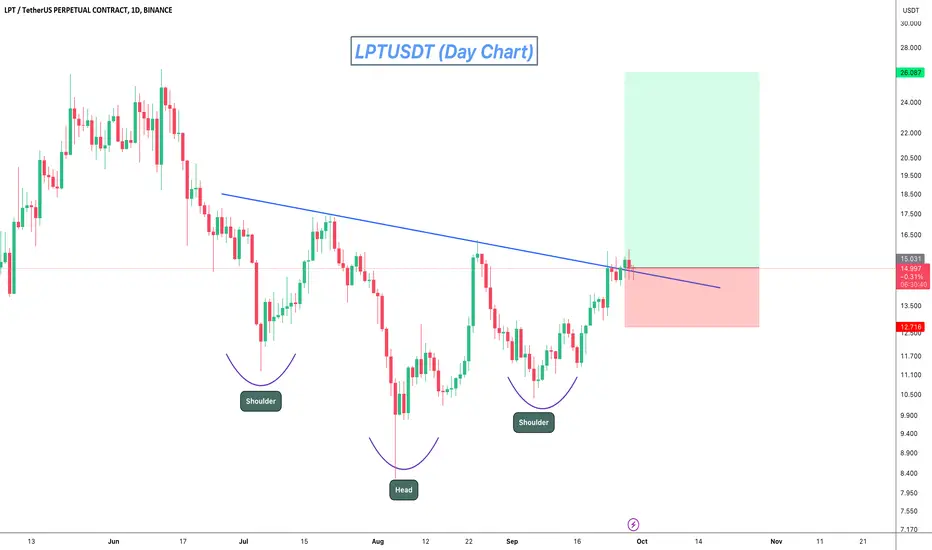
LPTUSDT Inverse Head and Shoulder Pattern!LPTUSDT technical analysis update
LPT's price is breaking the inverse head and shoulders neckline resistance and is trading above both the 100 and 200 EMA on the daily chart. A gradual bullish move can be expected in the coming days.
Resistance 1: $17.35
Resistance 2: $20.00
Resistance 3: $26.00
Support: $12.50
Regards
Hexa
LPT ANALYSIS🔮 #LPT Analysis 💰💰
🌟🚀 As we can see that #LPT is trading in a symmetrical triangle and given a perfect breakout. But there is an instant resistance. If #LPT breaks the resistance 1 then we will see a good bullish move in few days . 🚀🚀
🔖 Current Price: $14.800
⏳ Target Price: $23.300
#LPT #Cryptocurrency #DYOR

LPTUSDT.PLPTUSDT.P is in bullish trend.
Potentially printing HH and HL.
No sign of reversal here.
Buyers are strongly active.
We wait and watch for the breakout of last HH.
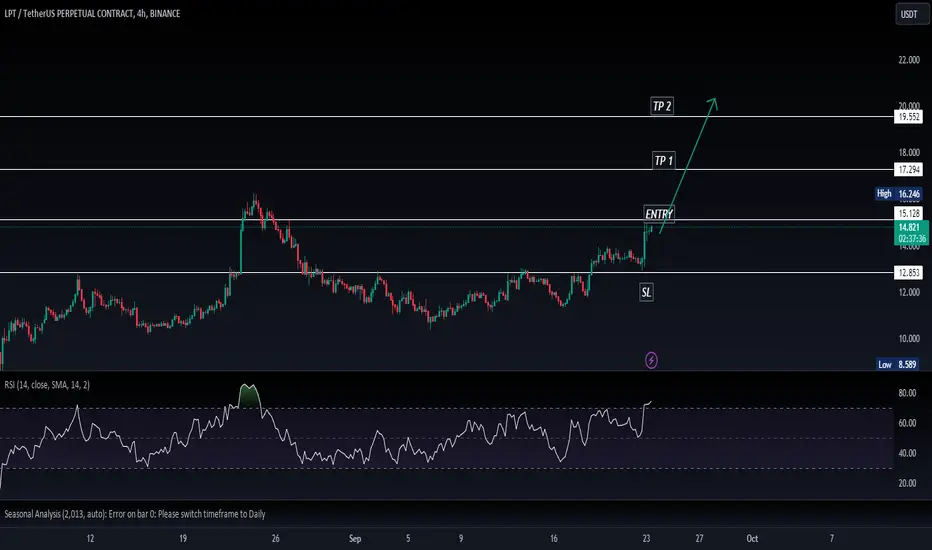
LPT Looks BullishFrom where we placed the red arrow on the chart, it seems that the LPT correction has started.
The correction looks like a triangle that is over.
By maintaining the green range, it can move towards the targets.
The targets are marked on the chart.
Closing a daily candle below the invalidation level will violate the analysis.
For risk management, please don't forget stop loss and capital management
When we reach the first target, save some profit and then change the stop to entry
Comment if you have any questions
Thank You
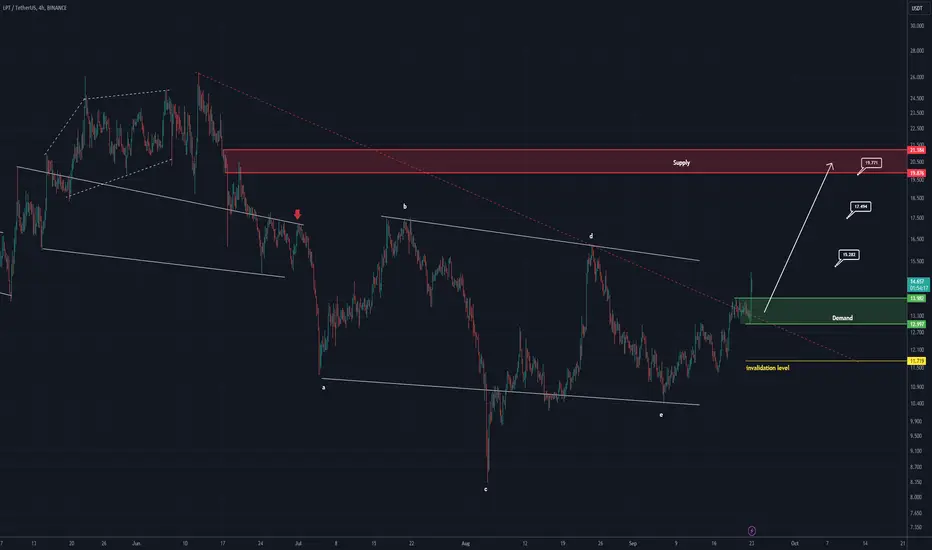
A Bullish Regular FLAT on LPT with a Bearish Running In this analysis of LPT, we identify a prominent Regular Flat pattern, one of the most striking formations currently seen in the market. Within the internal structure of wave C, a bearish Running pattern is evident, signaling potential further downside.
Despite this, I remain cautious and prefer to focus on the larger timeframes rather than the smaller ones. As a result, I am not shorting at this stage but instead waiting for a solid buy setup to emerge.
