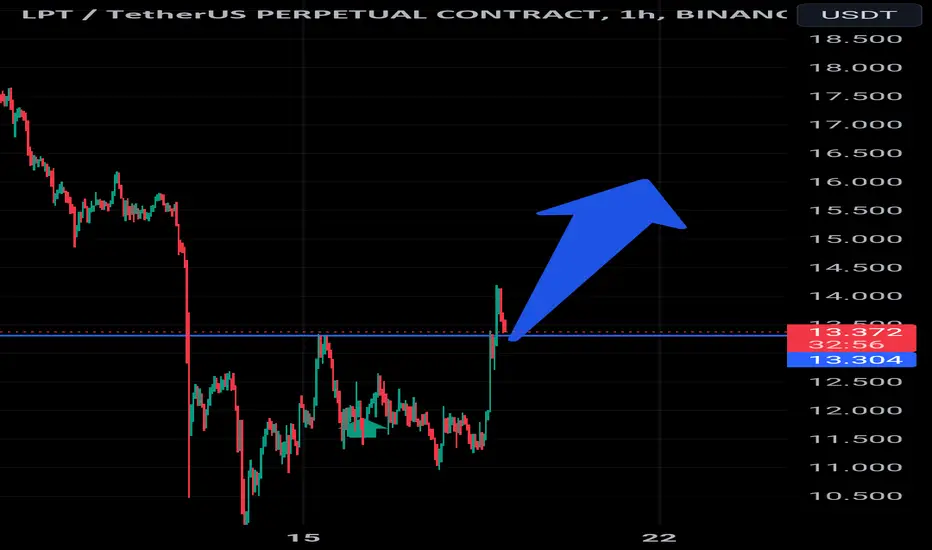
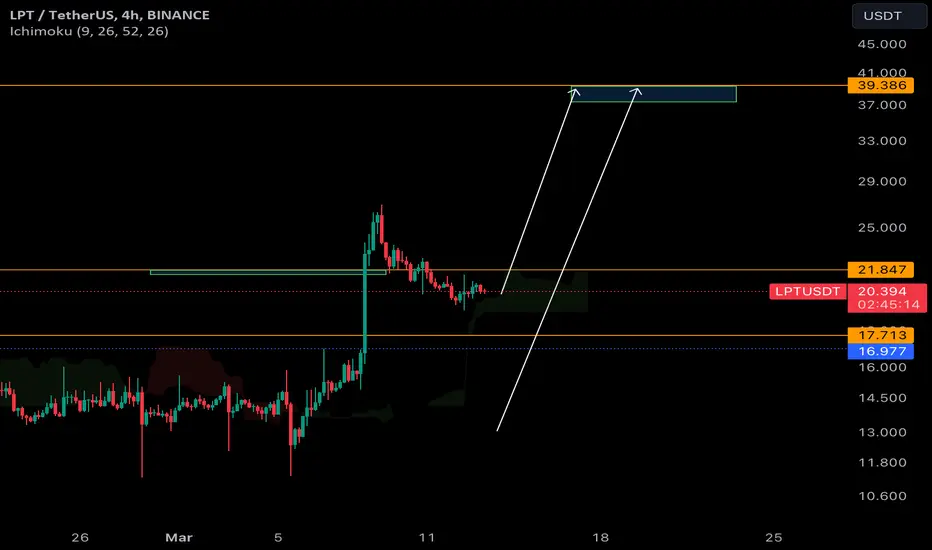
Alikze »» LPT | Pullback to broken structureAccording to the previous analysis that was reviewed in 1H time, after the correction to the support box, the demand was met, and the target touched the ceiling of the channel after the correction.
💎But currently, in 1H time, after hitting the ceiling of the channel, it is being corrected, and this correction can extend to the green box, in case of renewed support, it will face demand and touch the supply range target.
💎 Alternative scenario. If this rapid correction is extended to the green box, it will be possible to break it up to the range of 15.63.
»»»«««»»»«««»»»«««
Please support this idea with a LIKE and COMMENT if you find it useful and Click "Follow" on our profile if you'd like these trade ideas delivered straight to your email in the future.
Thanks for your continued support.
Sincerely.❤️
»»»«««»»»«««»»»«««
LPTUSDT.P trade ideas

#LPT/USDT#LPT
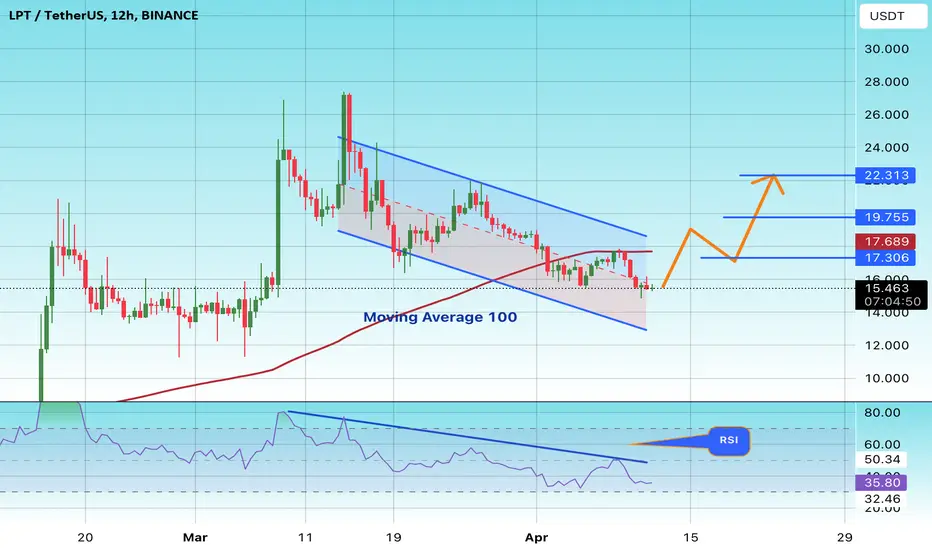
The price is moving in a bearish channel pattern on a 12-hour frame, which it adheres to perfectly. We have stability above the moving average of 100.
We have a downtrend on the RSI indicator that supports the rise and is about to break higher
Entry price is 15.30
First target 17.30
The second goal is 19.75,
the third goal is 22.31
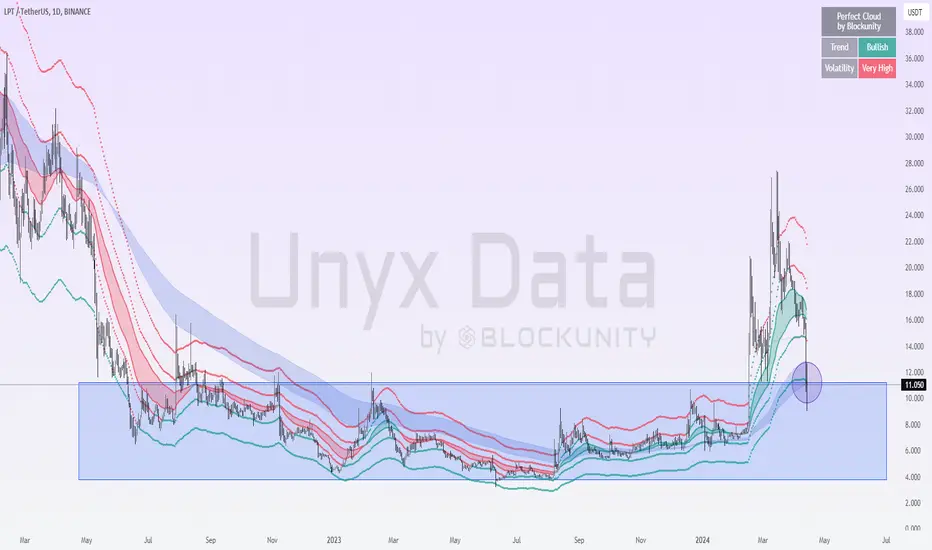
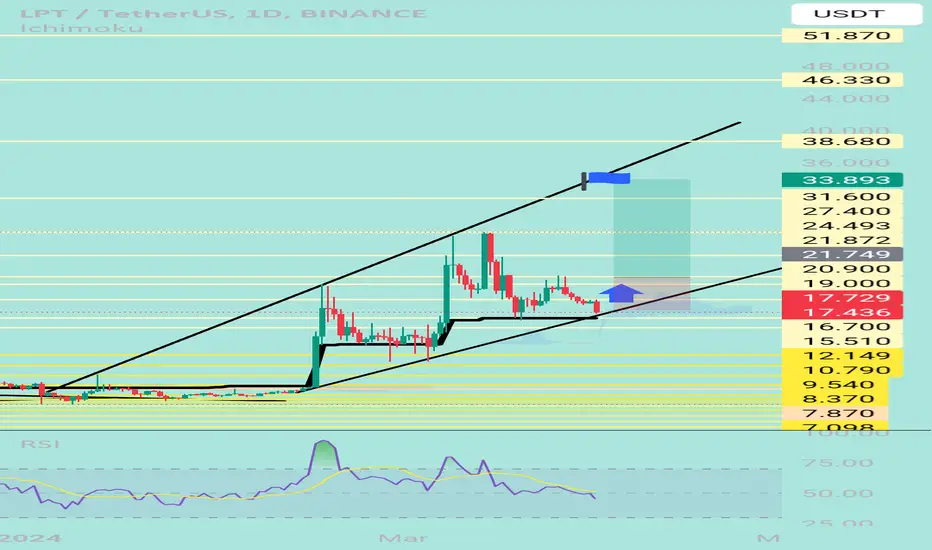
A great opportunity on Livepeer (LPT)?Livepeer BINANCE:LPTUSDT seems to be giving us a great opportunity by retesting the top of its previous accumulation range. The Perfect Cloud (BPC) remains green, indicating that the uptrend is intact for the time being.
This retracement back to this very strong structural level is further reinforced by the Vegas Daily (blue cloud) of the Trend Identifier (BTI) !
Alikze »» LPT | Ready to correct up to the support zoneIn time 1h, it is moving in an ascending channel, which is currently in the specified supply area, and has tried to break the range twice.
According to the structure, it can have a correction up to the green box area.
💎 In addition, if it meets the demand and can break the area, it can continue the route to the roof of the channel.
»»»«««»»»«««»»»«««
Please support this idea with a LIKE and COMMENT if you find it useful and Click "Follow" on our profile if you'd like these trade ideas delivered straight to your email in the future.
Thanks for your continued support.
Sincerely.❤️
»»»«««»»»«««»»»«««

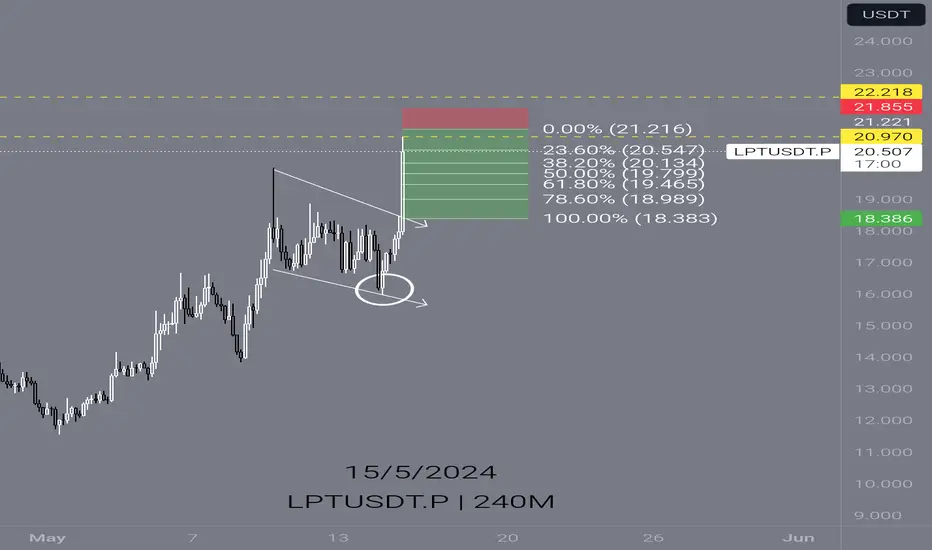
LPTUSDT.PHello Trader BINANCE:LPTUSDT.P
line yellow area 2 hours there is a fairly strong resistance, can be used as a reference for short sell. history area previously there was a falling wedge area. possible area for bounce back for now
entry area 20,970 - 21,216
take profit 15%
stop loss 3%
Please add a comment and Positive feedback and constructive criticism are important to authors and the community.
Disclamer: Not Financial Advice
LPTUSDTmy entry on this trade idea is taken from a point of interest ABOVE an inducement.. I extended my stoploss area to cover for the whole swing as price can target the liquidity there before going as i anticipate.. just a trade idea, not financial advise
5/10 9am BTC BEARBTC just dropped big, currently at support right now,
alts will see this and most will follow.
take a LPT short

LPTUSDT(Livepeer) Daily tf Range Updated till 10-05-24LPTUSDT(Livepeer) Daily timeframe range. tried to get over 20.315 but need more volume for that. getting over 20.315 clean can led to 26.570. thats more possible if it can sustain above 16.212 long enough.

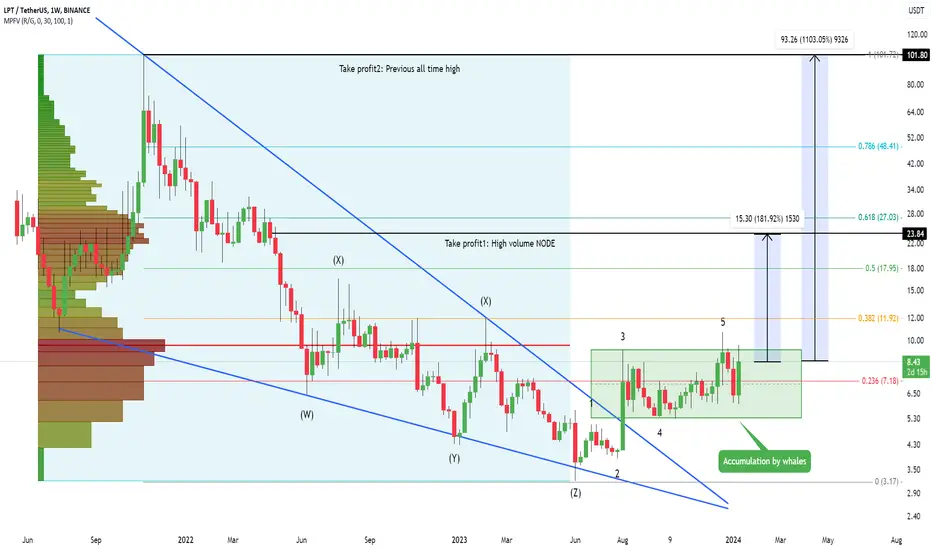
LPT: can 10x in the next few weeks? here is whyLPT looks really good because we have a falling wedge (bullish pattern) on the weekly chart and the price is currently above it. Also, we have an accumulation phase by whales. This is a really strong combo, so I recommend buying this coin. Where to take profit? We have a huge volume node, which you can see on the market profile - this is the first resistance. If the bulls are strong enough,we should see an all-time high pretty quickly. Let me know what you think about my analysis, and please hit boost and follow for more ideas. Thank you, and I wish you successful trades!
Livepeer is a unique project because it aims to revolutionize the broadcasting industry by employing the powers of blockchain technology. The open-source platform allows users and developers to participate in the management and improvement of the platform freely. The growing capabilities of digital cameras for producing high-quality video content drive the development of the broadcasting industry, and Livepeer aims to further boost this process by allowing users to benefit from decentralized computing power and crypto-economic incentives for bootstrapping and participation.
Livepeer is becoming a leading industry platform, as it allows users to participate in numerous ways. The platform offers opportunities for pay-as-you-go content consumption, auto-scaling social video services, uncensorable live journalism, and video-enabled DApps. Livepeer is transforming the live video streaming process and is on the road to becoming an industry leader. Let me know what you think about my analysis, and please hit boost and follow for more ideas. Thank you, and I wish you successful trades!
#LPT/USDT#LPT
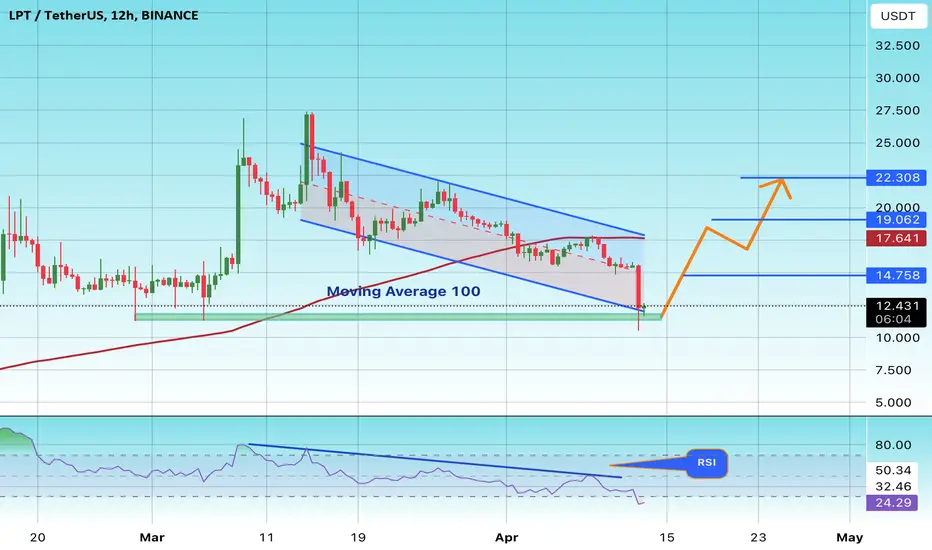
The price is moving in a downward channel on a 12-hour frame, which it adheres to perfectly. We have a major support area at the $11 level. We have a trend for stability above the moving average of 100.
We have a downtrend on the RSI indicator that supports the rise and is about to break higher
Entry price is 12.45
The first goal is 14.75
Second goal 19.06
Third goal 22.30
I Have Told You about LPTUPCOM:LPT
Don't tell me I haven't gave you the bottom 13.00
A simple 18% unleveraged move captured💵
That's it!! That's the post.
#aqeelonline

LPT | LPTUSDT ideaLPT | LPTUSDT idea
there are two stoploss caculated based on trendline + xdBand11 indicator

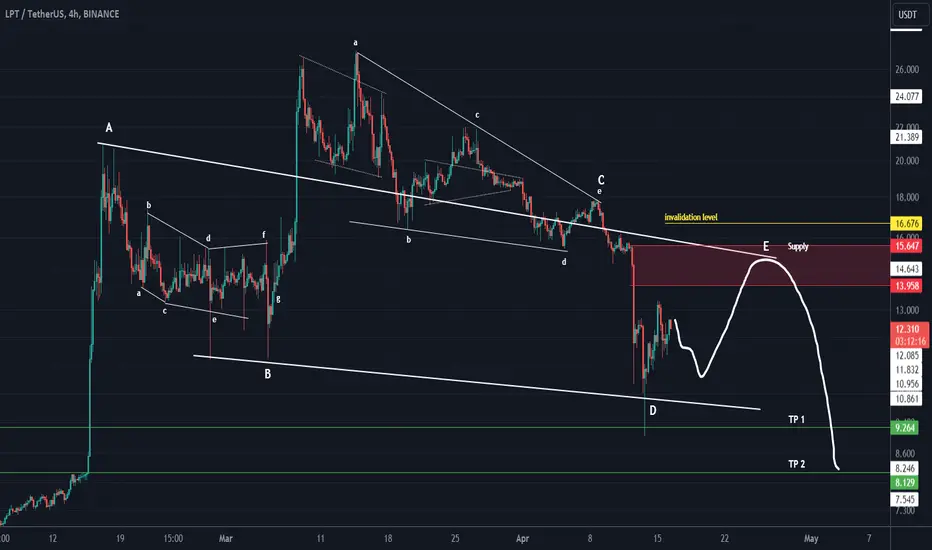
LPT looks bearishLPT seems to be forming a bearish triangle.
It seems to be at the end of wave D.
It is expected to go up a bit for wave E and then drop out of the red range.
The targets are clear on the chart.
If it reaches the red range, we will look for sell/short positions.
Closing 1 daily candle above the invalidation level will violate the analysis
For risk management, please don't forget stop loss and capital management
When we reach the first target, save some profit and then change the stop to entry
Comment if you have any questions
Thank You
LPT Breakout and RetestUPCOM:LPT is now retesting the breakout🚀
Waiting for a 1hr candle close above the breakout then next stop should be 15.50 - 16.50
Sl Below: 12.40
#nfa #dyor #aqeelonline
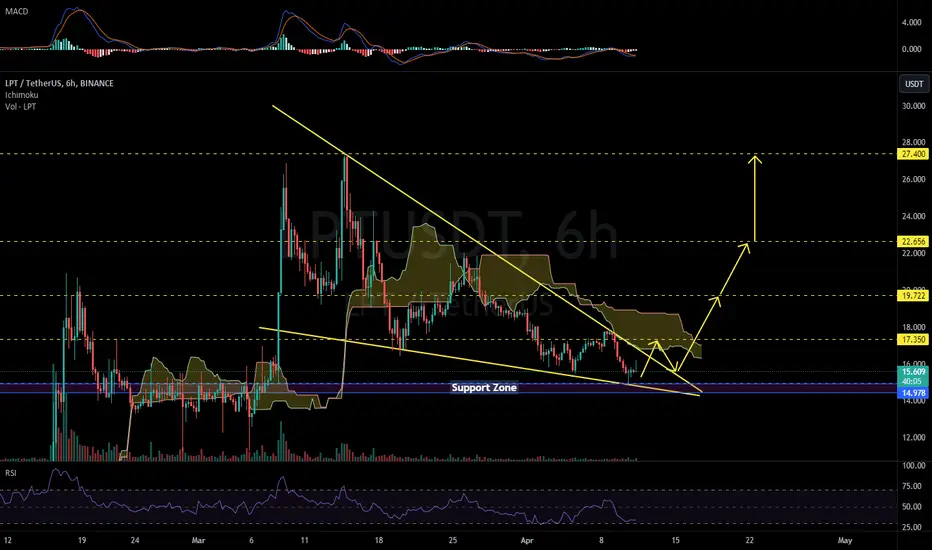
LPTUSDT 6HBuying some #LPT. It has bounced from the support zone. We expect some upward movement from here. We have heavy resistance at $16.80 ~ $17.20 zone. Targets are:
$17.350
$19.722
$22.656
$27.400
LPTUSDTHi snipers. LPTUSDT. The price is moving in a one-day time frame in an ascending channel and after approaching the ceiling of the channel and correcting the price, it has hit the lower line of the channel and also at this point we have the 103-day moving average, which can It plays a strong supporting role. At the same time, these two together create a good opportunity to buy. Nothing is impossible. This analysis is only a possibility. Be careful with your assets.
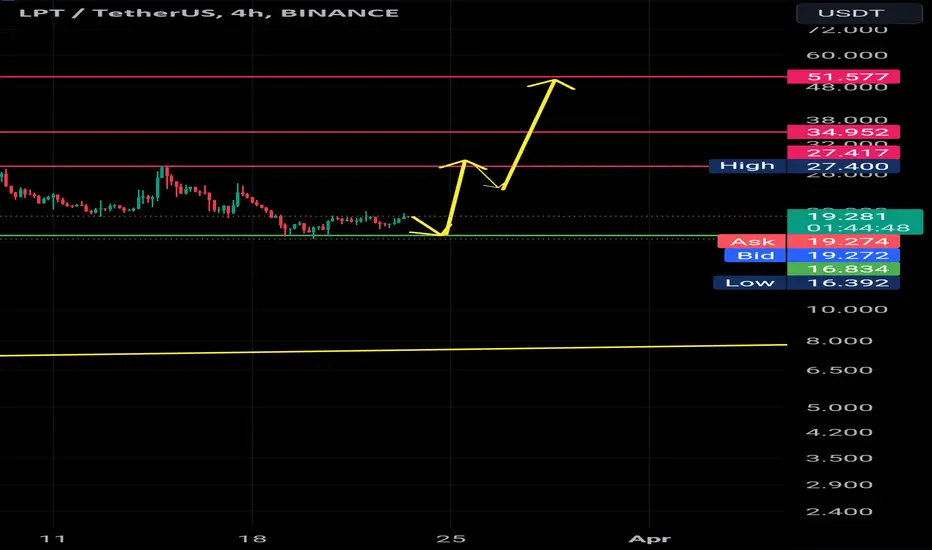
Possible sharp LPT trend
LPT targets are indicated in the picture.
LPT has changed its trend after hitting 16,392. And it may have a sharp move from the range of $19 towards the targets, otherwise it will hit the support range of 16,834 to 14,904 again and move towards the targets from there.
With respect
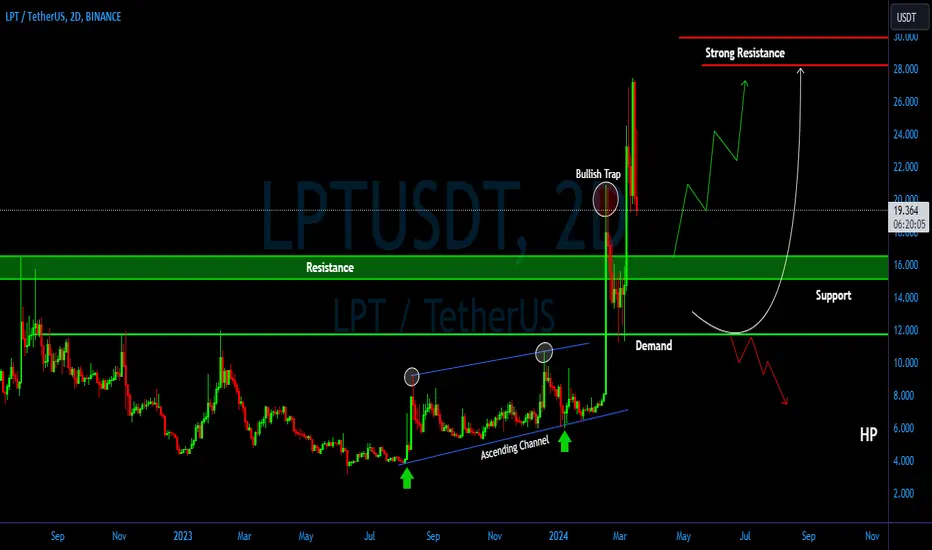
LPT/USDT Keep an eye on the support, potential bounce back to UP💎 LPT has recently encountered significant market dynamics, experienced rejection and forming a double-top pattern in the hourly timeframe. If this pattern holds true, there is potential for LPT to undergo a retest of the support area around 16.5.
💎 If LPT shows signs of bullish rejection at the support, such as forming bullish candle patterns, there is potential for the price to bounce and resume its upward trajectory, potentially testing the strong resistance area once again.
💎 However, if LPT fails to bounce when it reaches the support area, and even breaks down below it, it would signal bearish momentum, with the price potentially targeting the demand area.
💎 When LPT reaches the demand area, it must bounce and reclaim the area above the support at 16.5. A successful bounce would indicate a potential return to upward movement. However, failure to do so could lead to continued downward movement, with the price potentially declining further.
LPT/USDTHi Guys
LPT is looking good on weekly chart
***Breakout of falling wedge then retest***
**** RSI is too close of breaking out the trend line****
Targets on chart .
PLZ DYOR
Disclaimer: This article is for informational purposes only and not financial advice. Conduct thorough research and consult with professionals before making investment decisions.
Good luck.

Long According to the waves analysis we can expect that price rise again to the green zone.
Follow me for more ideas
🚧LPTUSDT is Bullish now🚧 & many Traders don't see it 👀!!!Hi.
COINEX:LPTUSDT
😊 Today, I want to analyze Bitcoin for you in a Weekly time frame so that we can have a Mid-term view of LPTUSDT regarding the technical analysis. (Please ✌️respectfully✌️share if you have a different opinion from me or other analysts).
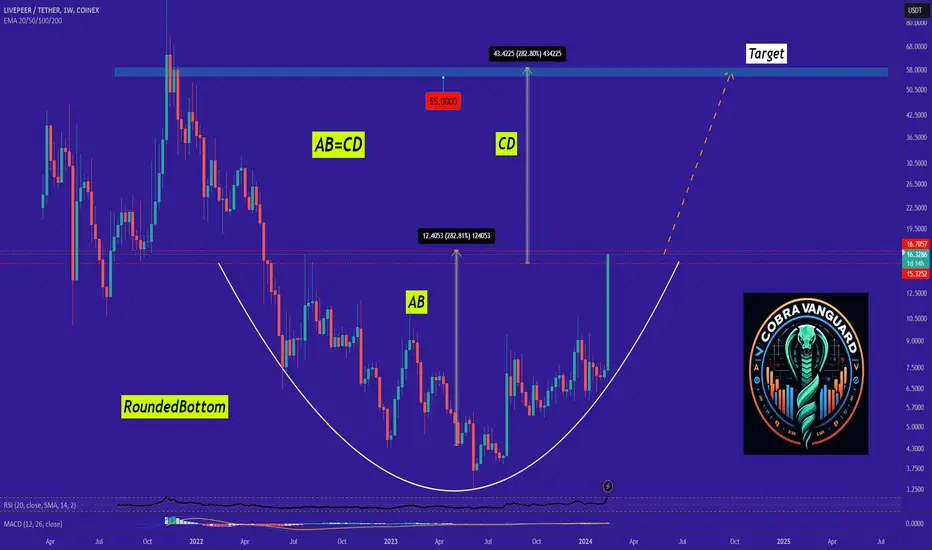
LPT has Created a Large Rounded Bottom. This Means The Price Can Increase as Much as the Length Between The Top and The Bottom Of the Rounded Bottom. Since the rounded bottom is Not broken. The price can have a good rally after the breakout.
✅ Due to the Ascending structure of the chart...
- High potential areas are clear in the chart.
- Rounded Bottom
- AB=CD
Stay awesome my friends.
_ _ _ _ _ _ _ _ _ _ _ _ _ _ _ _ _ _ _ _ _ _ _ _ _ _ _ _ _ _ _ _ _
✅Thank you, and for more ideas, hit ❤️Like❤️ and 🌟Follow🌟!
⚠️Things can change...
The markets are always changing and even with all these signals, the market changes tend to be strong and fast!!
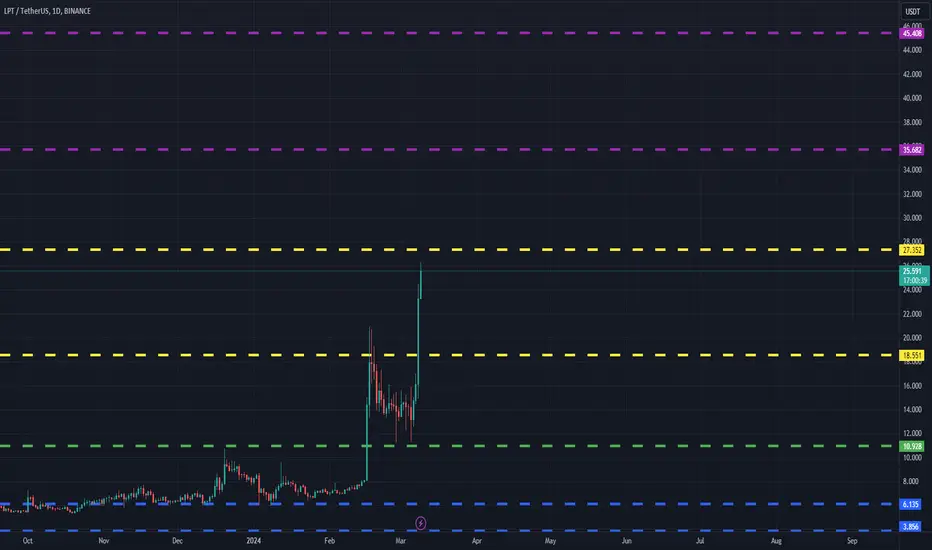
LPTUSDT(Livepeer) Daily tf Range Updated till 09-03-24LPTUSDT(Livepeer) Daily timeframe range. nice pump on daily candle very close to 27.352. if btc consolidate a little more it got good chance of cutting it clean. if not the recent retrace point is at 18.551.
$lptusdt trading plani have two key prices on the chart for buy, and they both has same Tp. these analyze bawed on fib.
