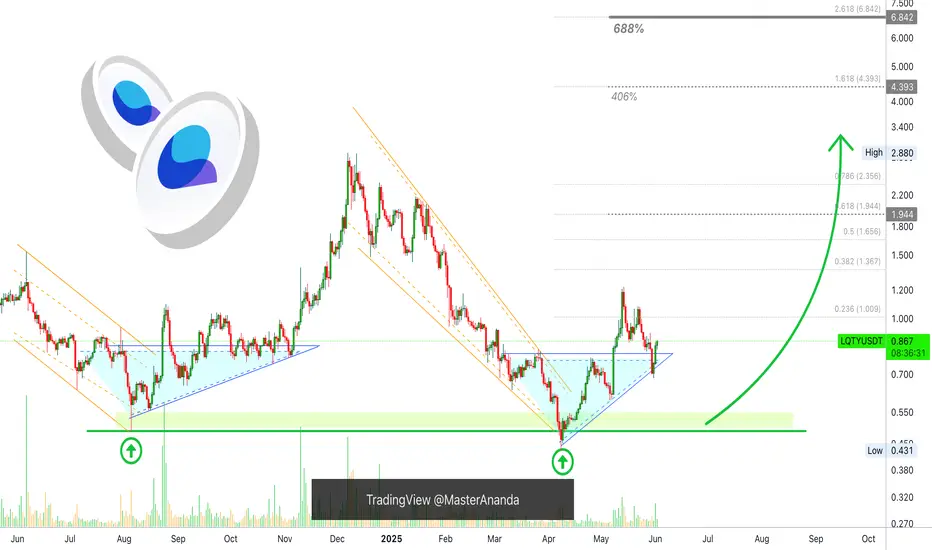
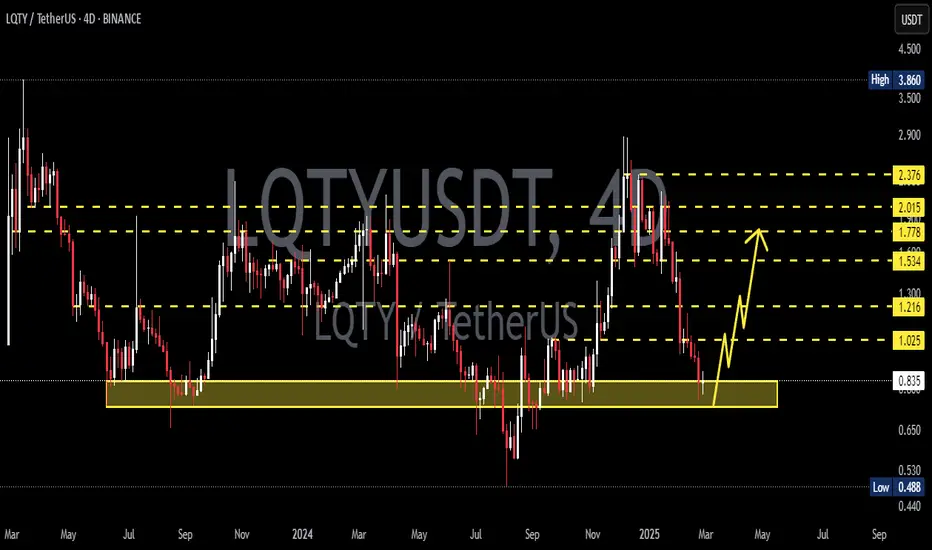
Liquity 400% & 688% Easy Targets 600% is great, truly awesome. Do you agree?
If you earn 600% on a $10,000 buy, wouldn't that be awesome?
What about 400%? Both are good to me.
Liquity is bullish and growing already.
The chart drawings show a double-bottom and also how this support zone leads to a bullish wave.
There was a full
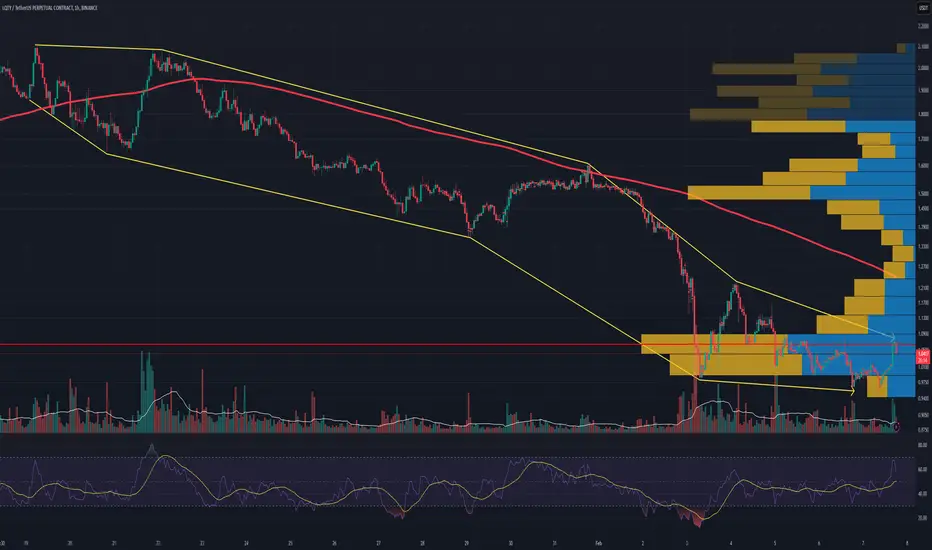
LQTY SHORT SETUP ALL trading ideas have entry point + stop loss + take profit + Risk level.
hello Traders, here is the full analysis for this pair, let me know in the comment section below if you have any questions, the entry will be taken only if all rules of the strategies will be satisfied. I suggest you keep thi
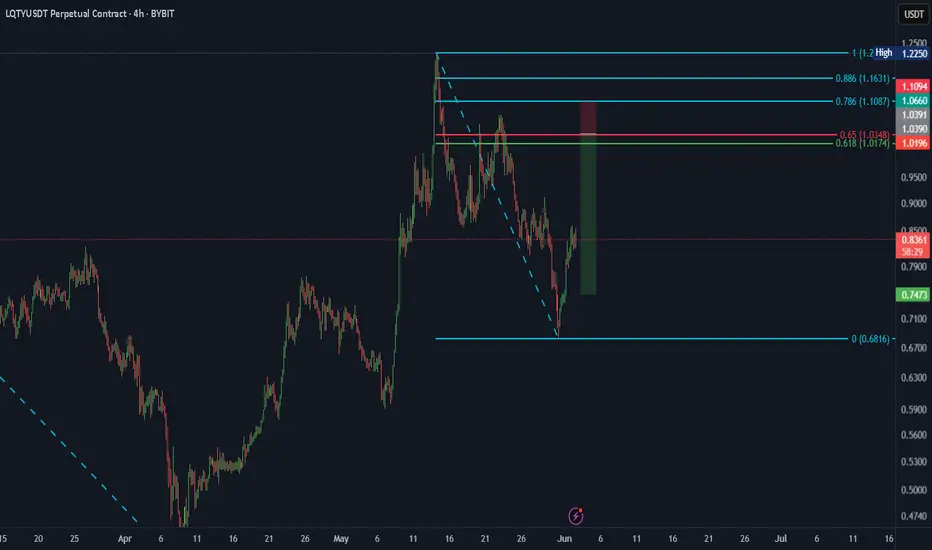
Sell LQTYUSDTSell LQTY and take profit of 1:2, As per the analysis the overall trend is down so we expect it to fall giving us good profit.
#LQTY/USDT#LQTY
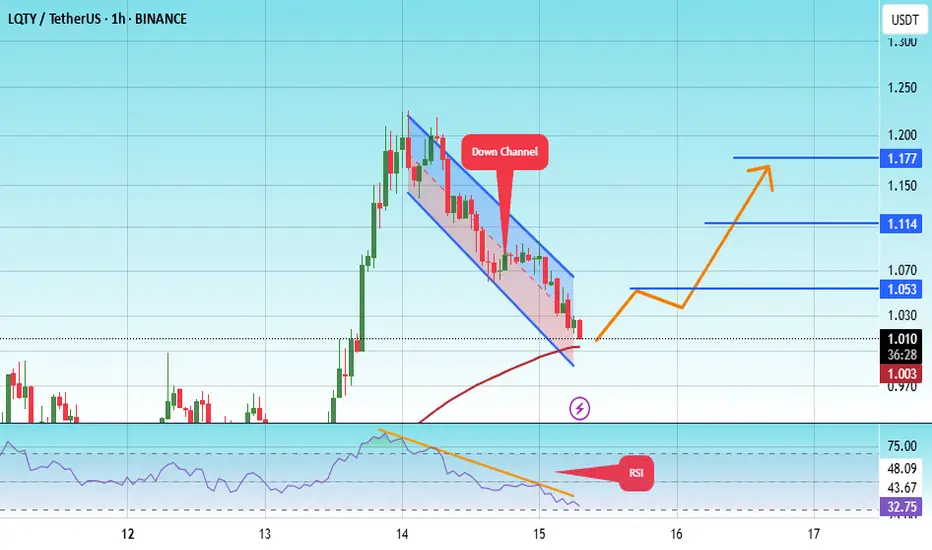
The price is moving within a descending channel on the 1-hour frame, adhering well to it, and is heading for a strong breakout and retest.
We are seeing a bounce from the lower boundary of the descending channel, which is support at 0.986.
We have a downtrend on the RSI indicator that is abo
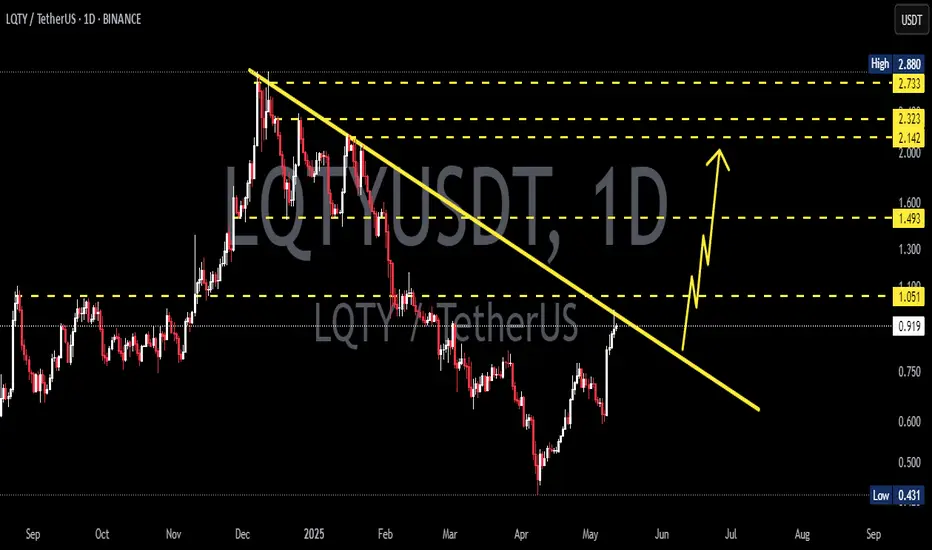
LQTYUSDT 1D Analysis LQTY ~ 1D Analysis
#LQTY Buy after successfully breaking this resistance line with a short term target of at least 15%+ from here.
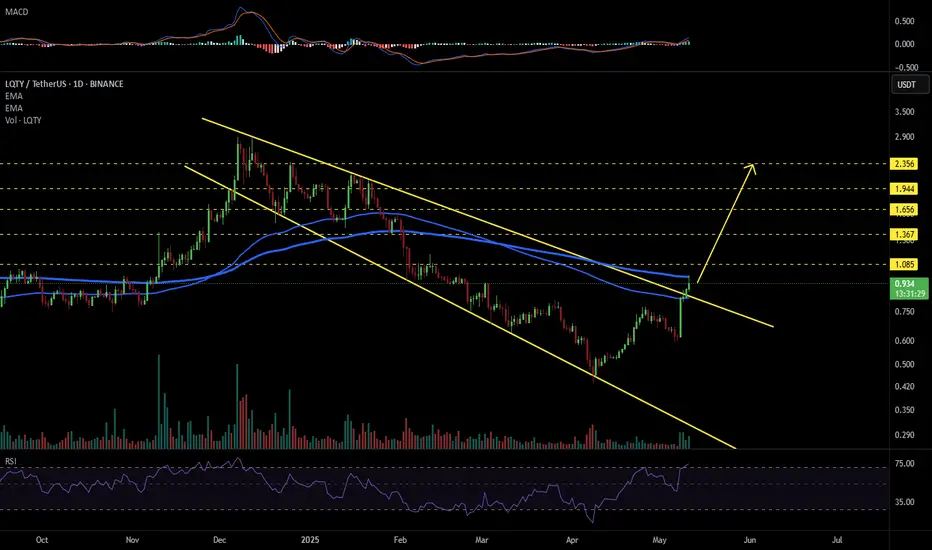
LQTYUSDT 1D#LQTY has broken above the EMA100 and the descending broadening wedge on the daily chart. In case of a successful retest and a breakout above the EMA200, the targets are:
🎯 $1.085
🎯 $1.367
🎯 $1.656
🎯 $1.944
🎯 $2.356
⚠️ Use a tight stop-loss.
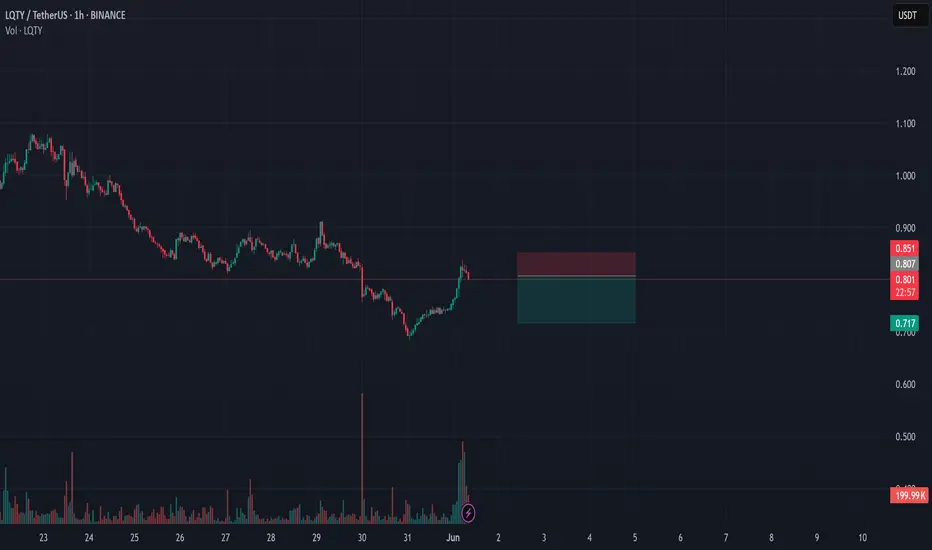
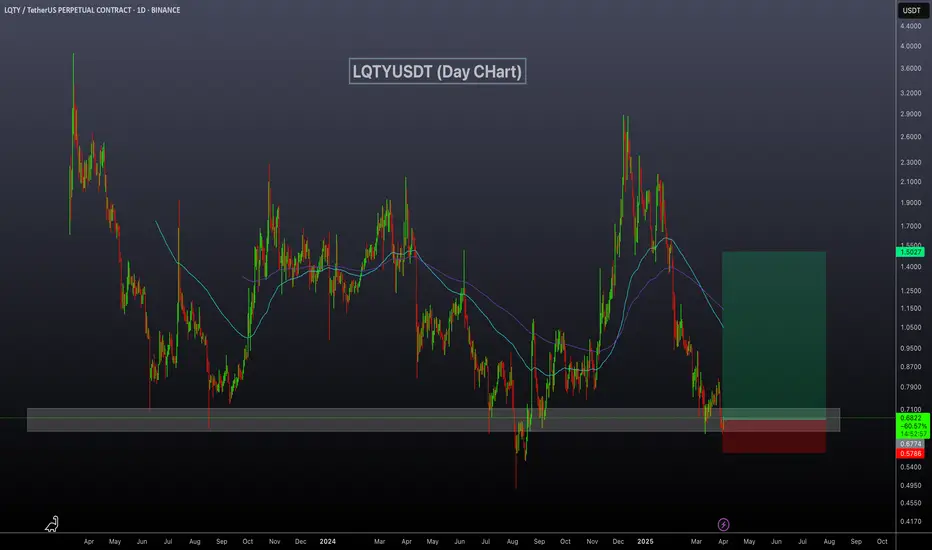
LQTYUSDT Eyes Rebound from Strong Support!LQTYUSDT technical analysis update
LQTYUSDT is trading at a strong support zone, where the price has touched multiple times and bounced back in the past. We can expect a similar bounce from the current support level. Additionally, in the daily chart, the RSI has dropped below 30, which is another b
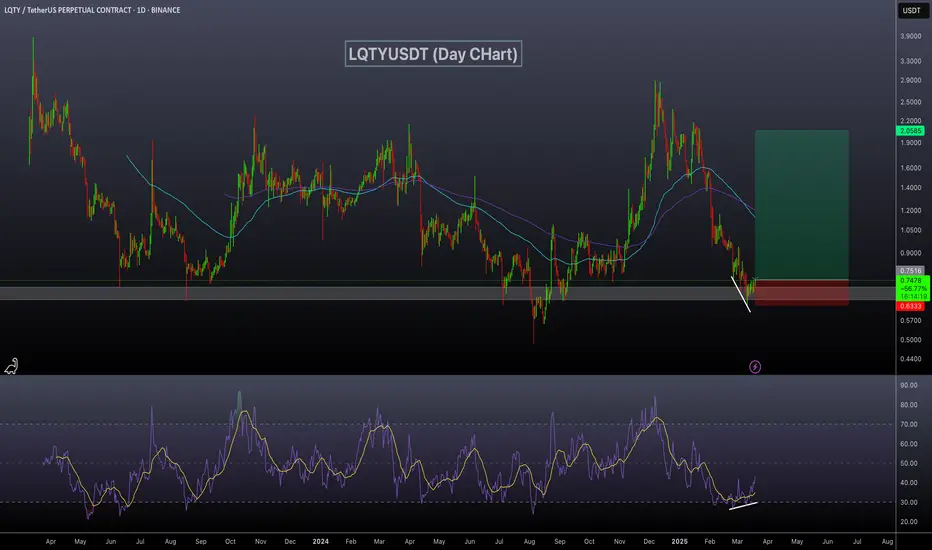
LQTYUSDT Bouncing Back!LQTYUSDT Technical analysis update
LQTYUSDT has bounced off a strong support zone, the same level where it previously showed a strong rebound. A bullish RSI divergence is visible on the daily chart, suggesting a potential bullish move from the current levels.
Buy zone : Below $0.76
Stop loss : $0
LQTYUSDT 4DLQTY ~ 4D Analysis
#LQTY Buy gradually from here if you still have a Conviction on this Coin with a minimum target of 20%+.
LQTY/USDT-1H-BINANCEbearish trend changes to bullish with a higher low
This is not a financial advice. Always do your own research and always put stoploss in your trade (SL) :) If you want more detailed info
how to study and read charts or just need help with some coin, just write to me here a comment, i will try to a
See all ideas
Summarizing what the indicators are suggesting.
Oscillators
Neutral
SellBuy
Strong sellStrong buy
Strong sellSellNeutralBuyStrong buy
Oscillators
Neutral
SellBuy
Strong sellStrong buy
Strong sellSellNeutralBuyStrong buy
Summary
Neutral
SellBuy
Strong sellStrong buy
Strong sellSellNeutralBuyStrong buy
Summary
Neutral
SellBuy
Strong sellStrong buy
Strong sellSellNeutralBuyStrong buy
Summary
Neutral
SellBuy
Strong sellStrong buy
Strong sellSellNeutralBuyStrong buy
Moving Averages
Neutral
SellBuy
Strong sellStrong buy
Strong sellSellNeutralBuyStrong buy
Moving Averages
Neutral
SellBuy
Strong sellStrong buy
Strong sellSellNeutralBuyStrong buy
Displays a symbol's price movements over previous years to identify recurring trends.