LQTY/USDTKey Level Zone: 1.0180 - 1.1000
LMT v2.0 detected.
The setup looks promising—price previously trended upward with rising volume and momentum, then retested this zone cleanly. This presents an excellent reward-to-risk opportunity if momentum continues to align.
Introducing LMT (Levels & Momentum Trading)
- Over the past 3 years, I’ve refined my approach to focus more sharply on the single most important element in any trade: the KEY LEVEL.
- While HMT (High Momentum Trading) served me well—combining trend, momentum, volume, and structure across multiple timeframes—I realized that consistently identifying and respecting these critical price zones is what truly separates good trades from great ones.
- That insight led to the evolution of HMT into LMT – Levels & Momentum Trading.
Why the Change? (From HMT to LMT)
Switching from High Momentum Trading (HMT) to Levels & Momentum Trading (LMT) improves precision, risk control, and confidence by:
- Clearer Entries & Stops: Defined key levels make it easier to plan entries, stop-losses, and position sizing—no more guesswork.
- Better Signal Quality: Momentum is now always checked against a support or resistance zone—if it aligns, it's a stronger setup.
- Improved Reward-to-Risk: All trades are anchored to key levels, making it easier to calculate and manage risk effectively.
- Stronger Confidence: With clear invalidation points beyond key levels, it's easier to trust the plan and stay disciplined—even in tough markets.
Whenever I share a signal, it’s because:
- A high‐probability key level has been identified on a higher timeframe.
- Lower‐timeframe momentum, market structure and volume suggest continuation or reversal is imminent.
- The reward‐to‐risk (based on that key level) meets my criteria for a disciplined entry.
***Please note that conducting a comprehensive analysis on a single timeframe chart can be quite challenging and sometimes confusing. I appreciate your understanding of the effort involved.
Important Note: The Role of Key Levels
- Holding a key level zone: If price respects the key level zone, momentum often carries the trend in the expected direction. That’s when we look to enter, with stop-loss placed just beyond the zone with some buffer.
- Breaking a key level zone: A definitive break signals a potential stop‐out for trend traders. For reversal traders, it’s a cue to consider switching direction—price often retests broken zones as new support or resistance.
My Trading Rules (Unchanged)
Risk Management
- Maximum risk per trade: 2.5%
- Leverage: 5x
Exit Strategy / Profit Taking
- Sell at least 70% on the 3rd wave up (LTF Wave 5).
- Typically sell 50% during a high‐volume spike.
- Move stop‐loss to breakeven once the trade achieves a 1.5:1 R:R.
- Exit at breakeven if momentum fades or divergence appears.
The market is highly dynamic and constantly changing. LMT signals and target profit (TP) levels are based on the current price and movement, but market conditions can shift instantly, so it is crucial to remain adaptable and follow the market's movement.
If you find this signal/analysis meaningful, kindly like and share it.
Thank you for your support~
Sharing this with love!
From HMT to LMT: A Brief Version History
HM Signal :
Date: 17/08/2023
- Early concept identifying high momentum pullbacks within strong uptrends
- Triggered after a prior wave up with rising volume and momentum
- Focused on healthy retracements into support for optimal reward-to-risk setups
HMT v1.0:
Date: 18/10/2024
- Initial release of the High Momentum Trading framework
- Combined multi-timeframe trend, volume, and momentum analysis.
- Focused on identifying strong trending moves high momentum
HMT v2.0:
Date: 17/12/2024
- Major update to the Momentum indicator
- Reduced false signals from inaccurate momentum detection
- New screener with improved accuracy and fewer signals
HMT v3.0:
Date: 23/12/2024
- Added liquidity factor to enhance trend continuation
- Improved potential for momentum-based plays
- Increased winning probability by reducing entries during peaks
HMT v3.1:
Date: 31/12/2024
- Enhanced entry confirmation for improved reward-to-risk ratios
HMT v4.0:
Date: 05/01/2025
- Incorporated buying and selling pressure in lower timeframes to enhance the probability of trending moves while optimizing entry timing and scaling
HMT v4.1:
Date: 06/01/2025
- Enhanced take-profit (TP) target by incorporating market structure analysis
HMT v5 :
Date: 23/01/2025
- Refined wave analysis for trending conditions
- Incorporated lower timeframe (LTF) momentum to strengthen trend reliability
- Re-aligned and re-balanced entry conditions for improved accuracy
HMT v6 :
Date : 15/02/2025
- Integrated strong accumulation activity into in-depth wave analysis
HMT v7 :
Date : 20/03/2025
- Refined wave analysis along with accumulation and market sentiment
HMT v8 :
Date : 16/04/2025
- Fully restructured strategy logic
HMT v8.1 :
Date : 18/04/2025
- Refined Take Profit (TP) logic to be more conservative for improved win consistency
LMT v1.0 :
Date : 06/06/2025
- Rebranded to emphasize key levels + momentum as the core framework
LMT v2.0
Date: 11/06/2025
- Fully restructured lower timeframe (LTF) momentum logic
- Enhanced entry timing for better precision and alignment with key levels
LQTYUSDT trade ideas

LQTY / USDTBINANCE:LQTYUSDT
📊 **Chart Overview – LQTY/USDT (4H, Binance):**
* 📍 **Current Price:** \$1.134
* 🔻 **Downtrend Line:** Strong descending trendline still acting as resistance.
* 🟥 **Demand Zone (Support):** \$0.91 – \$0.96
* 🟢 **Scenario Projection:** Price might **retest the demand zone** before attempting a bullish reversal (marked by the black curved arrow).
---
### 🔍 Key Observations:
1. **Trend Structure:**
* Price has been respecting a **descending trendline** since the \$1.65+ top.
* Recent rejection from the trendline suggests **sellers are still active**.
2. **Price Reaction Zone:**
* The highlighted **support zone (\$0.91 – \$0.96)** has a history of strong buying and breakout behavior.
* If price drops into this region again, it may trigger a **bullish reversal or bounce**.
3. **Bullish Opportunity:**
* If price **taps into the demand zone with a long wick / strong candle close**, it could be a **high-probability entry** for long setups.
* Potential upside: **\$1.20 – \$1.30** range.
4. **Invalidation:**
* A **clean break below \$0.91** would invalidate the bullish scenario and signal further downside.
---
📈 **Trade Idea (Hypothetical):**
* **Entry Zone:** \$0.94 – \$0.96
* **Stop Loss:** Below \$0.89
* **Target 1:** \$1.15
* **Target 2:** \$1.25
---
⚠️ **Reminder:** This is **not financial advice** – always use your own risk tolerance and confirmation tools (volume, candle close, etc.)

LQTY — 4H 200MA Hold & Squeeze Trigger1. Price holds above 4H 200MA
2. Flip blue box (1.21) to support for entry
3. Entry: Confirmed hold above blue box
4. Squeeze target: Quick move higher
5. Stop: Below 4H 200MA

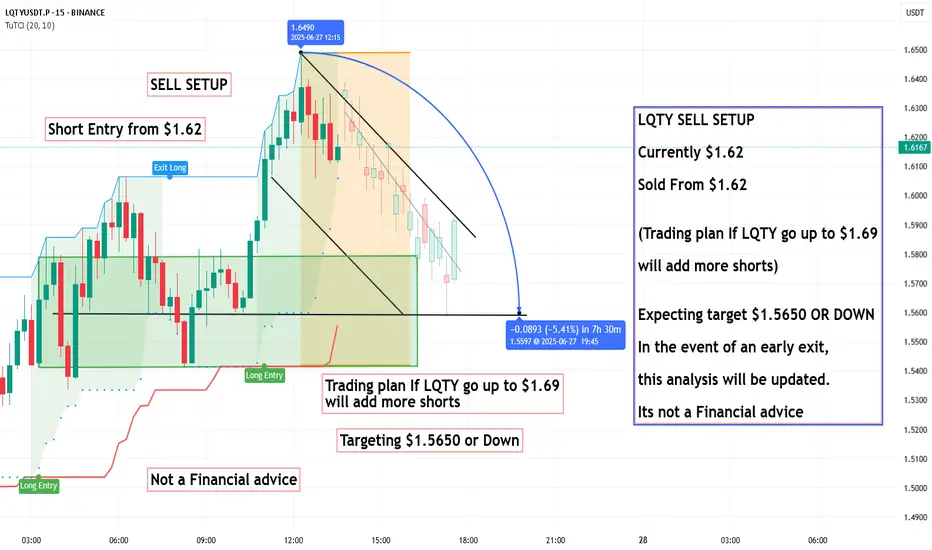
LQTY SELL SETUP, Sold From $1.62LQTY SELL SETUP
Currently $1.62
Sold From $1.62
(Trading plan If LQTY go up to $1.69
will add more shorts)
Expecting target $1.5650 OR DOWN
In the event of an early exit,
this analysis will be updated.
Its not a Financial advice
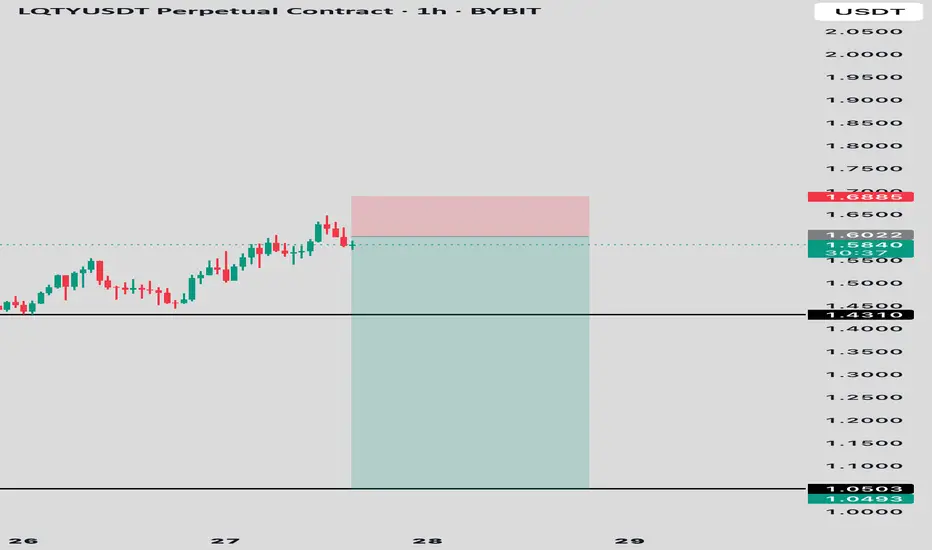
LQTY/USDT – 1H Bearish OutlookShort Setup | Clean Rejection at Local High
Price has recently tapped into a supply zone around 1.68, facing immediate rejection. A clean break of bullish momentum suggests a likely move downward as the market seeks liquidity and efficiency.
Entry: 1.6022
• Stop Loss: 1.6885 (above local high)
• Target 1: 1.4310 (intermediate structure support)
• Target 2 / Final TP: 1.0493 (macro demand zone)
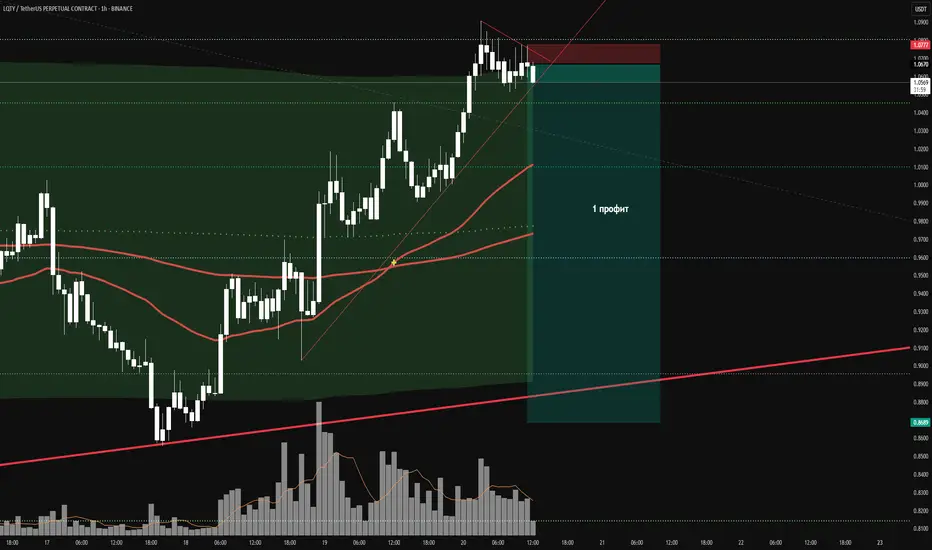
LQTY - Buy - buy - bye bye- Volume in volume
- Divergence in volume
- Completed 5th wave of growth
I don't know what else to write.
If you like the idea, please put a ‘like’. It's the best ‘Thank you!’ 😊 P.S. Always do your own analysis before a trade. Set a stop loss. Capture profits in instalments. Withdraw profits in fiat and make yourself and your friends happy.
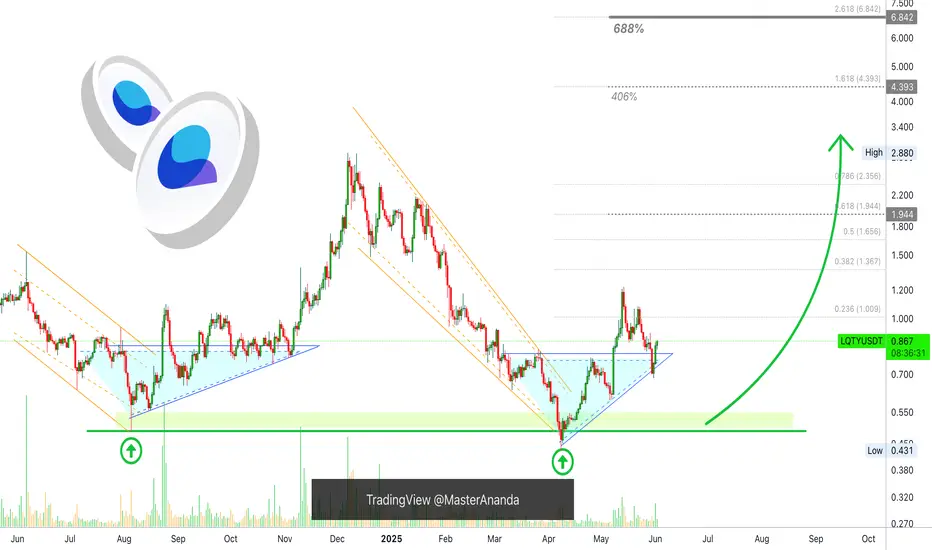
Liquity 400% & 688% Easy Targets 600% is great, truly awesome. Do you agree?
If you earn 600% on a $10,000 buy, wouldn't that be awesome?
What about 400%? Both are good to me.
Liquity is bullish and growing already.
The chart drawings show a double-bottom and also how this support zone leads to a bullish wave.
There was a full flush in 2025. Which means that the action went below the previous low, August 2024.
This can be interpreted in two ways mainly:
1) LQTYUSDT is weak and for this reason it pierced below previous support.
2) There was plenty of liquidity at this level and the market couldn't let it go and it moved lower. So many people hold this coin.
Bonus:
3) A full flush opens the doors for maximum growth.
I am an optimist, so I always consider/favor the bright side. So I take it as a positive development; no more weak hands.
Everybody who wanted to sell, sold.
Everybody that remains in now is ready to hold.
This opens the doors for huge long-term growth.
These targets on the chart are easy targets and can hit within months. Just a few months and you can book a huge 400% profits on this trade.
Liquity is bullish now. Strongly bullish.
Thank you for reading.
Namaste.
LQTY SHORT SETUP ALL trading ideas have entry point + stop loss + take profit + Risk level.
hello Traders, here is the full analysis for this pair, let me know in the comment section below if you have any questions, the entry will be taken only if all rules of the strategies will be satisfied. I suggest you keep this pair on your watchlist and see if the rules of your strategy are satisfied. Please also refer to the Important Risk Notice linked below.
Disclaimer
Sell LQTYUSDTSell LQTY and take profit of 1:2, As per the analysis the overall trend is down so we expect it to fall giving us good profit.
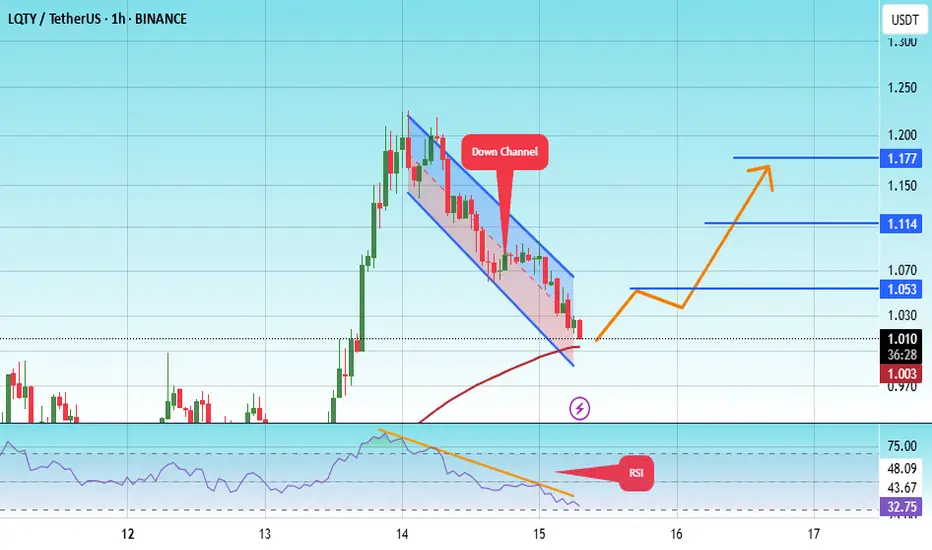
#LQTY/USDT#LQTY
The price is moving within a descending channel on the 1-hour frame, adhering well to it, and is heading for a strong breakout and retest.
We are seeing a bounce from the lower boundary of the descending channel, which is support at 0.986.
We have a downtrend on the RSI indicator that is about to be broken and retested, supporting the upward trend.
We are looking for stability above the 100 moving average.
Entry price: 1.011
First target: 1.053
Second target: 1.114
Third target: 1.177
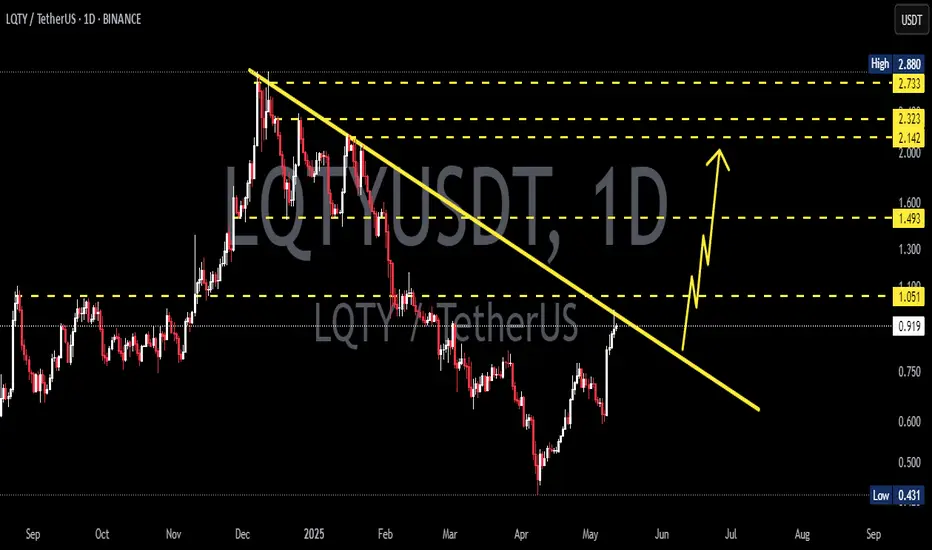
LQTYUSDT 1D Analysis LQTY ~ 1D Analysis
#LQTY Buy after successfully breaking this resistance line with a short term target of at least 15%+ from here.
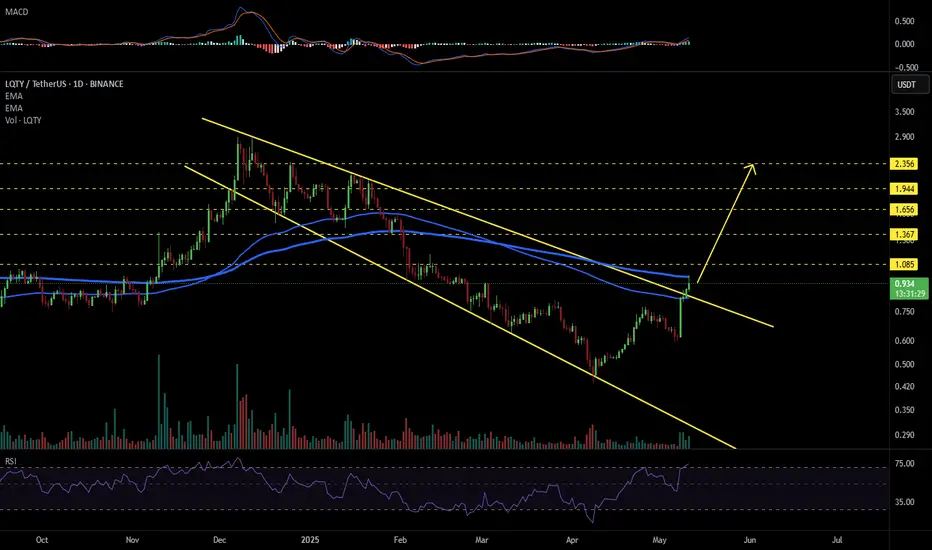
LQTYUSDT 1D#LQTY has broken above the EMA100 and the descending broadening wedge on the daily chart. In case of a successful retest and a breakout above the EMA200, the targets are:
🎯 $1.085
🎯 $1.367
🎯 $1.656
🎯 $1.944
🎯 $2.356
⚠️ Use a tight stop-loss.
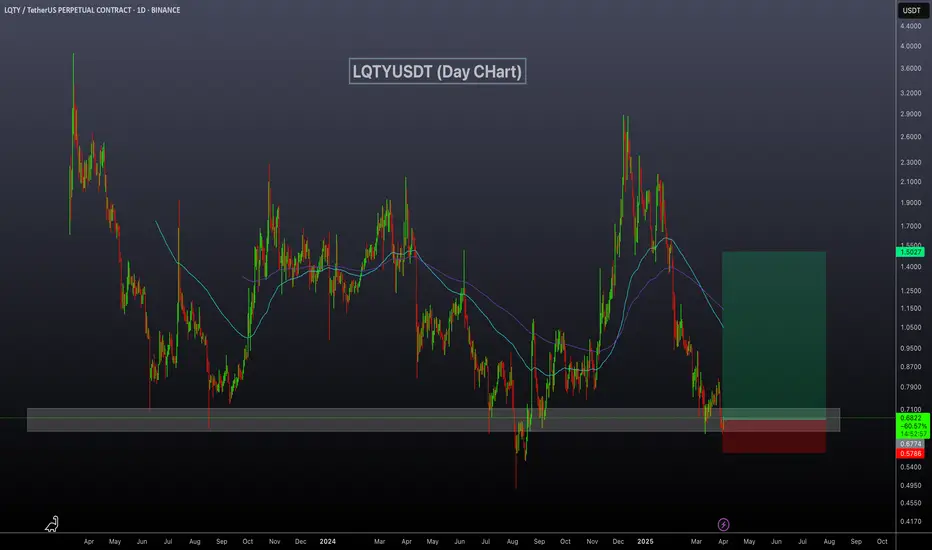
LQTYUSDT Eyes Rebound from Strong Support!LQTYUSDT technical analysis update
LQTYUSDT is trading at a strong support zone, where the price has touched multiple times and bounced back in the past. We can expect a similar bounce from the current support level. Additionally, in the daily chart, the RSI has dropped below 30, which is another bullish sign for LQTY.
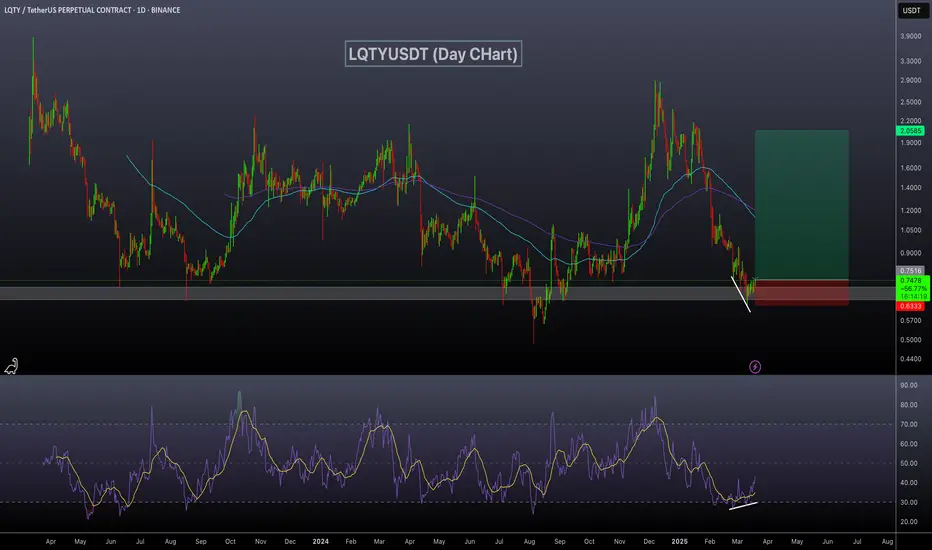
LQTYUSDT Bouncing Back!LQTYUSDT Technical analysis update
LQTYUSDT has bounced off a strong support zone, the same level where it previously showed a strong rebound. A bullish RSI divergence is visible on the daily chart, suggesting a potential bullish move from the current levels.
Buy zone : Below $0.76
Stop loss : $0.625
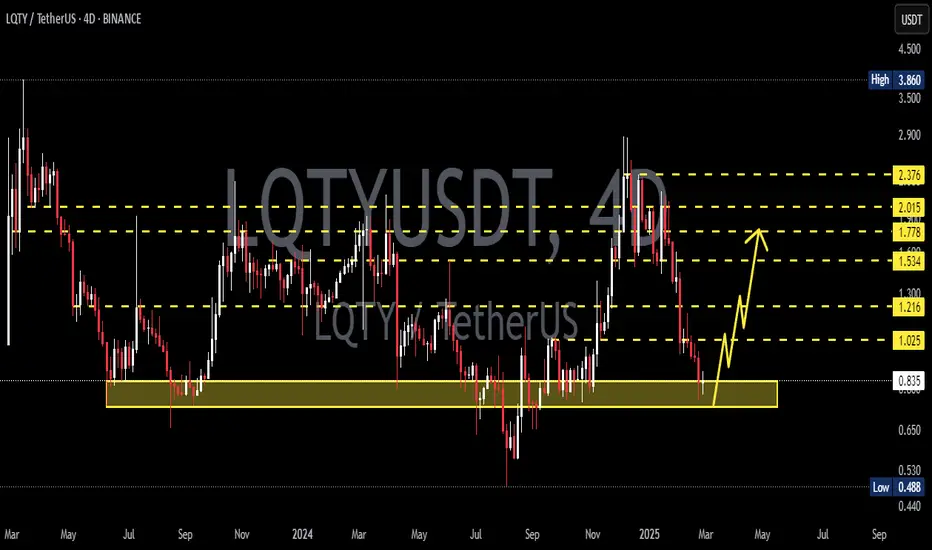
LQTYUSDT 4DLQTY ~ 4D Analysis
#LQTY Buy gradually from here if you still have a Conviction on this Coin with a minimum target of 20%+.
LQTY/USDT-1H-BINANCEbearish trend changes to bullish with a higher low
This is not a financial advice. Always do your own research and always put stoploss in your trade (SL) :) If you want more detailed info
how to study and read charts or just need help with some coin, just write to me here a comment, i will try to answer to everybody...
i can help you :) all for free, don't worry, BE HAPPY!
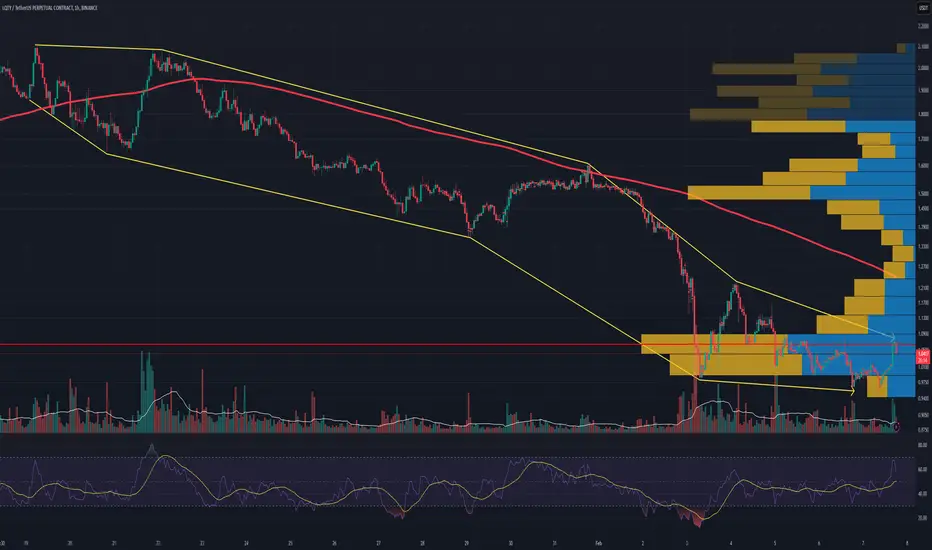
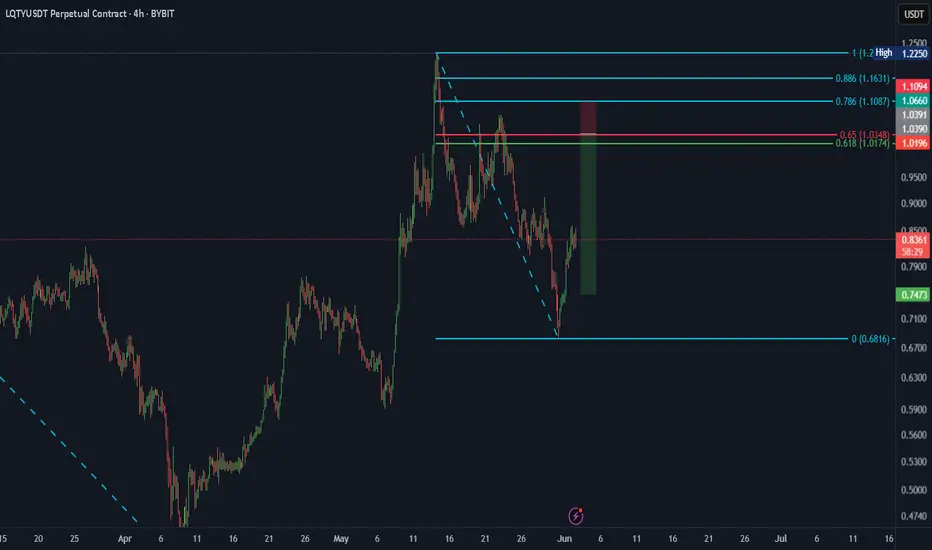
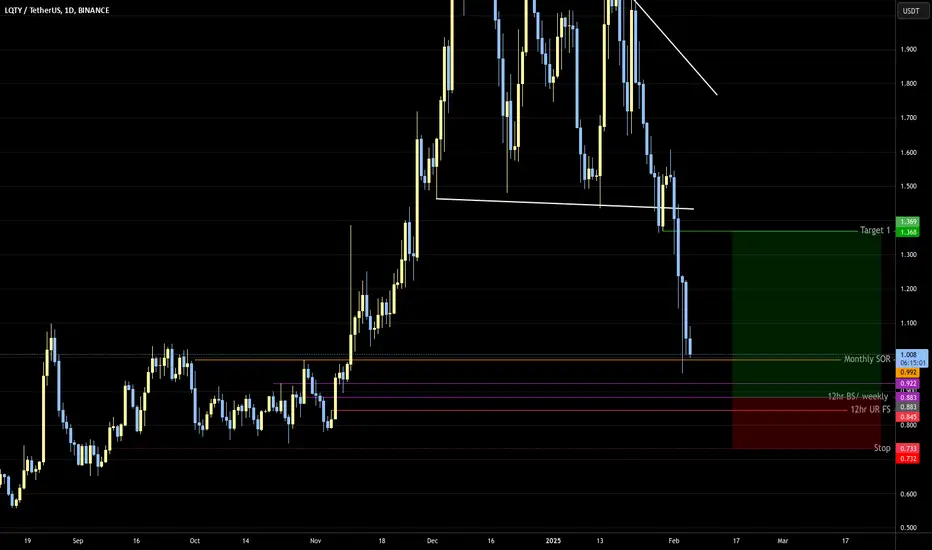
3.2 RRLQTY is coming down to longer-term targets, given 12hr was held at the very top, a 12hr UR within monthly range is a good target! It may hit the lower red line, if you want to be safer this is the better entry, and will give a better risk:reward and trade management possibilities.
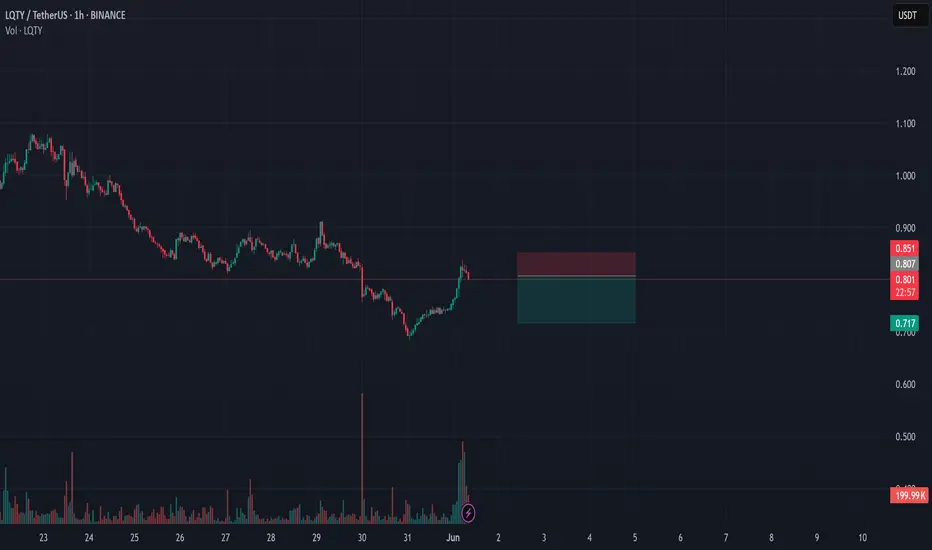
Precision Trading – The Sniper Entry is Coming!LQTYUSDT Analysis
Precision Trading – The Sniper Entry is Coming! 🎯💥
“I know I’m aiming a little lower, but listen – that’s what makes a great trader. I don’t chase, I wait. I snipe the perfect entry, and when the time comes, boom – we hit big!”
Here’s the Setup:
Blue Box = High-Profit Zone – If CDV, lower time frame breakouts, and volume profile confirm, this area could be golden for a high-RR entry.
Patience Wins the Game – We don’t buy blindly, we wait for the right moment. A sniper doesn’t fire without a target, and neither do we!
Momentum Confirmation is Key – When the breakout happens, you don’t want to be late – position early, trade smart, profit big.
Final Thoughts:
“I’ll be watching CDV, volume profile, and liquidity heatmap like a hawk. No confirmation? No trade. But when the signal comes? We strike with precision and dominate!”
Good luck, traders – this could be an absolute monster! 🚀🔥
Let me tell you, this is something special. These insights, these setups—they’re not just good; they’re game-changers. I've spent years refining my approach, and the results speak for themselves. People are always asking, "How do you spot these opportunities?" It’s simple: experience, clarity, and a focus on high-probability moves.
Want to know how I use heatmaps, cumulative volume delta, and volume footprint techniques to find demand zones with precision? I’m happy to share—just send me a message. No cost, no catch. I believe in helping people make smarter decisions.
Here are some of my recent analyses. Each one highlights key opportunities:
🚀 RENDERUSDT: Strategic Support Zones at the Blue Boxes +%45 Reaction
🎯 PUNDIXUSDT: Huge Opportunity | 250% Volume Spike - %60 Reaction Sniper Entry
🌐 CryptoMarkets TOTAL2: Support Zone
🚀 GMTUSDT: %35 FAST REJECTION FROM THE RED BOX
🎯 ZENUSDT.P: Patience & Profitability | %230 Reaction from the Sniper Entry
🎯 DEXEUSDT %180 Reaction with %9 Stop
🐶 DOGEUSDT.P: Next Move
🎨 RENDERUSDT.P: Opportunity of the Month
💎 ETHUSDT.P: Where to Retrace
🟢 BNBUSDT.P: Potential Surge
📊 BTC Dominance: Reaction Zone
🌊 WAVESUSDT.P: Demand Zone Potential
🟣 UNIUSDT.P: Long-Term Trade
🔵 XRPUSDT.P: Entry Zones
🔗 LINKUSDT.P: Follow The River
📈 BTCUSDT.P: Two Key Demand Zones
🟩 POLUSDT: Bullish Momentum
🌟 PENDLEUSDT.P: Where Opportunity Meets Precision
🔥 BTCUSDT.P: Liquidation of Highly Leveraged Longs
🌊 SOLUSDT.P: SOL's Dip - Your Opportunity
🐸 1000PEPEUSDT.P: Prime Bounce Zone Unlocked
🚀 ETHUSDT.P: Set to Explode - Don't Miss This Game Changer
🤖 IQUSDT: Smart Plan
⚡️ PONDUSDT: A Trade Not Taken Is Better Than a Losing One
💼 STMXUSDT: 2 Buying Areas
🐢 TURBOUSDT: Buy Zones and Buyer Presence
🌍 ICPUSDT.P: Massive Upside Potential | Check the Trade Update For Seeing Results
🟠 IDEXUSDT: Spot Buy Area | %26 Profit if You Trade with MSB
📌 USUALUSDT: Buyers Are Active + %70 Profit in Total
🌟 FORTHUSDT: Sniper Entry +%26 Reaction
🐳 QKCUSDT: Sniper Entry +%57 Reaction
📊 BTC.D: Retest of Key Area Highly Likely
This list? It’s just a small piece of what I’ve been working on. There’s so much more. Go check my profile, see the results for yourself. My goal is simple: provide value and help you win. If you’ve got questions, I’ve got answers. Let’s get to work!

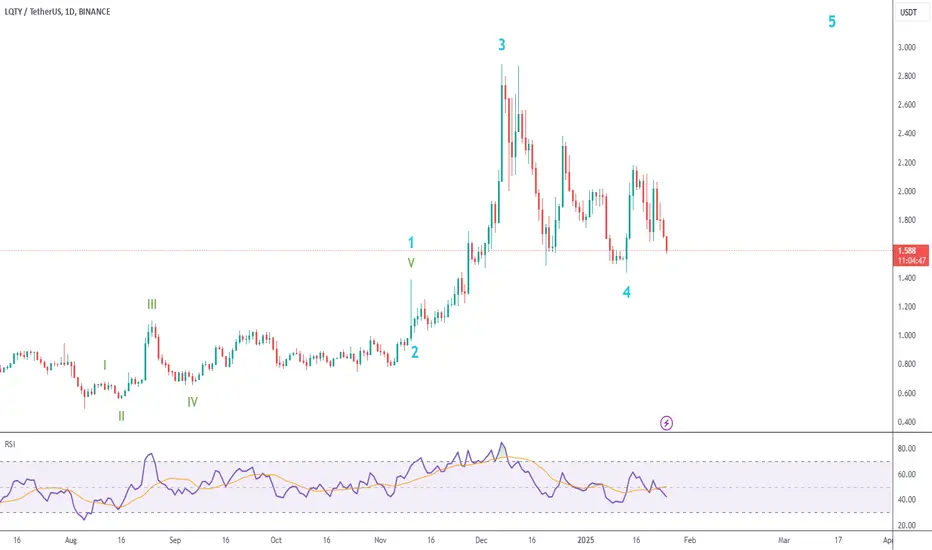
LQTY wave 5This is the primary count I'm looking at right now.
Waves 1-2 are not the most beautiful out there, but valid nonetheless.
We have a wave 4 respecting the wave 1 high, with some bullish RSI divergence. Looking good for trades with high risk/reward ratios.
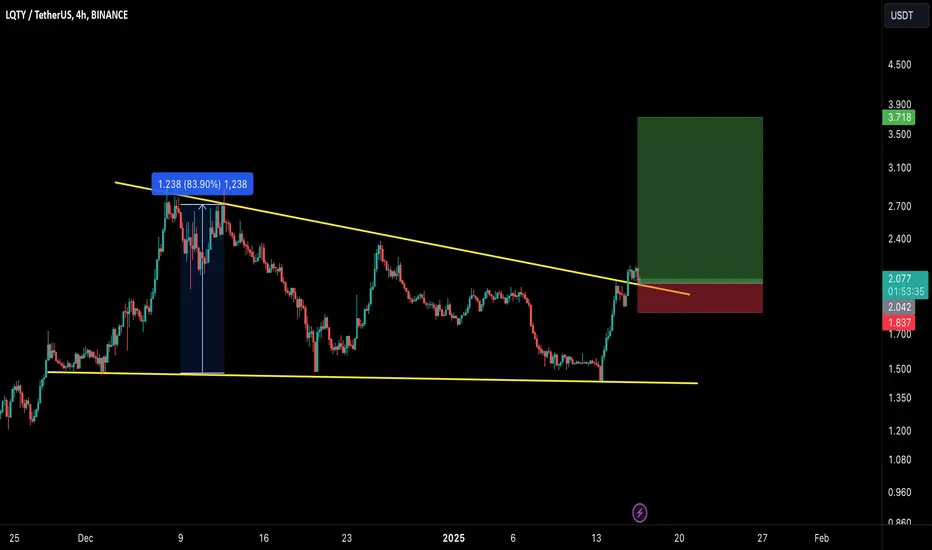
LQTY/USDT BREAKOUT ALERT: READY FOR 60-80% SURGE!!🚀 Hey Traders! 👋
If this setup gets you hyped, smash that 👍 and hit Follow for game-changing trade ideas that deliver results! 💹🔥
LQTY: Ready for Takeoff! 🚀
LQTY is looking primed for a big move! It just broke out of a falling wedge on the 4-hour timeframe and successfully retested it—setting the stage for a strong rally! 📈 Now’s the time to position yourself for the next leg up.
📊 Trade Setup:
Entry Range: CMP (Current Market Price) and add more up to $1.98
Targets: $2.34 / $2.76 / $3.12 / $3.72
Stop Loss: $1.84
Leverage: Keep it low (max 5x)
💬 What’s Your Take?
Do you see LQTY’s breakout potential? Share your thoughts, strategies, or predictions in the comments below! Let’s ride this wave and bag those profits together! 💰🔥
LQTYUSDT: Blue Boxes in Focus for Bullish Breakouts
LQTYUSDT: Blue Boxes in Focus for Bullish Breakouts 🔵
LQTYUSDT is shaping up to be a fascinating chart, and here’s the plan:
Blue Boxes Matter: These zones are where I’ll be watching closely for potential upward market structure breaks.
Key Indicators: Confirmation will come from tools like CDV (Cumulative Delta Volume) and volume profile . These will tell us if buyers are stepping in with conviction.
Lower Time Frames: I’ll be analyzing 1H or lower charts for precise entry signals.
My Approach:
Patience is everything. No action until we see those bullish signals—low timeframe breakouts and buyer strength are non-negotiable!
Stay tuned, traders. Boost, comment, and follow for more sharp market insights! 🚀
Let me tell you, this is something special. These insights, these setups—they’re not just good; they’re game-changers. I've spent years refining my approach, and the results speak for themselves. People are always asking, "How do you spot these opportunities?" It’s simple: experience, clarity, and a focus on high-probability moves.
Want to know how I use heatmaps, cumulative volume delta, and volume footprint techniques to find demand zones with precision? I’m happy to share—just send me a message. No cost, no catch. I believe in helping people make smarter decisions.
Here are some of my recent analyses. Each one highlights key opportunities:
🚀 RENDERUSDT: Strategic Support Zones at the Blue Boxes +%45 Reaction
🎯 PUNDIXUSDT: Huge Opportunity | 250% Volume Spike - %60 Reaction Sniper Entry
🌐 CryptoMarkets TOTAL2: Support Zone
🚀 GMTUSDT: %35 FAST REJECTION FROM THE RED BOX
🎯 ZENUSDT.P: Patience & Profitability | %230 Reaction from the Sniper Entry
🐶 DOGEUSDT.P: Next Move
🎨 RENDERUSDT.P: Opportunity of the Month
💎 ETHUSDT.P: Where to Retrace
🟢 BNBUSDT.P: Potential Surge
📊 BTC Dominance: Reaction Zone
🌊 WAVESUSDT.P: Demand Zone Potential
🟣 UNIUSDT.P: Long-Term Trade
🔵 XRPUSDT.P: Entry Zones
🔗 LINKUSDT.P: Follow The River
📈 BTCUSDT.P: Two Key Demand Zones
🟩 POLUSDT: Bullish Momentum
🌟 PENDLEUSDT.P: Where Opportunity Meets Precision
🔥 BTCUSDT.P: Liquidation of Highly Leveraged Longs
🌊 SOLUSDT.P: SOL's Dip - Your Opportunity
🐸 1000PEPEUSDT.P: Prime Bounce Zone Unlocked
🚀 ETHUSDT.P: Set to Explode - Don't Miss This Game Changer
🤖 IQUSDT: Smart Plan
⚡️ PONDUSDT: A Trade Not Taken Is Better Than a Losing One
💼 STMXUSDT: 2 Buying Areas
🐢 TURBOUSDT: Buy Zones and Buyer Presence
🌍 ICPUSDT.P: Massive Upside Potential | Check the Trade Update For Seeing Results
🟠 IDEXUSDT: Spot Buy Area | %26 Profit if You Trade with MSB
📌 USUALUSDT: Buyers Are Active + %70 Profit in Total
🌟 FORTHUSDT: Sniper Entry +%26 Reaction
🐳 QKCUSDT: Sniper Entry +%57 Reaction
📊 BTC.D: Retest of Key Area Highly Likely
This list? It’s just a small piece of what I’ve been working on. There’s so much more. Go check my profile, see the results for yourself. My goal is simple: provide value and help you win. If you’ve got questions, I’ve got answers. Let’s get to work!

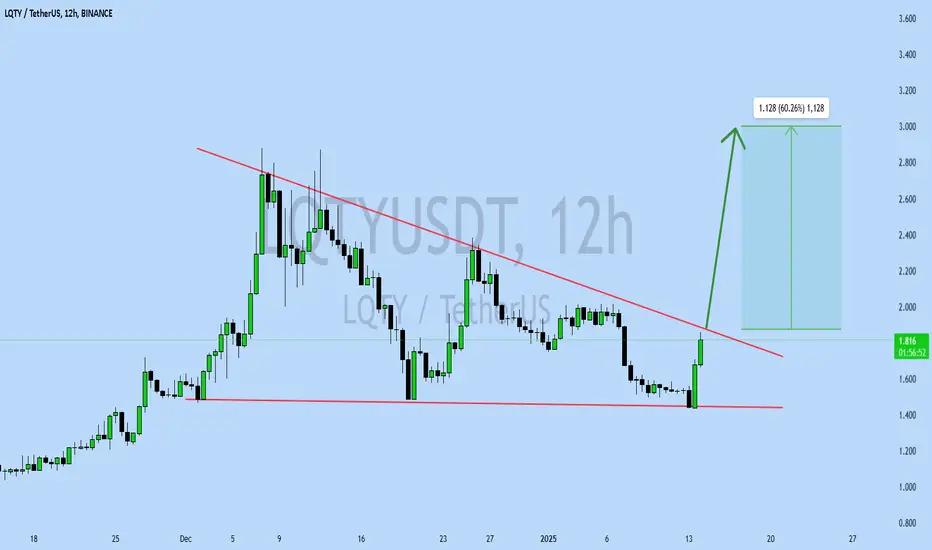
LQTYUSDT UPDATELQTYUSDT is a cryptocurrency trading at $1.830. Its target price is $3.000, indicating a potential 60%+ gain. The pattern is a Bullish Falling Wedge, a reversal pattern signaling a potential trend change. This pattern suggests that the downward trend may be ending. A breakout from the wedge could lead to a strong upward move. The Bullish Falling Wedge is a positive signal, indicating a potential price surge. Investors are optimistic about LQTYUSDT's future performance. The current price may be a buying opportunity. Reaching the target price would result in significant returns. This pattern typically leads to a strong upward move.
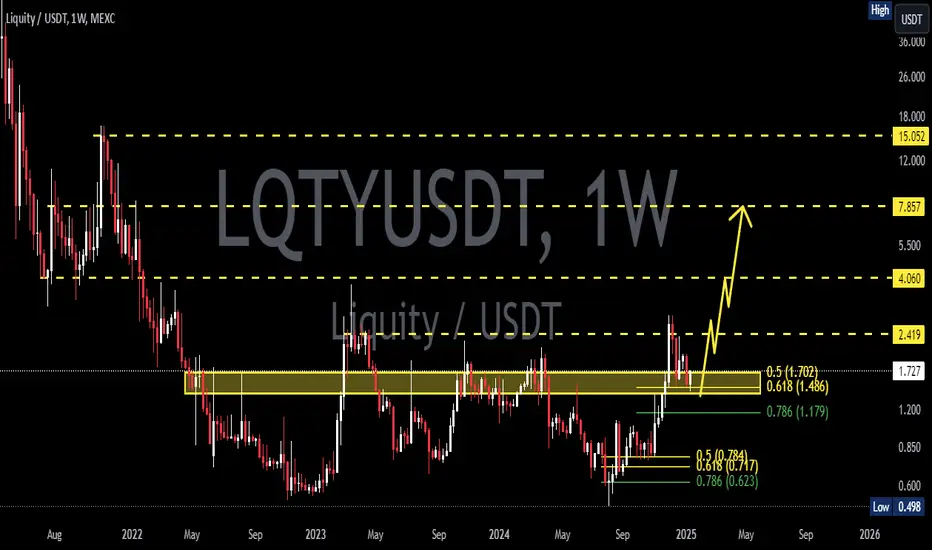
LQTYUSDT 1WLQTY ~ 1W
#LQTY So far it continues to maintain its bullish structure. Buy gradually within this support block, with a minimum target of 20%+