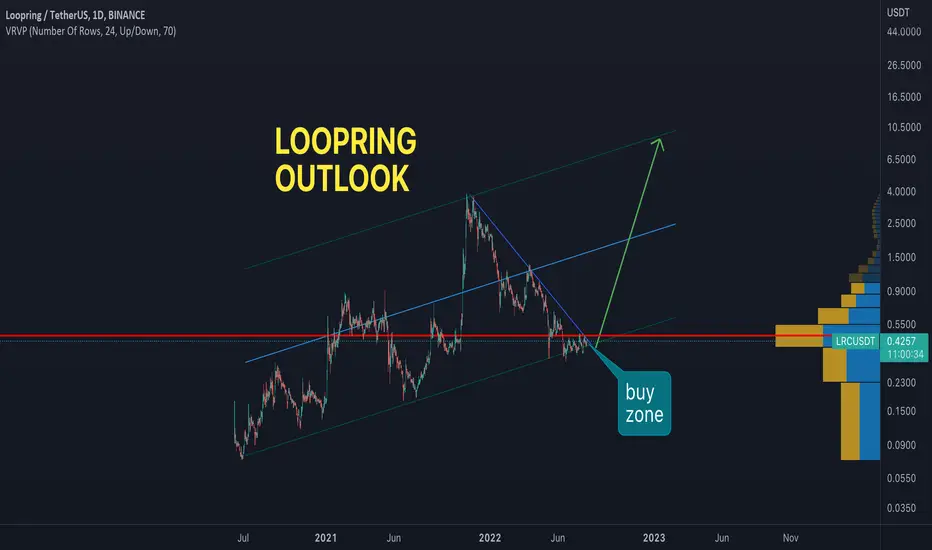
LRCUSDT , ACCUMULATION BULLISH RALLY?
Hello Traders,
Before we start to discuss, I'll be so glad if you share your opinion on this post's comment section and hit the like button if you enjoyed it.
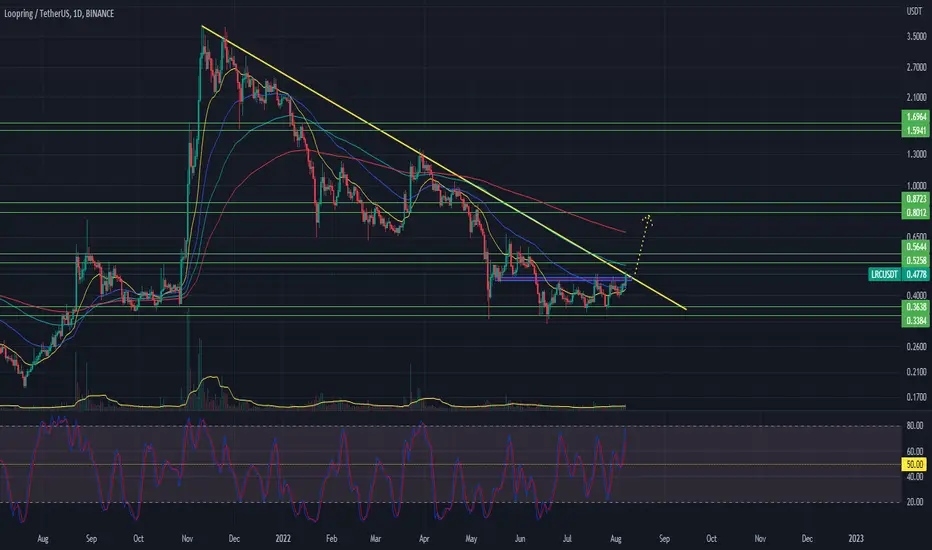
- Looking at how LRC is moving on the 1D time frame chart is tell us that the price is about to breakout from the upper trendline resistance with a decent amount of volume , price was accumulating for a decent time on
support level 0.3300$ - 0.3600$ which tell us that buyers have an interest to take the price higher towards the nearest strong resistance level 0.5200$-0.5600$ and progressively higher
- If buyers succeed to break the trendline then we might retest it and go from there , we can ride the breakout or wait until it's confirmed and take a long position from there with a suitable risk to reward ratio , please
manage to put your stop loss far from the market noise in order to avoid stop loss hunting.
- If buyers failed to breakout then we can have a small pullback towards old support level 0.3300$
LRCUSDT trade ideas
$LRCis it time to send everything ?
ranging between the blue lines
2 weeks ago it poked above where it lost support from or the LH and now imo has retraced and ready for the red line which is a shade under the 200 on the daily .
move should happen after weekly close or just before it .
invalidation is below blue line .
Trend line analysis
( #LRC_USDT > 1D )
The 255-day Down Trend line has been reached. I see it as a coin that has a great chance to get a parabolic move. The blockchain that this coin is made of is very useful, so it has attracted the attention of investors. Therefore, if this breakout occurs with a good volume, there is an opportunity to take a futures trade and spot coins.

#LRCUSDT #CryptoEN
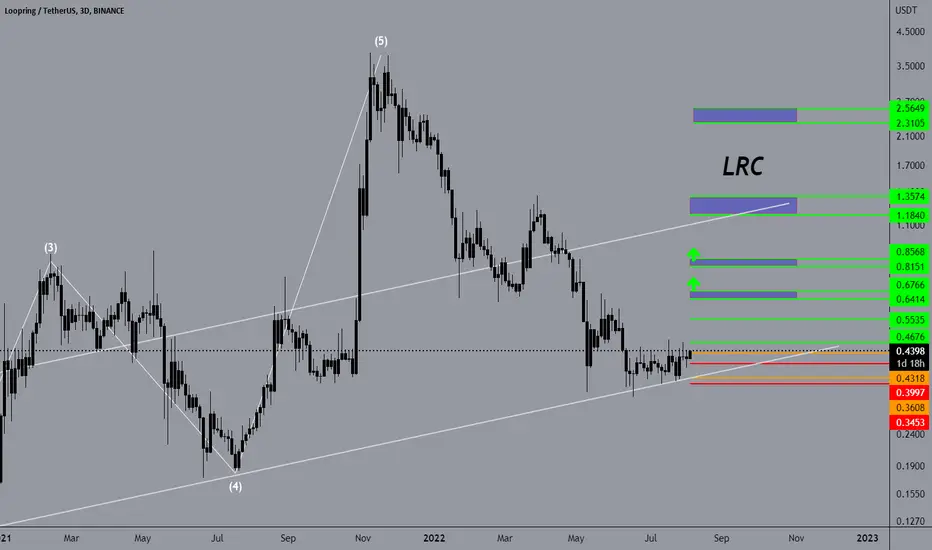
0.4318
0.3608
TP :
TP1: 0.4676
TP2: 0.5535
TP3: 0.6414
TP4: 0.6766
TP5: 0.8151
TP6: 0.8568
TP7: 1.18
TP8: 1.35
TP9: 2.31
TP10:2.56
SL : 0.44 .. 1 day close
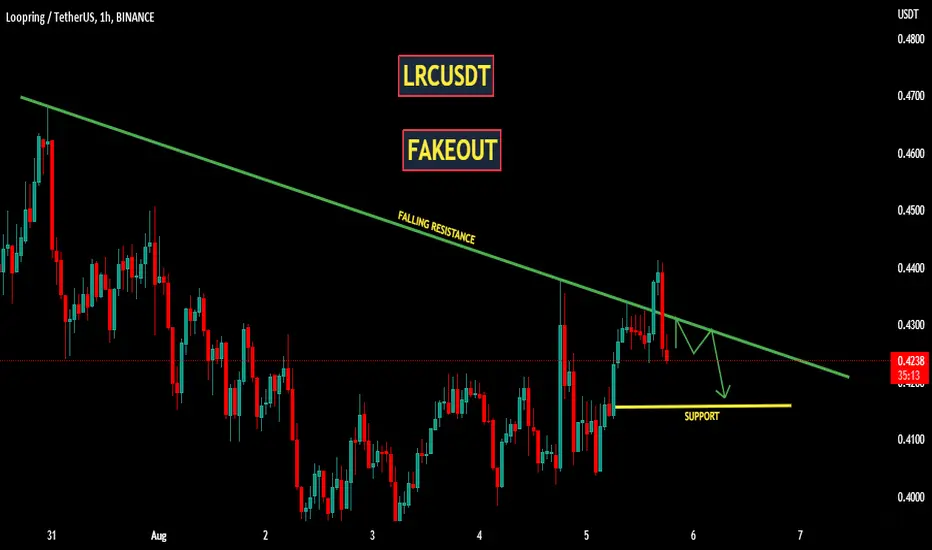
LRCUSDT | FAKEOUTLRCUSDT has broken above the falling resistance and price failed to sustained above the resistance. Now price is holding a key support level, So bulls need to break above the falling resistance, and price must sustained above it. while bears are in party below the falling resistance.
Manage your trades accordingly.
LOOPRING - BUY TRADE IDEALOOPRING just resting around my lower channel support and around the Volume Point of Control
Good point to buy imo
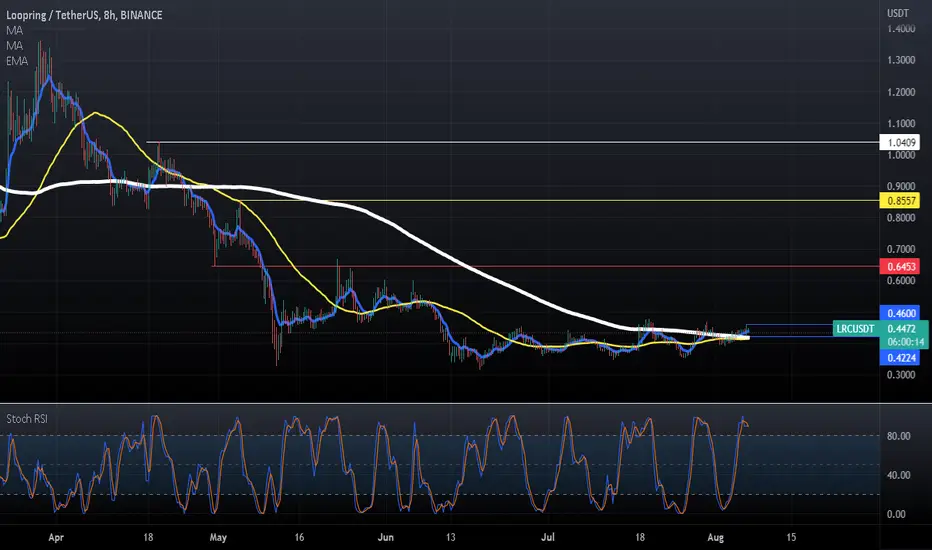
Loopring longLoopring broke trough off the upper boundary of descending channel. Asset bounced off the support level. Bullish movement to resistance level at 0.463 is expected to happen.

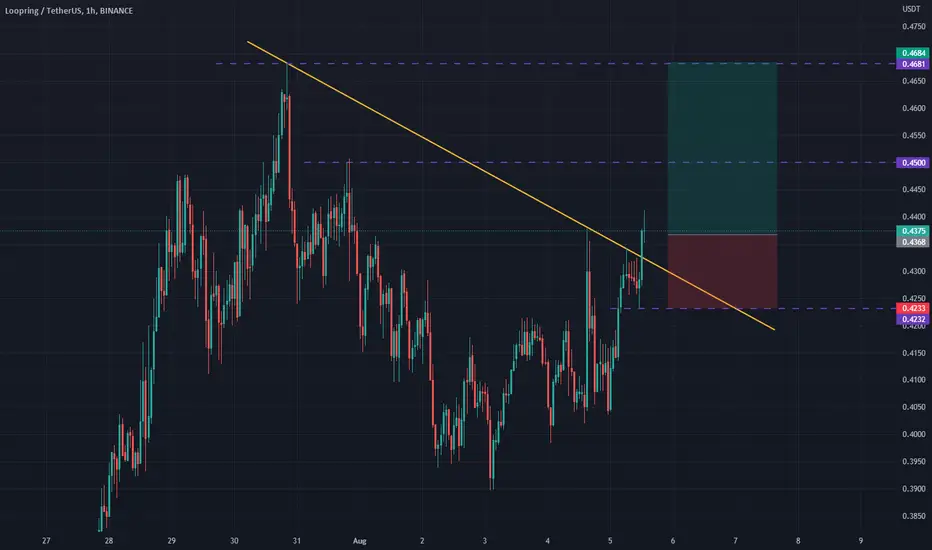
#LRC breakout$LRC - 4h Chart
Entry: 0.4270$
Stop-Loss: 0.4110$
Target: 0.5110$
Risk Reward Ratio: 5.0

#LRC/USDT - Long - Potential 184.01%#LRC/USDT - Long - Potential 184.01%
Exchanges: Binance
Signal Type: Regular (Long)
Entry Zone:
1) 0.4165 - 0.4516
Take-Profit Targets:
1) 0.6140 - 25.0%
2) 0.8052 - 25.0%
3) 0.9613 - 25.0%
4) 1.2798 - 25%
Stop Targets:
1) 0.2987 - 100.0%
Entry Trigger - DEX's seeing a renewal of interest and volume. Loopring looks ripe for growth if DEX tokens see a pump with long term bullish technicals with a huge RSI trendline break & room for a retrace to fill the entry zone.
Trailing Configuration:
Take-Profit: Percentage (1.0%)
Stop: Breakeven -
Trigger: Target (1)

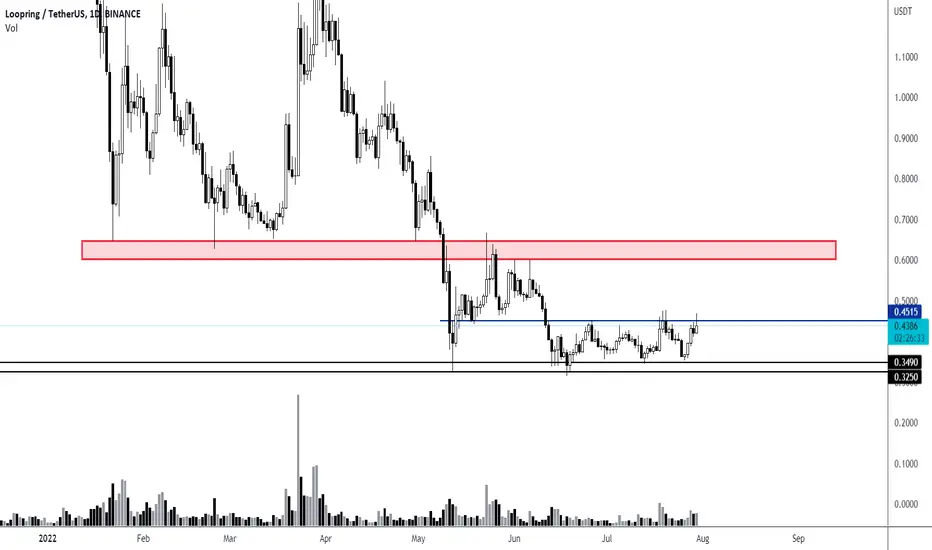
LRC Support & Resistance's>>>>>Hello EveryOne
I Have Tried My Best to Bring the best Possible outcome in this Chart.
We can see head & shoulder pattern's in the chart, must break's neckline at the first,..
In the case of broken down trend line in Daily-T frame, and completed pullback
We can entry long trade setup till Red Area Resistance's>>>>>>>>>
Short term support & resistance's marked on the chart.
This is not financial advise.
PLZ DYOR
With hopping success>>>>

CRITICAL level to watch for LRC- super BEARISH scenarioif LRC failed to hold above CRITICAL LEVEL, 60% downfall is expected in very short interval. Stay Cautious.

Loopring-USDTPamp Coin. Since the last high the price has corrected by 90%.
The price is moving in a downtrend, now an attempt to equalize the local trend.
It is possible to consider a speculative trade in case of price fixing above 0.4 or from support 0.36 at its (confirmation, i.e. rebound from the level). Targets are 0.51 and 0.6.
Stop at consolidation below 0.36, or based on your risk profile.
1D
If you liked this stuff, then like and subscribe, so you don't miss anything.
Always use STOP, and do not use a leverage higher than x3.
A trader must always have tomorrow.
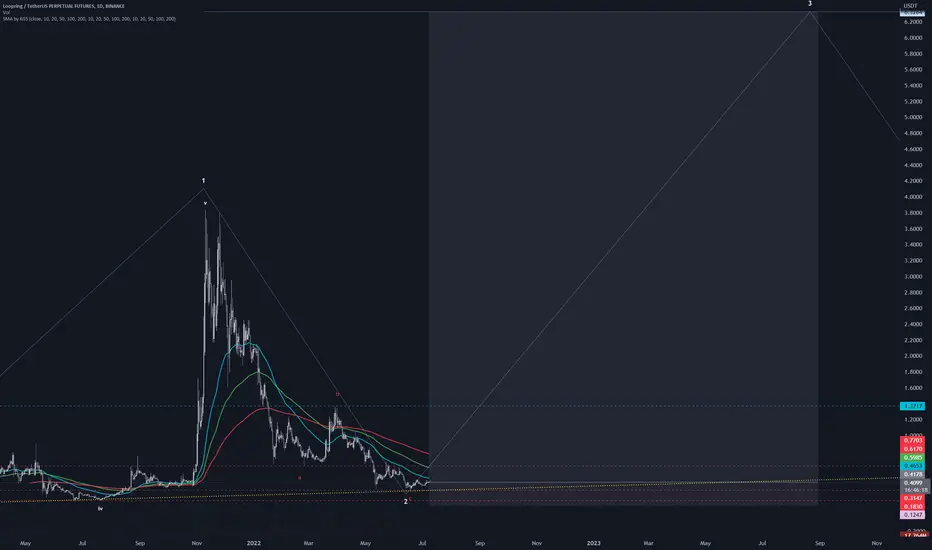
LRC_USDT elliot wave theory
RR: 21
Possible upside: 1400%
Possible downside: 70%
. A break above the blue resistance will confirm bullish uptrend.
. Not financial advice.
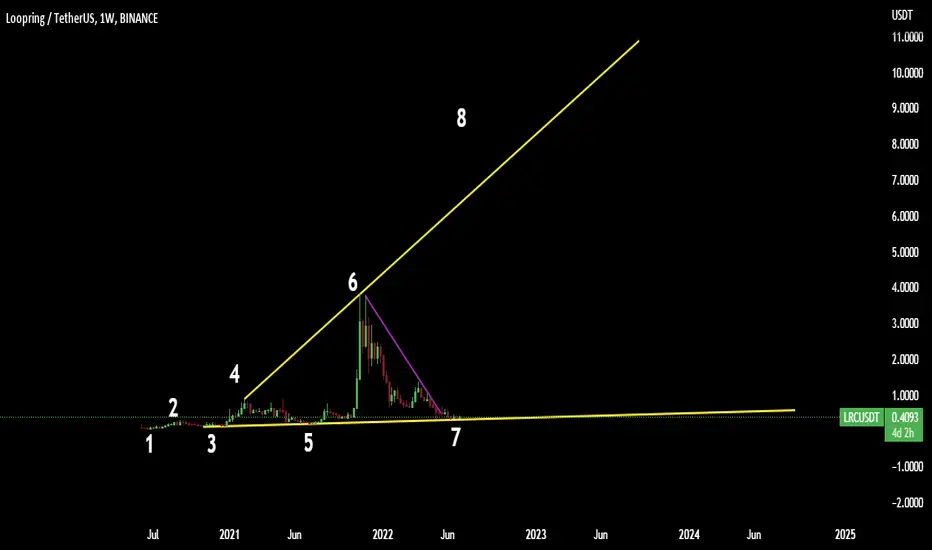
LRC/USDTesting/tracking elliot wave theory. Please do not trade off idea without S/L. Not financial advice.
RR: 21
Possible upside: 1490%
Possible downside: 70%
The three green thick lines are the accumulation zone. A break above the blue resistance will confirm bullish uptrend.
I Believe this is a trapThis looks like a bull trap to me. LRC should hit 24ish cents before we see and uptrend again, but if the global market wants to keep diving we then we definitely see sub 10 cents regardless of the market launch (which sees an obvious boost before another dump).
Maybe the launch will come full with games, movies, big content from big creators/companies? Could that potentially become a "catalyst''?
If it's just useless, ugly photos/gifs at launch then we most definitely will continue to dump.
Terrible time to have to be hyping a launch.
My quick two cents on the situation before August, 24 cents, and that one sure thing is the uncertainty with market fear.
BUY when it's best for YOU.

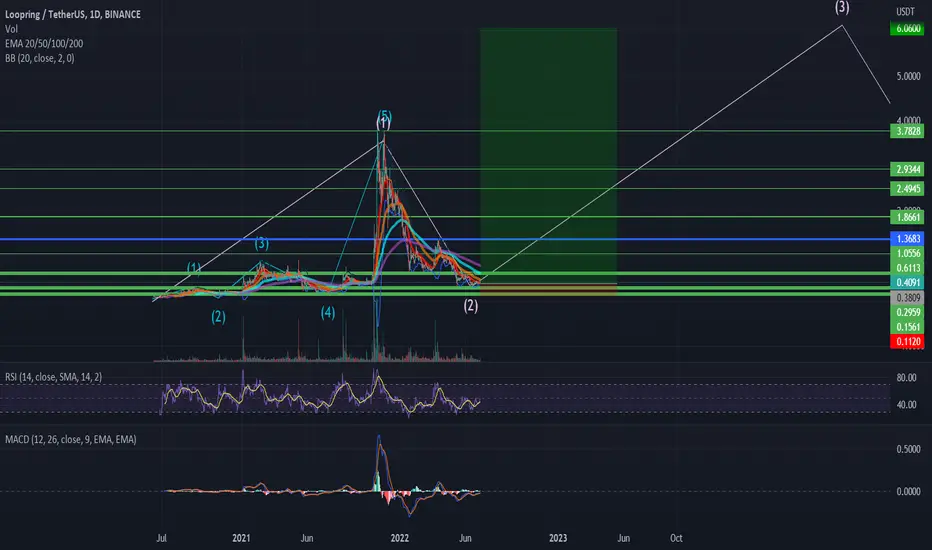
LRC/USDT: On key support waiting for bullish reversal---- Mid-term Analysis for the next coming 4 weeks to 3 months - Daily on Daily Chart (LOG)-------
LRC/USDT: On key support waiting for bullish reversal
Context
- The Global Crypto market leads by BTC and ETH is still evolving within a bearish market configuration. Like the others digital assets LRC (Layer 2) suffered about negative global market situation
- LRC is expected to show some bullish pre-signal soon (looking at 50% area on RSI or divergence)
Market configuration
- Graphical Elements :
Graphical Resistance = 0,7220 & 430
Graphical Support = 0,0710
- Mathematical Indicators:
EMA ( Exp Moving averages) are still capping the market at 0,7220 = Bearish
RSI indicator (below) is below trend line and 50%, bouncing off key support but no divergence = Bearish/Neutral
- Elliot & Harmonic Wave (Fibonacci):
Fibonacci Target C (B) is set at = 0,3260
Fibonacci resistance of the wave in progress = 0,7220
Fibonacci support of the wave C (B)(max extension) = 0,23
Fibonacci Bullish Target = 1,1220
Conclusion
Preferred case => Regarding the mid-term element, LRC is expecting to do a bullish reversal from the area we are now. However the lack of bullish element from mathematical indicator is still showing a potential last downleg risk to max 0,23 before going up to 0;7220 and 1,1260
Alternative cases => Breaking 0,23 a significant drop will open the door towards close 0,0710 = crash

LRC/USDT : Loopring bullish presignal on goingLRC/USDT : Loopring bullish presignal on going
Context :
Following the last past week bearish price action on the crypto space, the LRC - Loopring, an interoperability solution L2 for CEX/DEX, was evolving within a bearish trend before reaching the key Fibo and auto similar move (Blue arrow) potential at 0,65 (// 28,800 - 32,400 area BTC) - Today with a strong bullish price action the LRC reached 1,24 area the bullish upside confirmation level to break to open a larger rise towards the next target.
Im really confident to see all the coin around interoperability chain / bridge surging this year ( ex: BICO, CELR, LRC,GRT,KSM...) it is a strong thematic...
Tactical view 3 to 6 weeks
buy any dips (1,00/0,95 perfect area) above 0,65 to play a break above 1,24 and play freelunch at 2,60 and and test of the former top in extension
Enjoy my friend !
(And don't hesitate to have a look to my website in signature we have nice giveaway/contest on going with the launch of our app in the next days :) )

LRC - Waiting for trendline to breakdownReasons to take short
⭐️ We are in a bear trend
⭐️ Trendline is clean
⭐️ Trendline is 10 days old
⭐️ Volume at top
⭐️ Pullbacks are getting smaller
⭐️ 4th touch
⭐️ 45 ATR
Will enter when price squeezes to the level on 5m timeframe, the base will form and the strip will get faster.
If you don't understand the previous sentence, just use swing stop-loss 3-5%
Fix profit by parts:
1% - 1/3
2% - 1/3, stoploss to breakeven
What's left, hold to the maximum
What do you think of this idea? What is your opinion? Share it in the comments📄🖌
If you like the idea, please give it a like. This is the best "Thank you!" for the author 😊
P.S. Always do your own analysis before a trade. Put a stop loss. Fix profit in parts. Withdraw profits in fiat and reward yourself and your loved ones

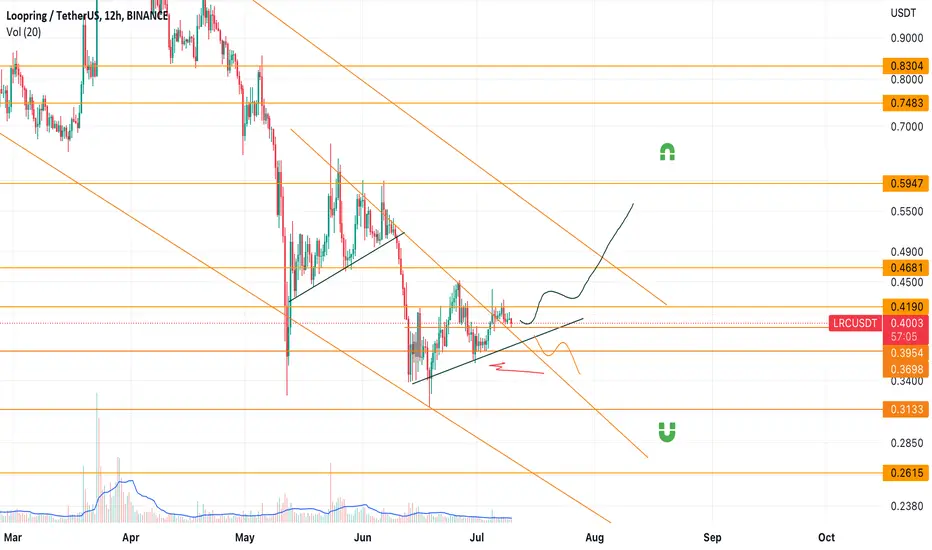
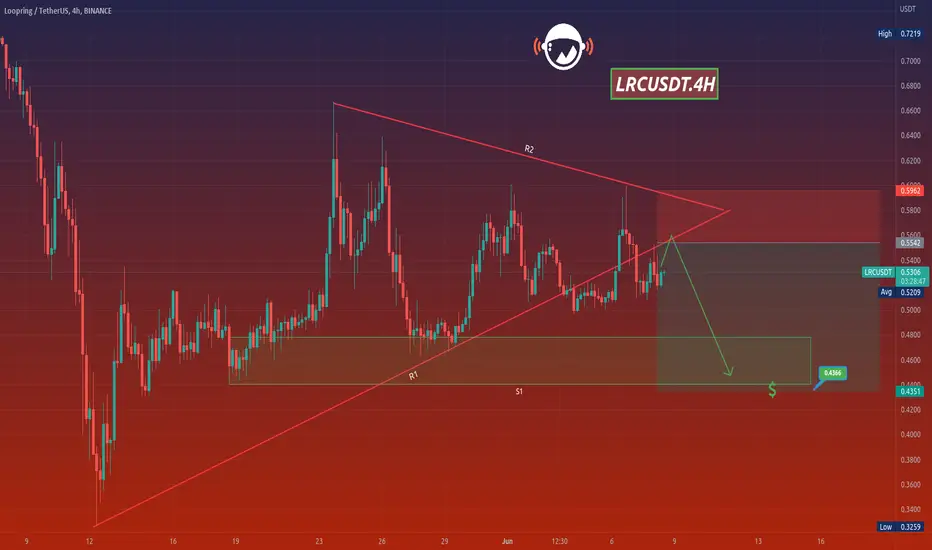
LRCUSDTHello Crypto Lovers,
Mars Signals team wishes you high profits.
This is a 4-hour-time frame analysis for LRCUSDT
The price is moving in an ascending channel and after being rejected by R2, it had a fall toward R1 (used to be a support line) and then continued its fluctuation over this line. By the time the price was able to rise over R1 again and touching R2 and by the existence of some shadows below this line, we can say that the sellers sold their currency and there were few buyers at this point; so the price faced another decline. Now the price is fluctuating below R1 and we expect a rise for it up to R1 and then more fall toward the bottom of S1. This scenario is more probable to happen. But in case the price is able to move to the corner of our triangular pattern and then rise over R2, then we will have more rise for it.
Warning: This is just a suggestion and we do not guarantee profits. We advise you to analyze the chart before opening any positions.
Wish you luck
LRCUSD at make or break it area! keep an eye on it 👀 if we break below strong support shorts take over once again, but a bounce should send us back to .56-.59-.62
