Loopring (LRC) - May 31hello?
Traders, welcome.
By "following", you can always get new information quickly.
Please also click "Like".
Have a good day.
-------------------------------------
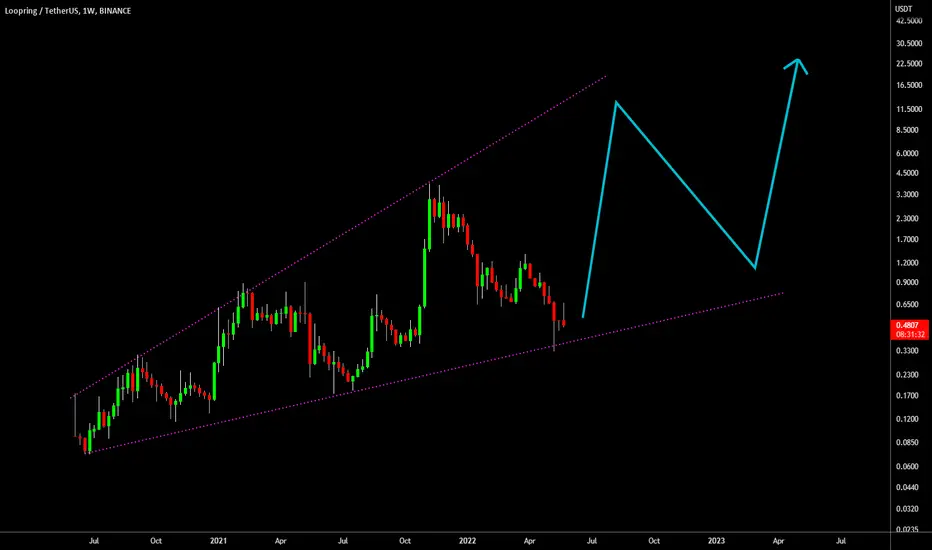
(LRCUSDT 1W chart)
Below 0.6135 is likely to be a mid- to long-term investment area.
Therefore, the key is whether the price holds the price above 0.6135.
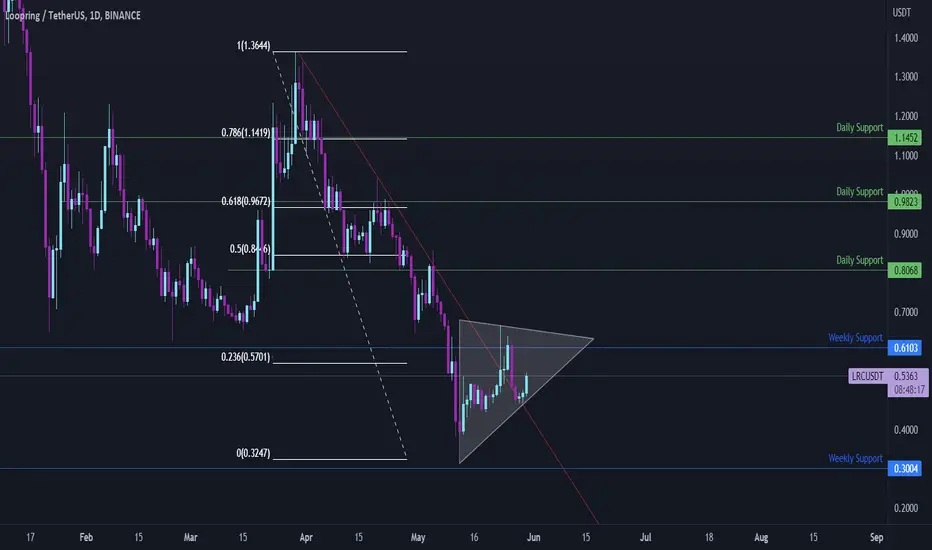
(1D chart)
In the short-term and medium-term perspective, if it gains support above 0.5710, it is expected to turn into an uptrend.
However, since it must rise above 0.6135, it is important to confirm that it is supported by rising above 0.6135.
If it rises above 1.4750, it is expected to surge.
Unlike the stock market, the coin market allows all coins to be made as long-term investments.
However, in order to do this, you must recover the purchase principal and invest only in the amount you hold for the profit.
It's obvious, but it's not an easy way to put it into practice.
If you need immediate profit, it is better to sell 100% to make a profit.
However, if not, I think that if you set your trading method in the direction of increasing your holdings that correspond to your profits, you will have a high chance of getting huge wealth.
This is usually not easy to succeed as it requires a lot of patience.
------------------------------------------------------------ -----------------------------------------------------
** All indicators are lagging indicators.
Therefore, it is important to be aware that the indicator will move accordingly as price and volume move.
However, for the sake of convenience, we are talking in reverse for the interpretation of the indicator.
** The MRHAB-T indicator used in the chart is an indicator of our channel that has not been released yet.
** The OBV indicator was re-created by applying a formula to the DepthHouse Trading indicator, an indicator disclosed by oh92. (Thanks for this.)
** Support or resistance is based on the closing price of the 1D chart.
** All descriptions are for reference only and do not guarantee a profit or loss in investment.
(Short-term Stop Loss can be said to be a point where profit and loss can be preserved or additional entry can be made through split trading. It is a short-term investment perspective.)
---------------------------------
LRCUSDT trade ideas

LRCUSDT BULL CASE 62% - BEAR CASE 38% - SWING IDEA (2-10 DAYS)Watching LOOPRING/USDT for the next 2/3 weeks
For this trade idea, I have more of a short/mid term LONG Bias.
With an overall long term SHORT Bias.
BULL CASE:
After a little over/under a month of STRONG seller action, I
think we are due a retracement.
(1): Down Trend Line Broken and used as Support
(2): Wedge indicating a break out
(3): Retest of Weekly Support (0.6103) - Possibly tring to regain as Support
(4): With Weekly Level Gained Possible Squeeze to Retest Prior Support Levels
BEAR CASE:
With heavy seller presence we can expect a continuation of the trend
to POSSIBLY trap buyers on a break out and FLUSH to previous
Weekly Support (0.3004)
Possible RETEST of previous daily support (0.8068) and then a flush to
MACRO supports (0.3004, 0.1092)
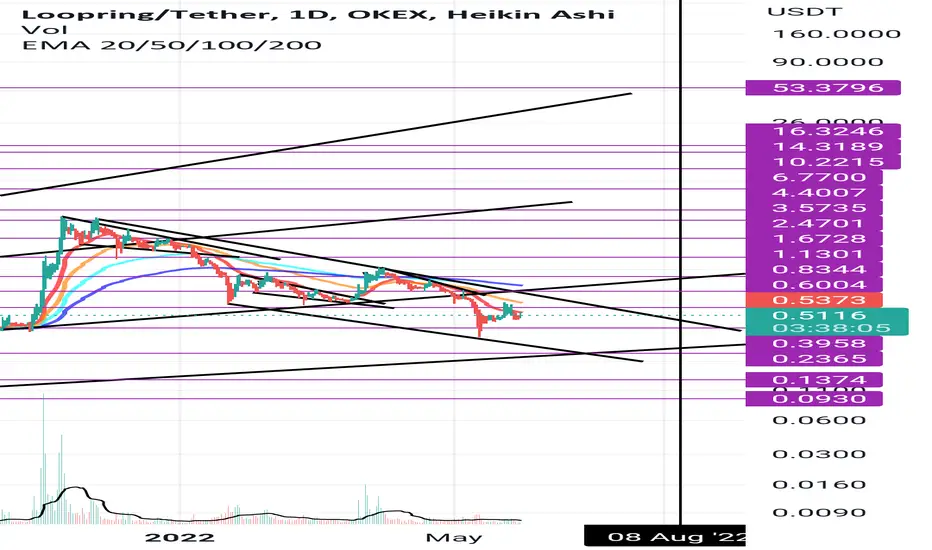
🔥 Loopring (LRC): A Bullish CaseEver since its inception, LRC has been following a bullish megaphone pattern. With the recent capitulation brining LRC towards the bottom support, there's a bullish case to be made for this token.
Be aware that a bullish LRC needs, at the very least, a neutral Bitcoin. Keep in mind that if BTC will continue falling, LRC will likely follow.
Nevertheless, if LRC can pull this pattern off were in for some fireworks for the coming months.
LRCUSDTHello everyone, the target will definitely be hit because it has formed two strong patterns, be successful and professional.
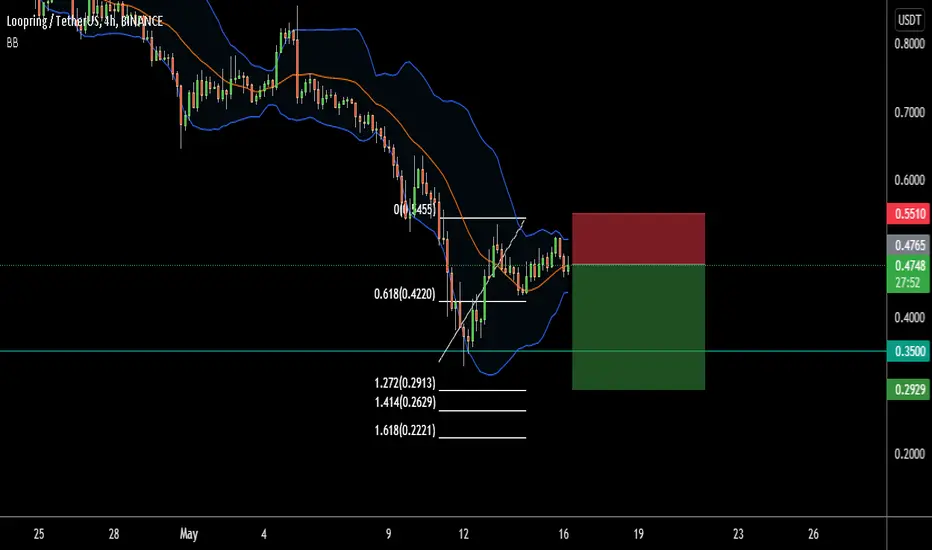
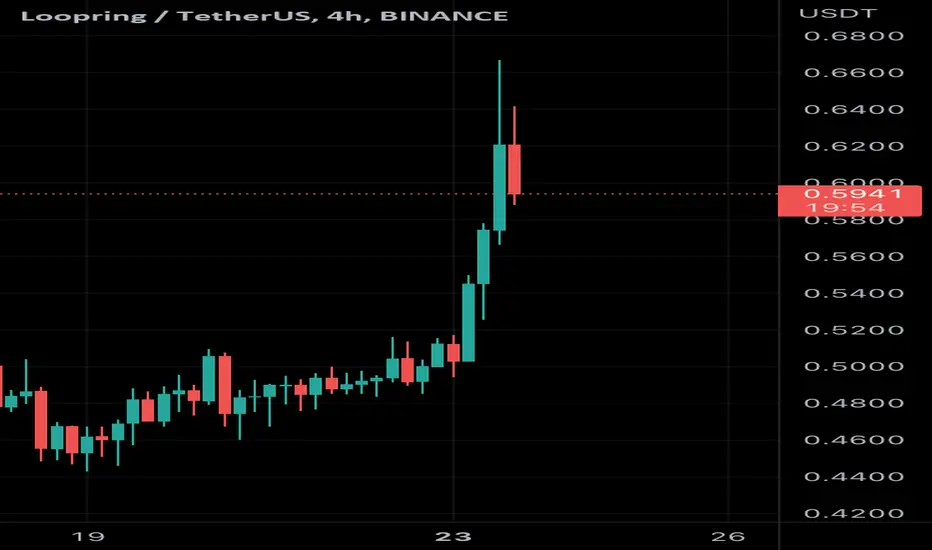
LRC/USDT Adam and Eve PatternLRC/USDT has formed an Adam and Eve pattern. LRC has broken the neck neckline @ $0.51 cents and has retested it before making a move to the upside. Volume is increasing and price action is currently testing the 200 EMA.
Potential move is 61% from the break of the neckline (as indicated on the chart).
TP1: $0.71 -$0.72
TP2: $0.80 - 0.88
Hope you have enjoyed this analysis. Remember nothing is 100% accurate even if you do see this pattern play out. always follow the price action and let the price tell you where the market is heading. Good luck
<<<>>>>>>>>>>

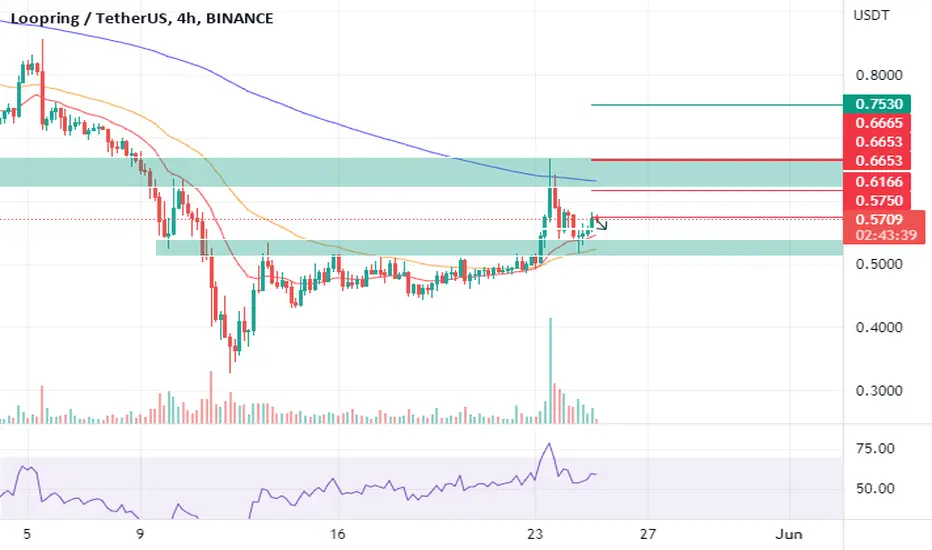
LRC/USDT BUYING SETUP LRC Reject on key support , we can setup entry , potential continue upward movement
BTC rejection to on key support will follow BTC movement
Buy zone : 0.555 - 0.52 - 0.5
Target : 0.5750 - 0.61666 - 0.6653 - 0.7530
Stop : 0.49
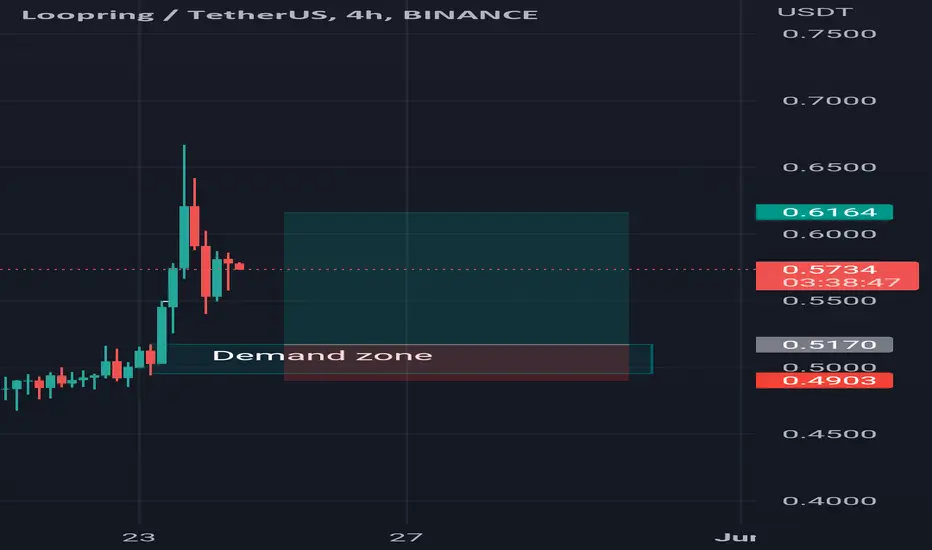
LRCUSDTThere is order block here so once touched then you go to long position and DYOR and use low leverage
Done profit shortDone profit for short LRC tnx for others to follow my later post about short. U ? done for LRC or not?
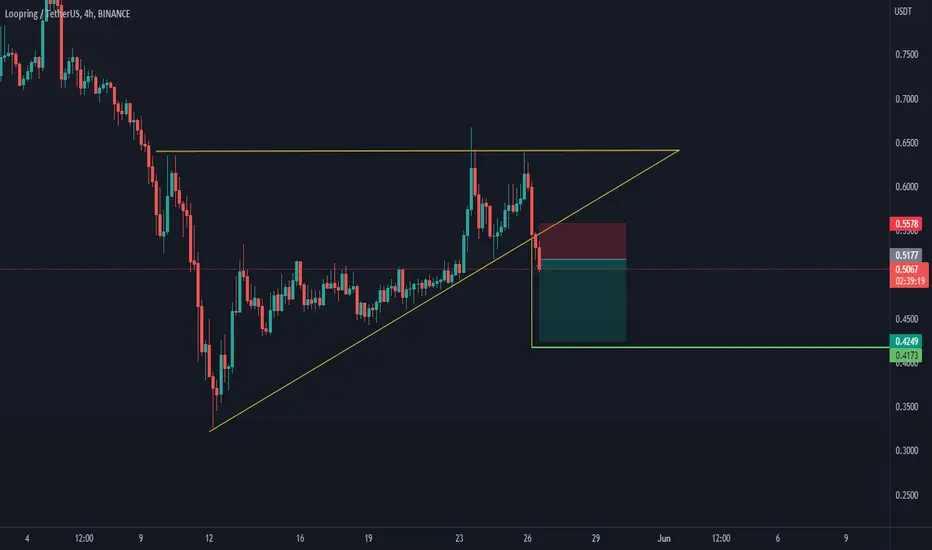
LRC RANGES TO ACHIEVE BOTTOMEntering at yellow lines ,Stopping at red line , Taking targets at green lines . Simple and crisp !

LRC/USDT 1HR CHART UPDATE BY Domino Crypto!!
Hello, community members welcome to this LRC/USDT 1hr chart update by Domino crypto.
Don’t forget to hit the like button if you find this update helpful because this motivates me to bring this kind of update regularly.
Now, Let's get to the chart,
As we can see that above-mentioned chart is evident that LRC/USDT just broke out the neckline of this HEAD & SHOULDER PATTERN which is a bullish pattern.
LRC currently trading at the price level of $0.4750 in support of black MA and retesting the neckline.
LRC/USDT can pump soon so,
ENTRY:
leverage:-5x to 7x leverage
entry:-$0.4700 - $0.4790
target:-40% to 50%
stoploss:- $0.4500
NOTE: This is not financial advice. This is for education purposes only. I am not responsible for the profits or losses you generate from your investments.
DO YOUR RESEARCH BEFORE MAKING ANY TRADES.
Thank you.

Just like that it all changedThe GME marketplace cant save the entire market.
My 3 scenarios for lrc depending on whether bitcoin on the monthly stays strong on 30k band. If it does not I expect a 75% retrace minimum (17k area). I will not sell to rebuy in lower but add in at each resistance down to my original buy in.
Bitcoin at the 17k area would mean LRC would be near that last major resistance of 20 cent area or lower.
IMX looks even worse.
I will post my btc chart in the comments.

LRC ANALYSISHello Traders, here is the full analysis for this pair, let me know in the comment section below if you have any questions or suggestions. I suggest you keep this pair on your watchlist and see if the rules of your strategy are satisfied. Please adhere to good risk management. Also like, follow and cheer, thank you...
NOTE:
MS means Major Support.
CP means Confluence Point.

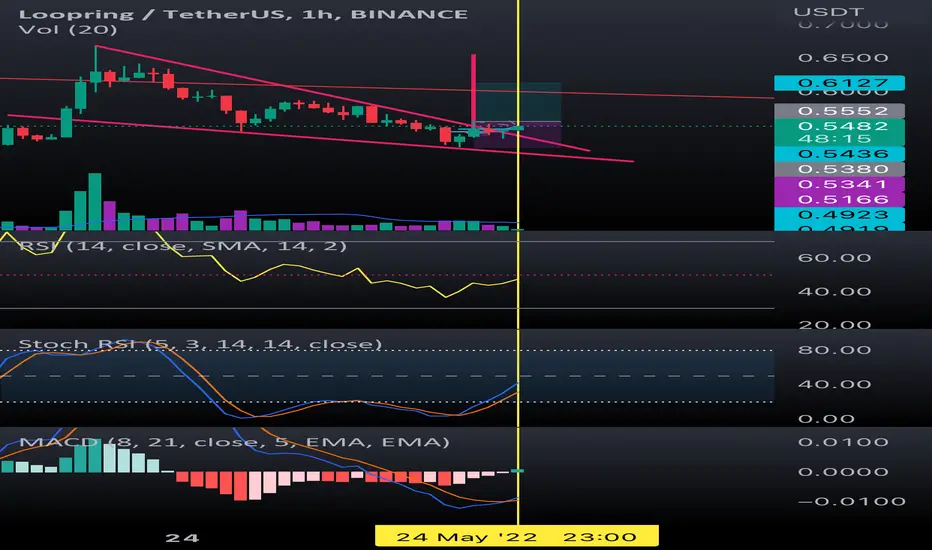
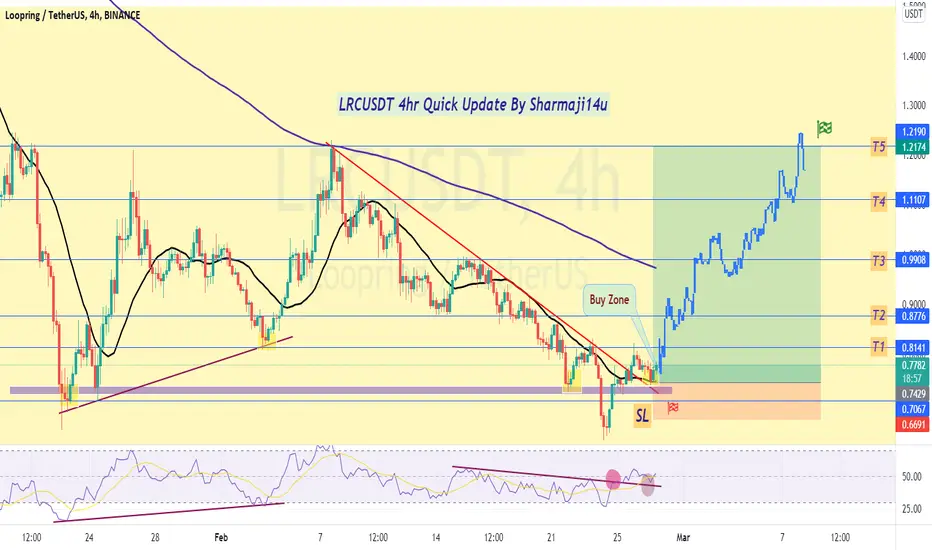
LRCUSDT 4hr Quick UpdateLRCUSDT 4hr Quick Update by sharmaji14u
Big Opportunity in #LRCUSDT
Break The Trend Line & Reteste + Trend Above The 21MA
Also see RSI + MACD also cross over
Target in Chart with SL
I am trying to my best for you guys.
I hope guys you understand this chart
(Not Financial advice)
~~Best Of Luck~~
!! Thank You !!
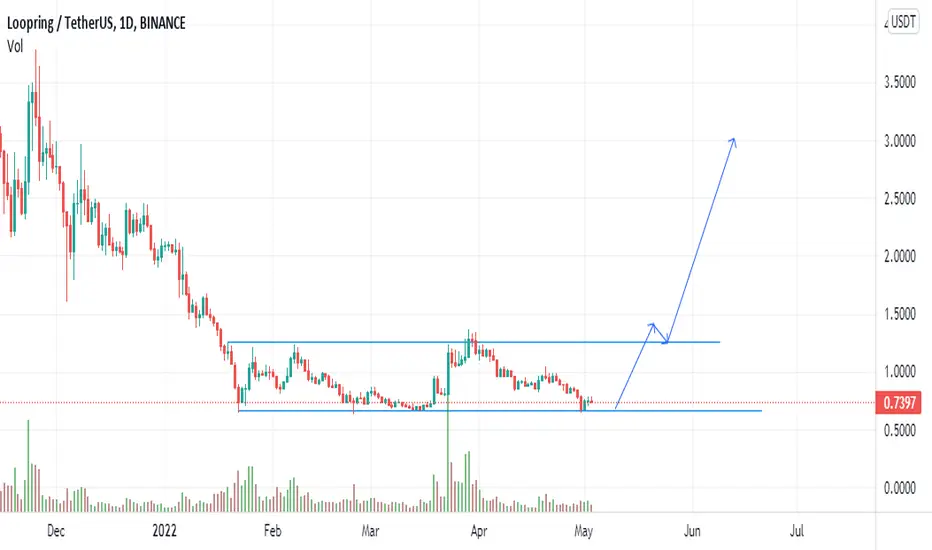
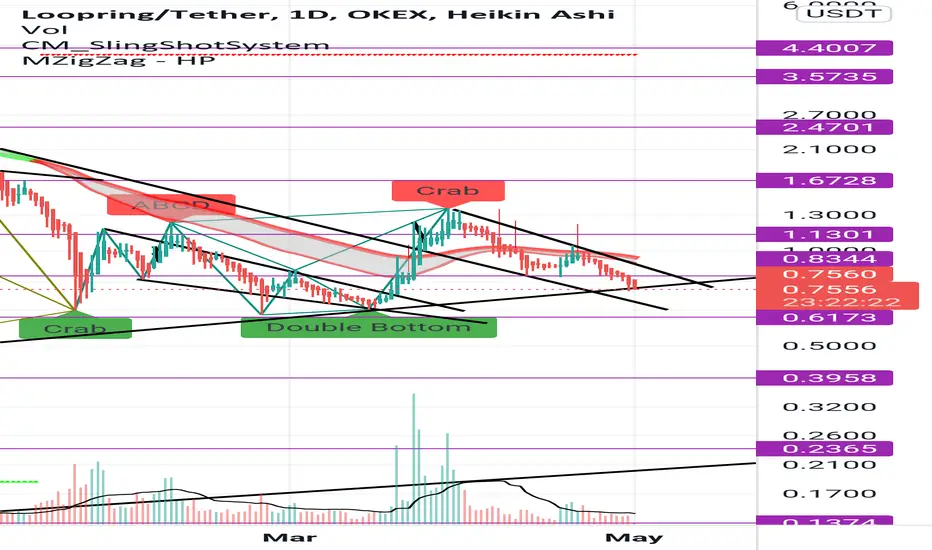
LRC is consolidating in daily timeframeAs we can see LRC has created double bottom pattern and is consolidating in the region of 0.6-1.36 region. Once the BTC is normalized, LRC is going to break 1.36 resistance and boom, gonna make new ATH
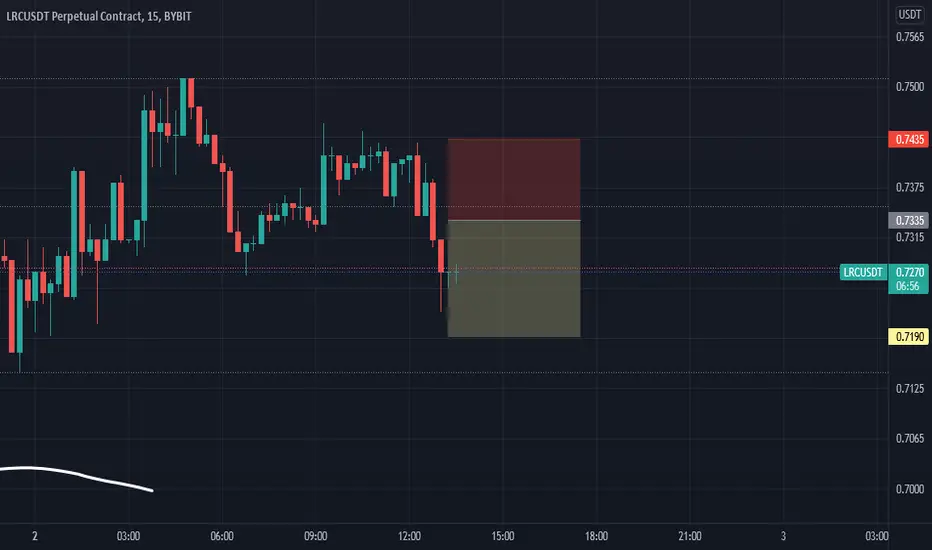
new day new positionyou can see what i expect , LRC should touch my enter and then go down
lets see market decision
LRCUSDT 15 percent profit dont missfor more signals follow us this alt coin on strong support and demand area right now
Crab to take us to 100%Is a Crab taking us to 100% to mimic the previous trend line dip?
Maybe May 5th isnt a launch date?
Still long on LRC.
Loopring seems oversoldLoopring has dropped more than 30% since beginning of this month. It is at fibo 0.78 level and at great support line. Also triangular it created triangular shape.


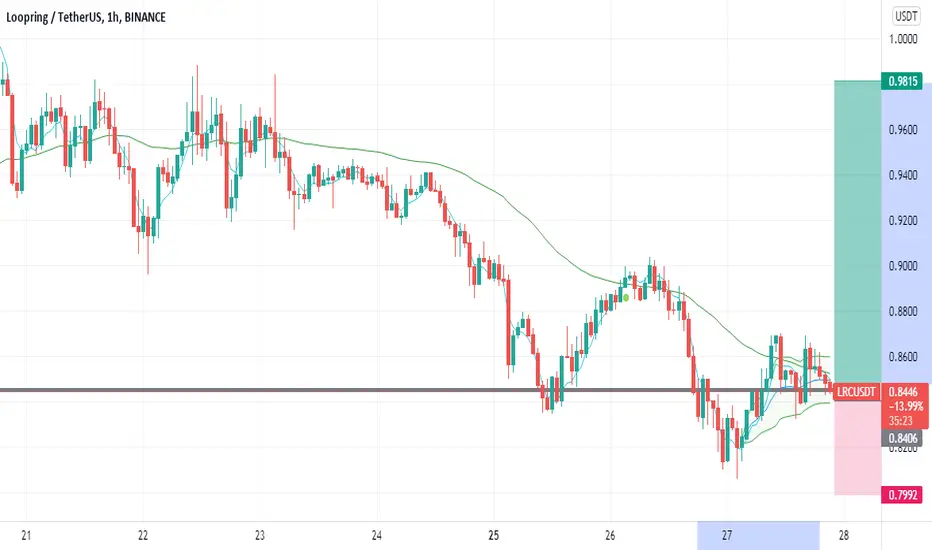
Before see the peak, need to recoverOn daily chart
BINANCE:LRCUSDT is accumulating around 0.82 and further maybe.
Use DCA way for this case
Less risk, high reward
Wait for a breakout descending channel with huge volume, soon.
Next target from 1.9 to 2.1
What next, wait and see my fellas
