LRC MARKET BIASHello Traders, here is the full analysis for this pair, let me know in the comment section below if you have any questions or suggestions. I suggest you keep this pair on your watchlist and see if the rules of your strategy are satisfied. Please adhere to good risk management. Also like, follow and cheer, thank you...
LRCUSDT trade ideas
LRCMy plan remains the same from previous charts.
- Keeping it basic without clutter
- 15 or so indicators I use do point towards a bottom having already happened
- still depends on the rest of the globe no matter what
- no convoluted chart zoom ins
If we break below for a bear market I expect 30 cents. If the market picks up I still expect LRC to go well beyond 4 dollars.

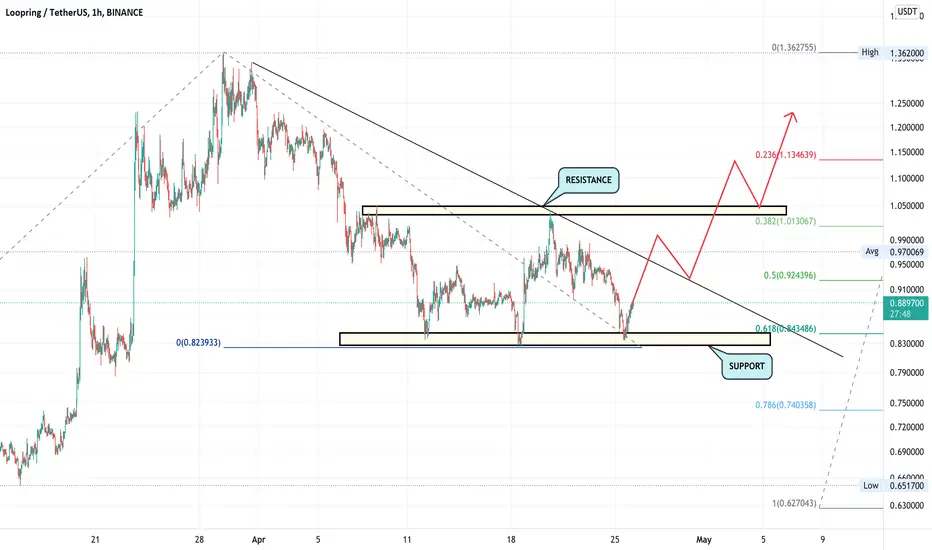
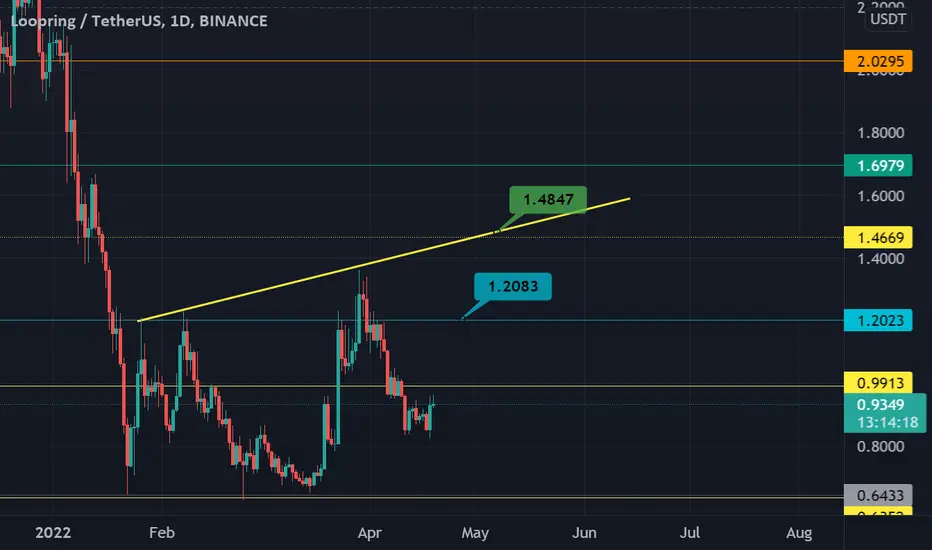
Ready to comeback, $1.8On 1H TF
LRC has found a support at 0.82 which level is a 0.618 Fib of previous surge.
Right now, LRC is swing in range from 0.82 to 1.0, it's also a resistance 0.94
If it can break 0.94, it will challenge level 1.0
What next, wait and see
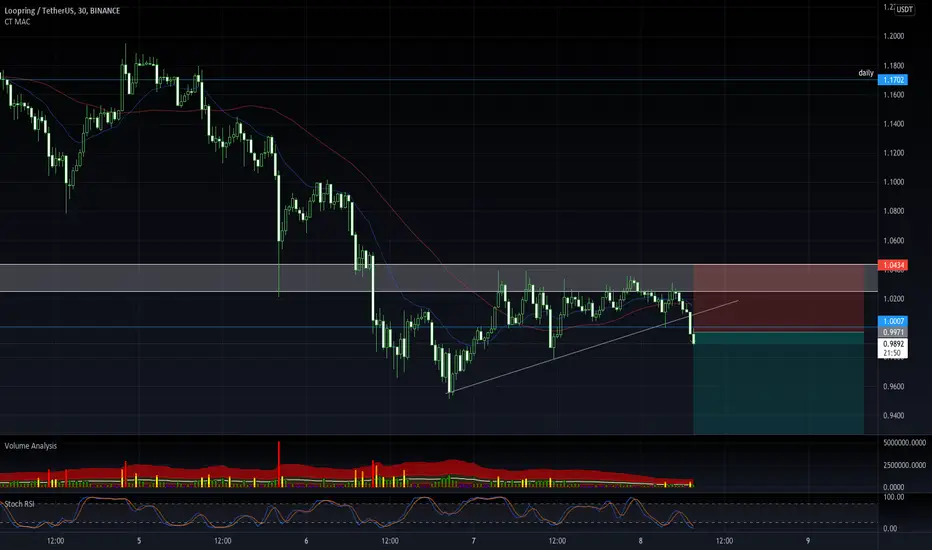
LRCUSDT M30 SHORT Burada yer alan içerik, yorum ve tavsiyeler genel nitelikte olup hiçbir şekilde yönlendirici değildir. Bu öneriler finansal durumunuz ile risk ve getiri tercihlerinize uygun olmayabilir. Bu nedenle sadece burada yer alan bilgilere dayanarak yatırım kararı vermeniz beklentilerinize uygun sonuçlar vermeyebilir.
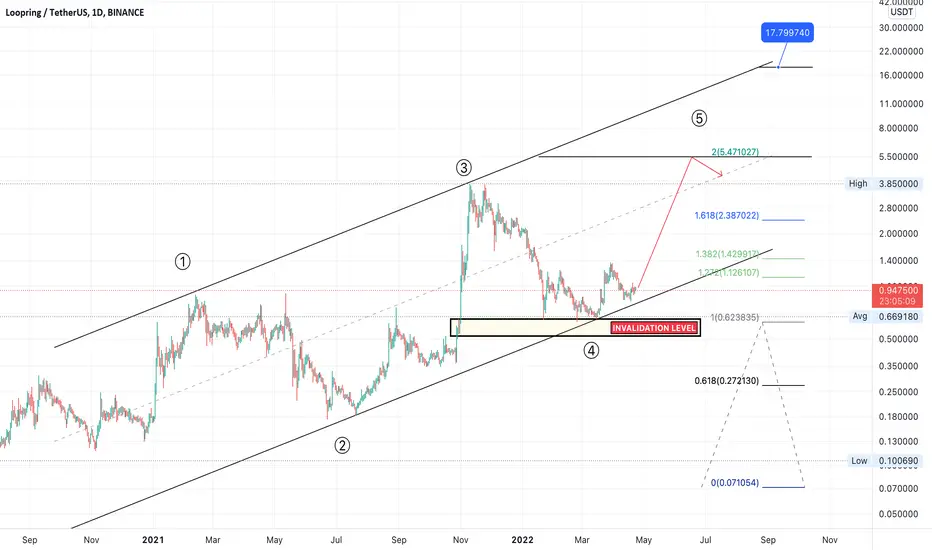
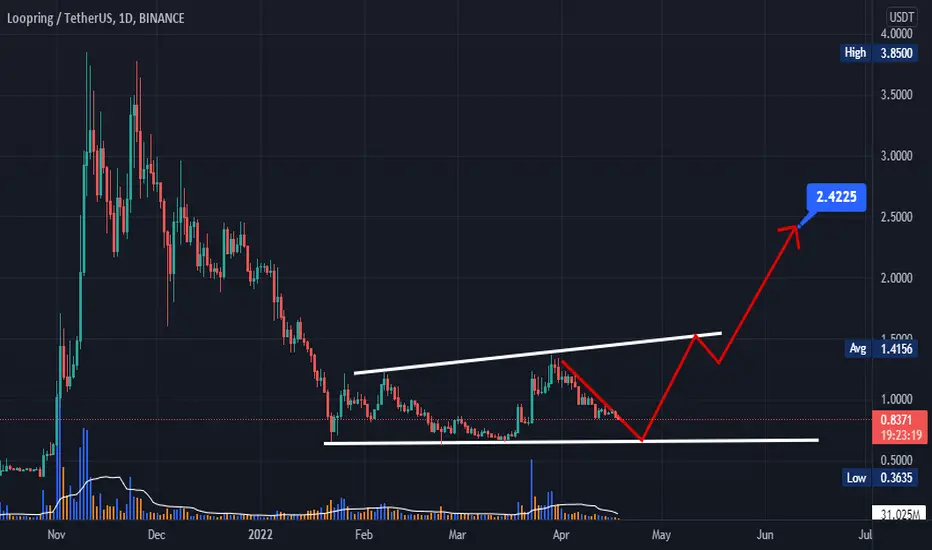
The final wave is coming, huge profitOn daily chart
Loopring has completed four waves at 0.63 after that, LRC's rally.
Right now, the lower impulse wave is progressing. Target is 1.8 in short-term
LRC's high volatility, which suit to trade in lower timeframe.
LRC is still in ascending parallel channel with strong support below 0.63. This range is a good zone to entry for short/medium/long-term.
What next, wait and see.
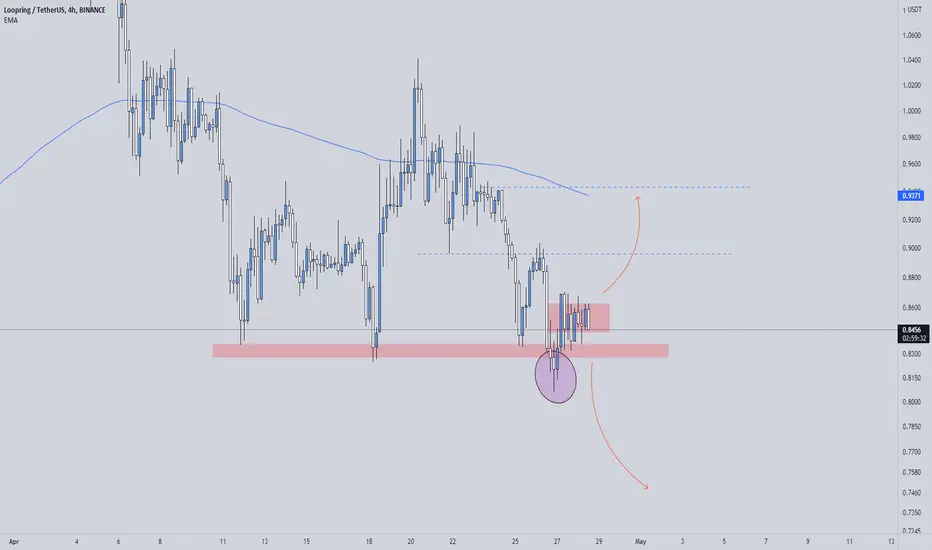
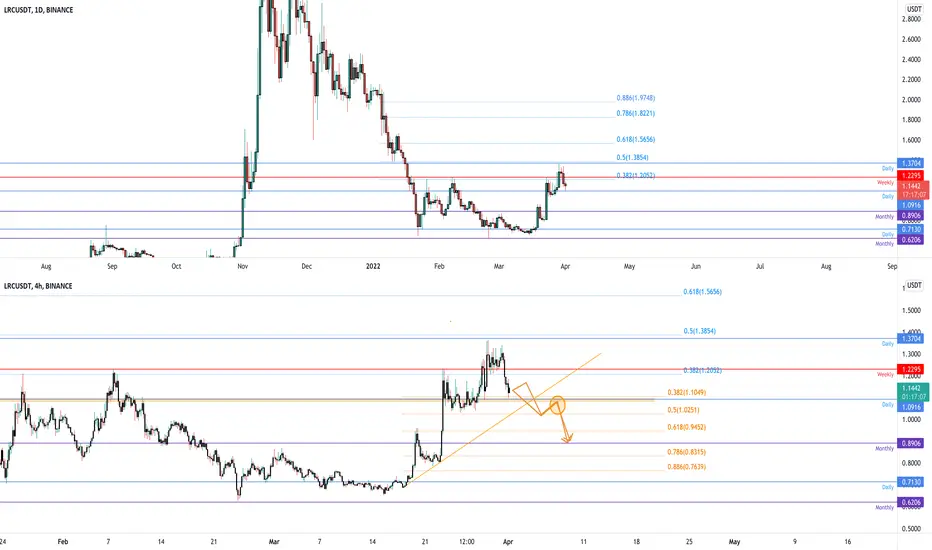
LRCUSDT the price is testing the 4h supportThe price created a triple bottom on the monthly support of 0.62$ where the market found liquidity for a new bullish impulse. On the daily timeframe, the price got a rejection from the 0.5 Fibonacci level exactly on 1.37$.
pon the 4h timeframe the price created an M pattern with the double top on 1.37$ and the market lost the weekly support
How to approach?
The price is going to test the M's neckline as new resistance. IF and only IF the price is going to lose the daily and 4h support (1.09$) and retest it as new resistance, According to Plancton's strategy , we can set a nice order. The next valid support could be the monthly support of 0.89$ and 0.618 Fibonacci level
–––––
Keep in mind.
🟣 Purple structure -> Monthly structure.
🔴 Red structure -> Weekly structure.
🔵 Blue structure -> Daily structure.
🟡 Yellow structure -> 4h structure.
–––––
Follow the Shrimp 🦐

LRCUSDT One on the best projects in crypto world !
Keep an eye ! Will be big in the future
If breakout will be a good long !
All will follow BT. At the end so never trade without stop loose !
Not financial advice ! Do your own research
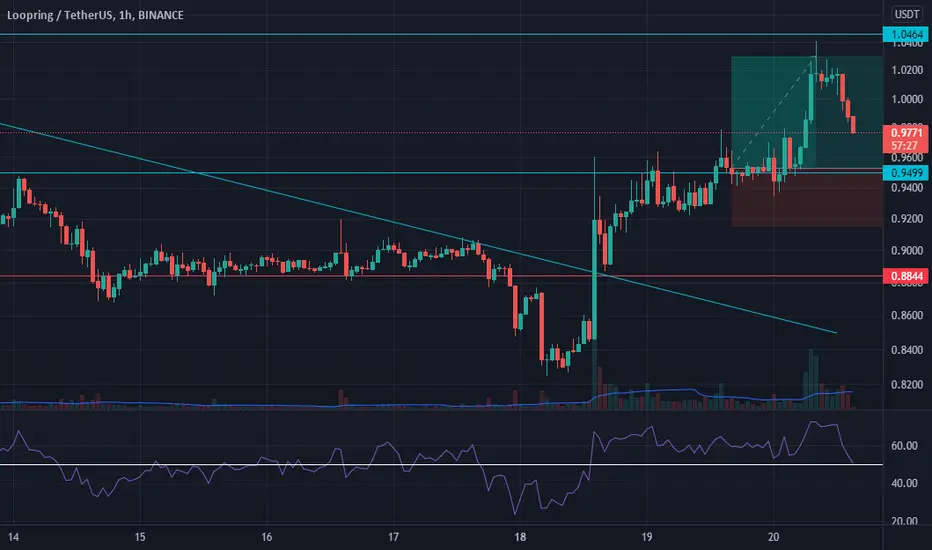
#loopring position closed for +8% my projection played out exactly and released a good 8% profit ON SPOT
no leverage used in any of my calls/signals/ideas
now waiting for a break of 1.05: if that happens I'm interested in placing another long, follow to stay updated on this!
let me know if you enjoyed this call and feel free to ask for other pairs to analyze in the comments or feel free to message me if you have any questions or ideas to share!
LRC buy and holdstl line red
tg 1-2-3
One of an emerging number of decentralized finance (DeFi) protocols, Loopring uses multiple cryptocurrencies, including its own LRC cryptocurrency, to together provide for this platform.
LOOPRING USD REVIEW>>>>>>>>>>>>>>>>Hello EveryOne
With decreasing sales pressure,
Make The position for small profits in spot or future trading.
Price must close above yellow line 0.99 usd
All targets and supports are marked on the chart
This is not a financial advice
PLZ DYOR
With hopping success>>>>>>>
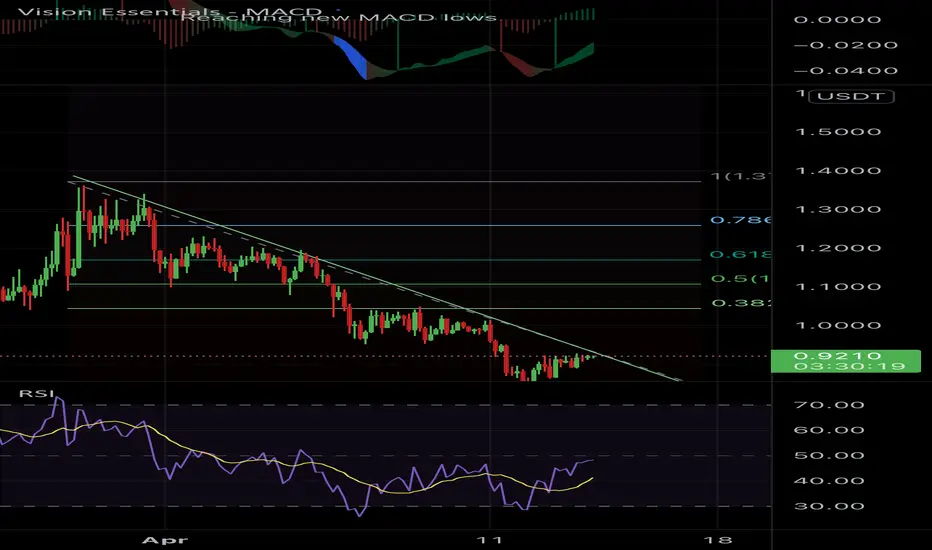
$LRC - trendline breakout + rsi divergenceloopring broke the downtrend, and given this RSI divergence Im only waiting for a 4h candle to close above the 0.95 resistance zone to target 1.04 almost
small profits here, almost a 7% but profits are always profits

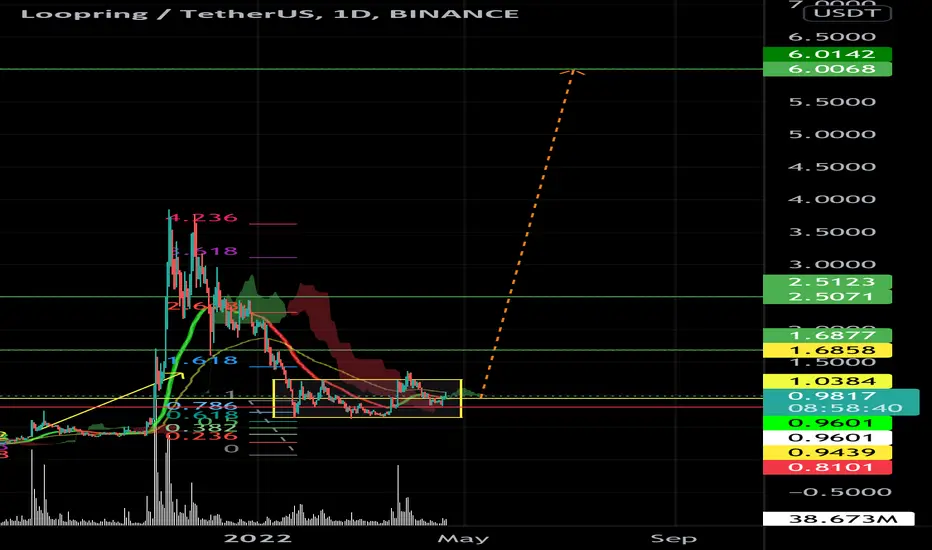
LRC Bullish Long termHodl LRC , Chart Bullish Long term
Target midterm 4$ -5 $
Target Longterm 6.1$ -7 $
Loopring is MovingIt makes sense to trade with the breakdown.
4-hour candle close can be expected.
Entry point: 0.90750
TP: 1.2
SL:0.88
Not a financal advice

Lrc condition!!!Hello my bros....in lrc we have a downtrend channel and this will make a good opportunity if we break this channel....

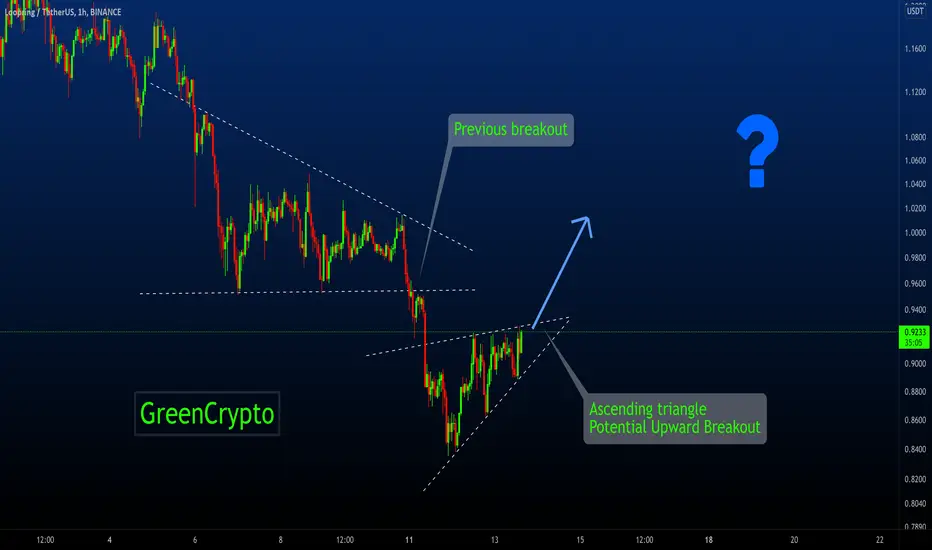
LRC - Ascending triangle breakout - Get ready for the entryLRC is ready for the potential ascending triangle breakout, if the it breakout successfully then we can expect a sharp upward movement.
We will post more updates as price moves.
Like and follow us to receive up to date notifications.
Cheers
GreenCrypto Team
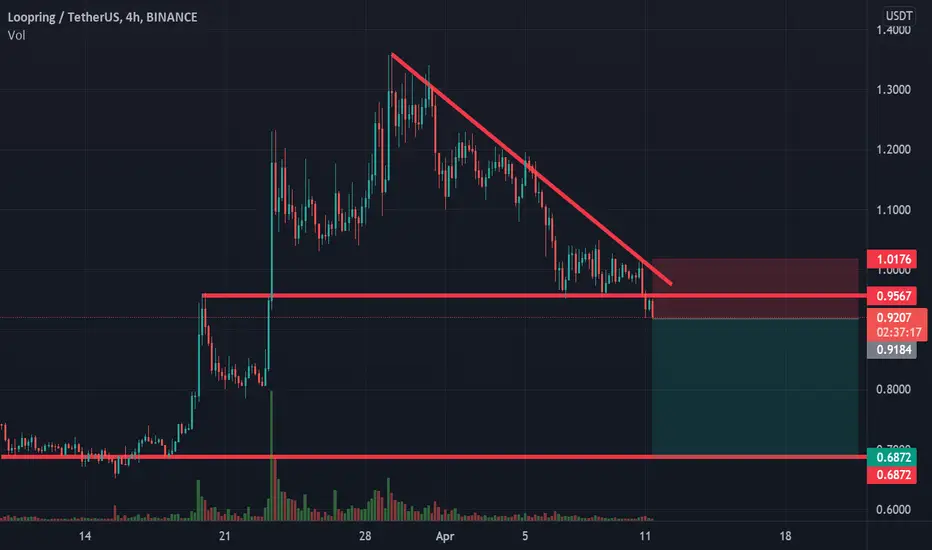
Short on Loopring $LRC$LRC broke through the support level. Bearish movement to support level 0,68$ is likely to happen.
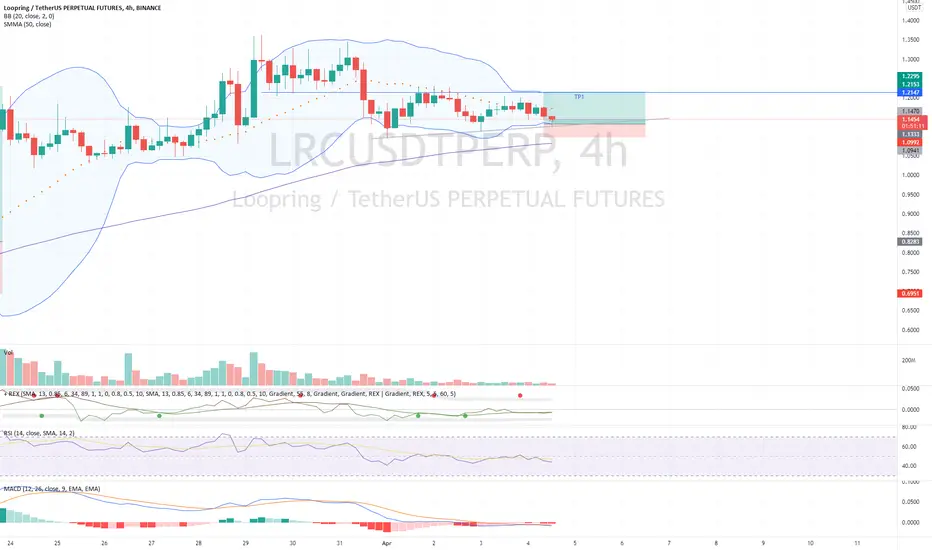
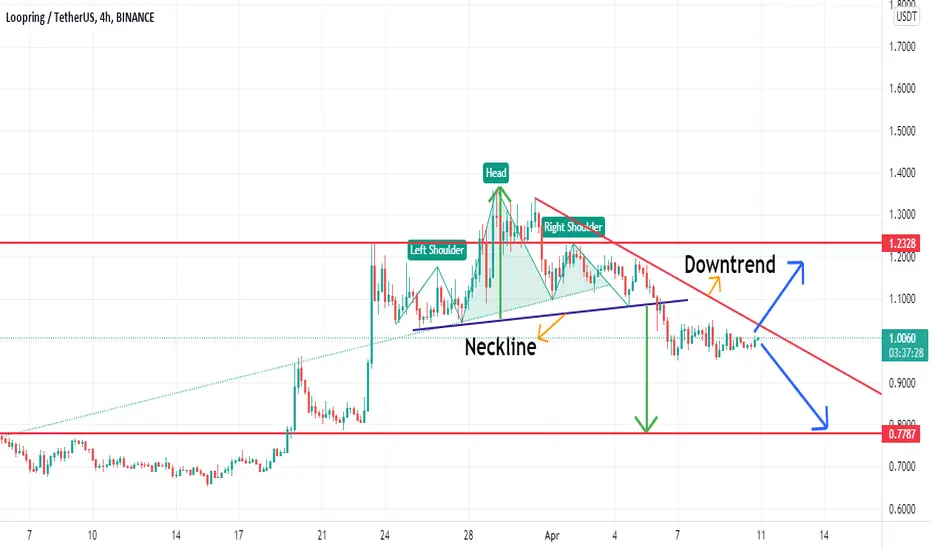
LRCUSDT - POSSIBLE SCENARIOHead and Shoulders pattern is formed on this chart and the neckline is broken, overall it's looking bearish, If the price broke the neckline then the next resistance will be 1.1959, and 1.2328 So watch out carefully.
LRC shortPrice in range on daily chart, had fake out but broke back into range. Price formed head and shoulders type pattern, broke support and retested support turned resistance and 4h 20 day ema. Had a high volume breakout of trend line on 30 min chart, bears currently following thru.
Stop loss: Above chop, above resistance
Take profit: Above highest volitility level of total range, just above a daily resistance level near mid point of range
Head and Shoulders on the LRCUSDTon the LRCUSDT chart, a pattern of Head and Shoulders is formed and the neckline of the pattern is broken, the price is retracing and in case of retest ( pullback ) to the Neckline or Downtrend can made short position for the target specified on the chart.
I hope it will be profitable for you ❤️
Please support our activity with your likes 👍 and comments 📝
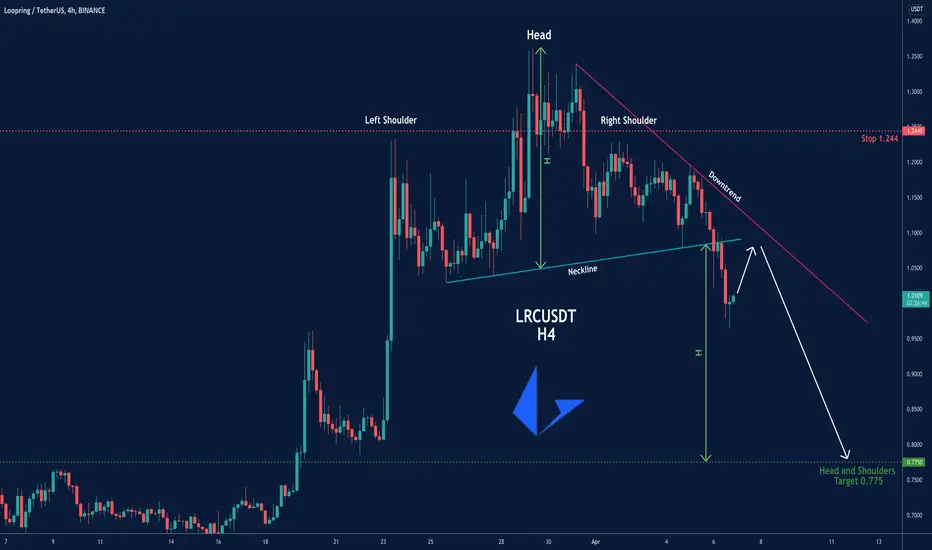
LRC on the declineLRC, after failing to gain positive momentum within the triangle, has broken down and will now most likely continue down to around the ~T1.05 mark or lower to test the weekly pivot.

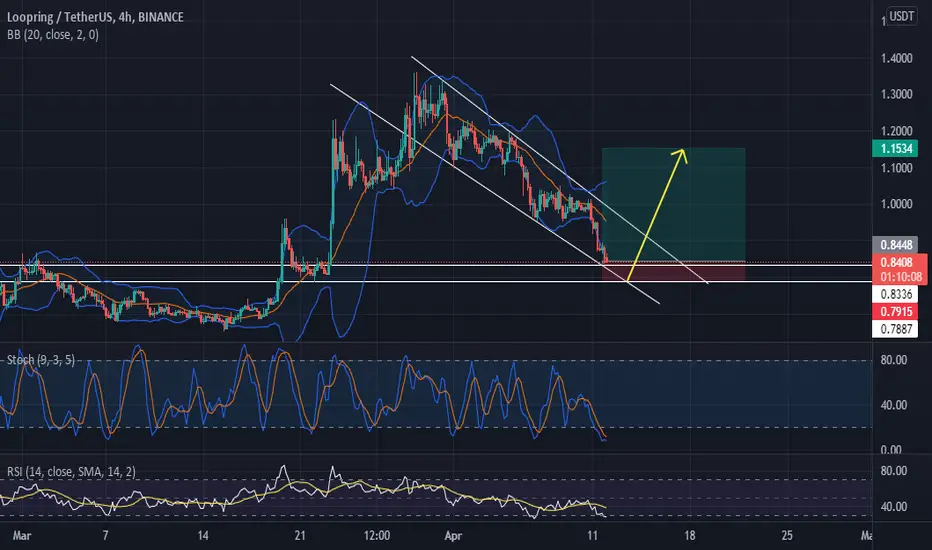
LRC bounce on bollinger band. idea for a small long.entering a small long on this level expecting a bounce from the BB