Weekly Still HoldingWeekly still holding right now.
Looking for good news to bump this up.... but we are still waiting on Bitcoin. It looks more and more like we are waiting for bitcoin to give the thumbs down for more pain.. or two thumbs down for max pain (Full bear market).
LRCUSDT trade ideas
58 cents or 1.68Looks like a new trend is beginning to form and will hold up for a while longer if we break here now. If not expect 58 cents to be the final bottom bounce point which is its long term trend line.
We must hold that long term trend or we are 100% in a new, longterm, bear market and we could see LRC plummet another 75%.
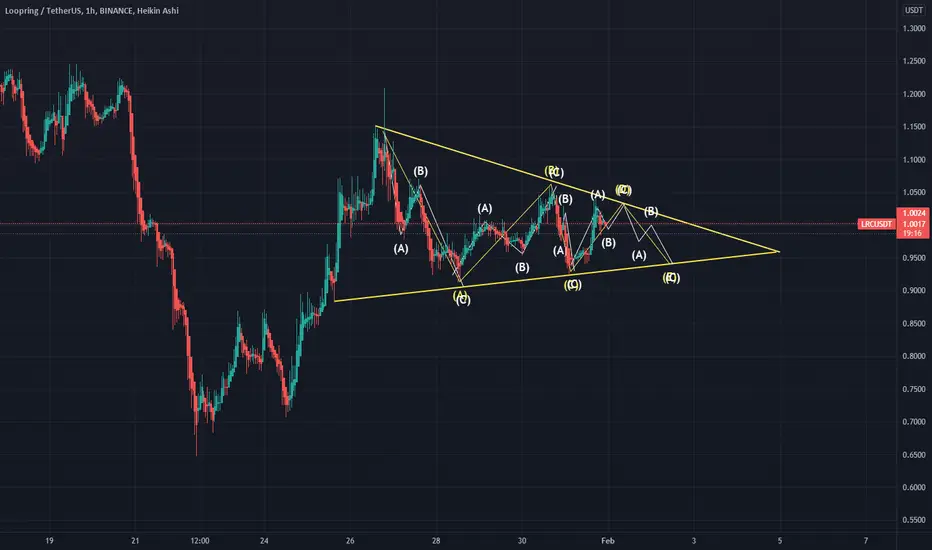
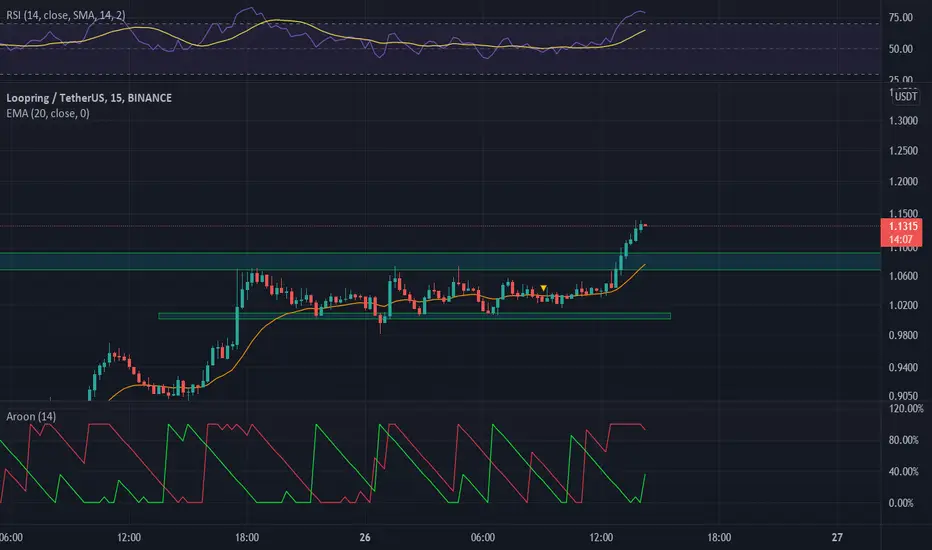
Bullish Loopring traingleClassic triangle play here as will needs to retest before going any higher
BTC is currently at resistance so this may affect the play
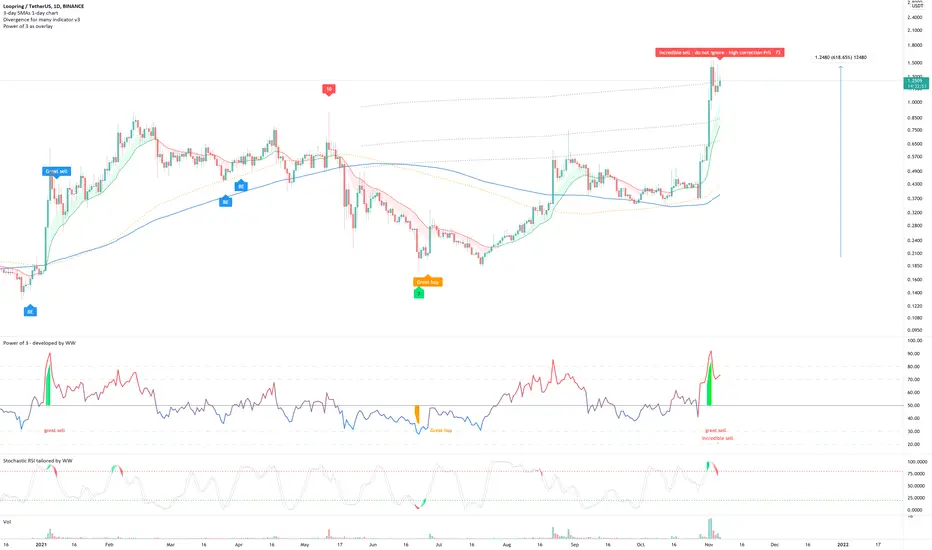
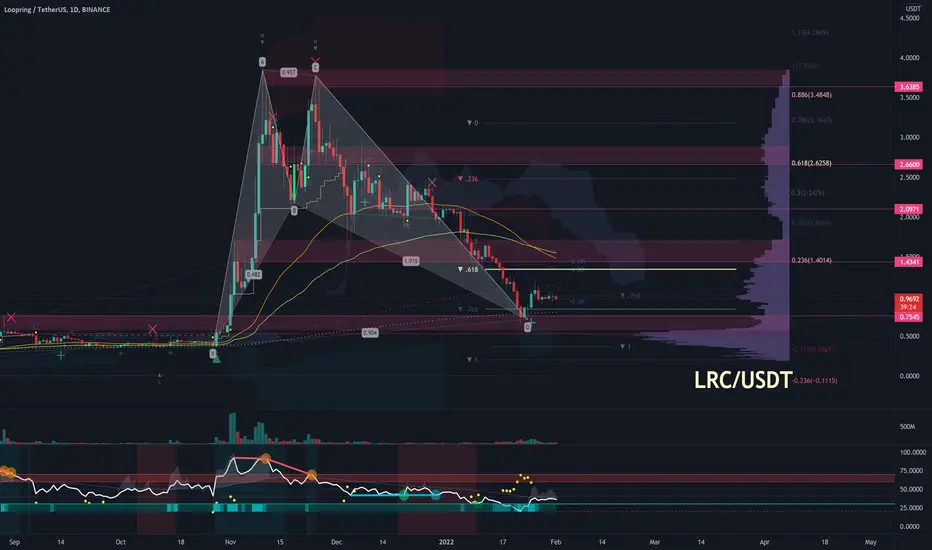
Loopring (LRC)On the above 1-day chart price action has increased 600% since late July, amazing. A ‘incredible sell’ signal has now printed indicating the probability of further upside is limited for the time being.
Is it possible price action increases further? For sure.
Is it probable? No.
A breakout above $1.44 could occur, in that situation look for an exit around $2.10.
As the correction takes place look for support around 86 cents and then 66 cents. Historically speaking the 50-day EMA (blue line) has offered strong support when price action was in a uptrend. It is currently at 70% correction away!
Good luck.
WW
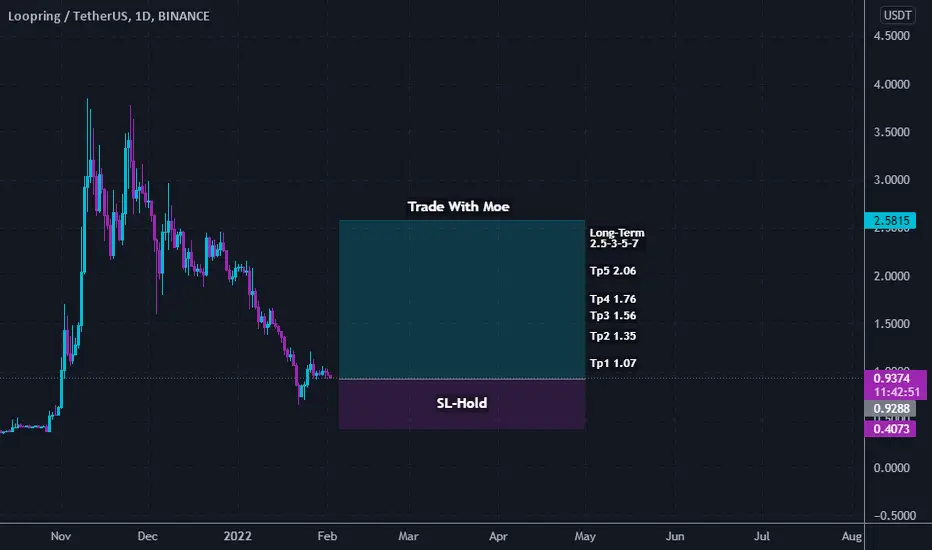
Loopring LRC Price ForecastCoin: Loopring
Type of signal : Spot
Entry Price : 0.65$-0.94$
Price now : 0.93$
Goals:
Tp1 1.07$
Tp2 1.35$
Tp3 1.56$
Tp4 1.76$
Tp5 2.06$
Long-Term
2.5$-3$-5$-7$
SL Hold
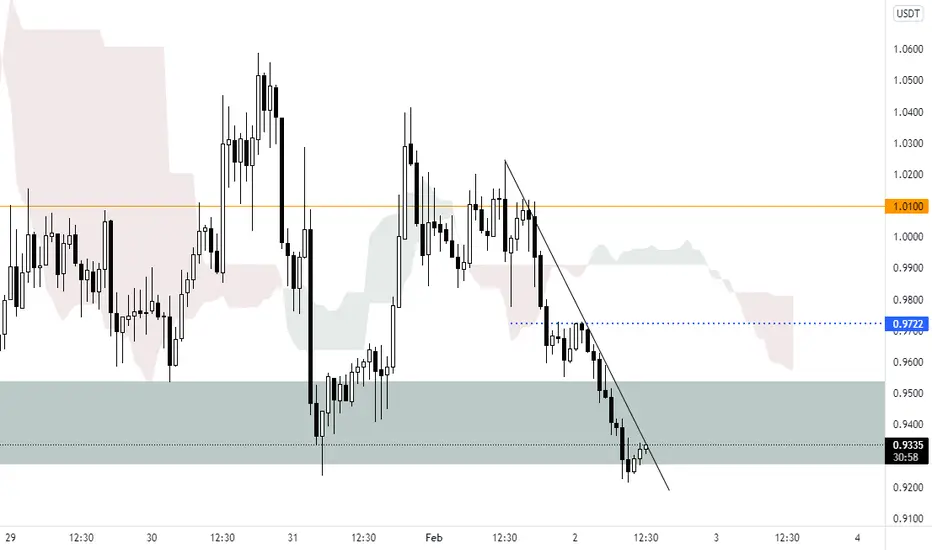
LRC/USDTIf the downtrend line breaks, support is confirmed at the desired time frame, and by breaking the downtrend line in the RSI, the level will be more confirmed.
You can fluctuate with me from the market, provided you are well versed in analytics, and with the signals that I announce with my own vision of the chart, you also check and enter with your own vision.
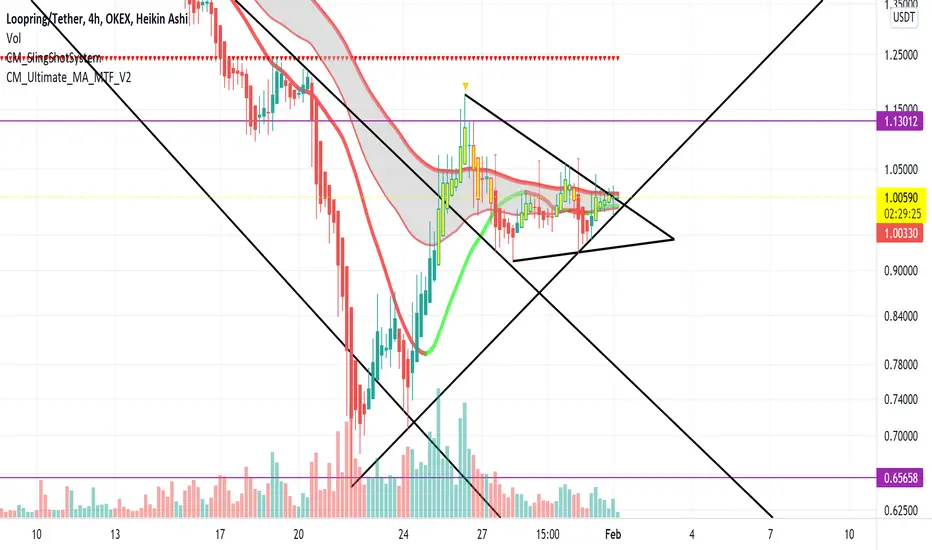
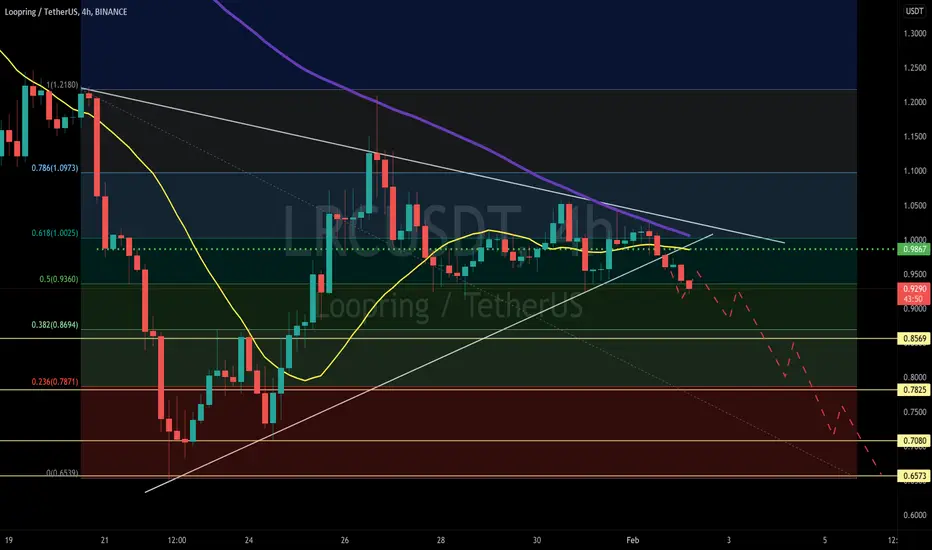
LRC/USDT SHORT 4HOUR UPDATE BY CRYPTOSANDERSWelcome to this quick LRC/USDT analysis.
I have tried my best to bring the best possible outcome in this chart.
Reason of trade:-LRC/USDT 4 Hours Update Triangle pattern has broken from the downside and continues like down we can short buy here in CMP with low leverage per 2x or 5x and hold 1st, 2nd, 3rd, and 4th to the target.
Entry:-CMP SHORT BUY
Target:- 20% to 30%
Stop loss:- 0.9867
Remember:-This is not a piece of financial advice. All investment made by me is under my own risk and I am held responsible for my own profit and losses. So, do your own research before investing in this trade.
Happy trading.
Sorry for my English it is not my native language
Do hit the like button if you like it and share your charts in the comments section.
Thank you.
$LRC Loopring Bullish BatReally nice structure here on Loopring, but we have only seen a reaction so far. You really want to see a second test of the lows for confirmation, preferably with a higher low which would give traders the implication of accumulation. Again, this would be contingent on BTC making a bullish advancement, however if we see further correction and this structure holds up, that would be quite the statement.
Loopring Forecast We currently have a symmetrical triangle upon us with two key levels around 0.98, and 0.93. Depending on the market, and if it can stay green, we can stay in the upper triangle, and continue to bounce the 0.98 levels. If a red market occurs, then we may possibly bounce off the 0.93 support level.
NFA. DYOR
Loopring (LRC) formed big bullish bullish BA for upto 430% rallyHi dear friends, hope you are well and welcome to the new trade setup of Loopring token ( LRC ).
During the current market drop on a weekly chart, LRC has formed a bullish BAT pattern. Right now it has moved up after completing the final leg, we can wait for the correction to catch it from the potential reversal zone.

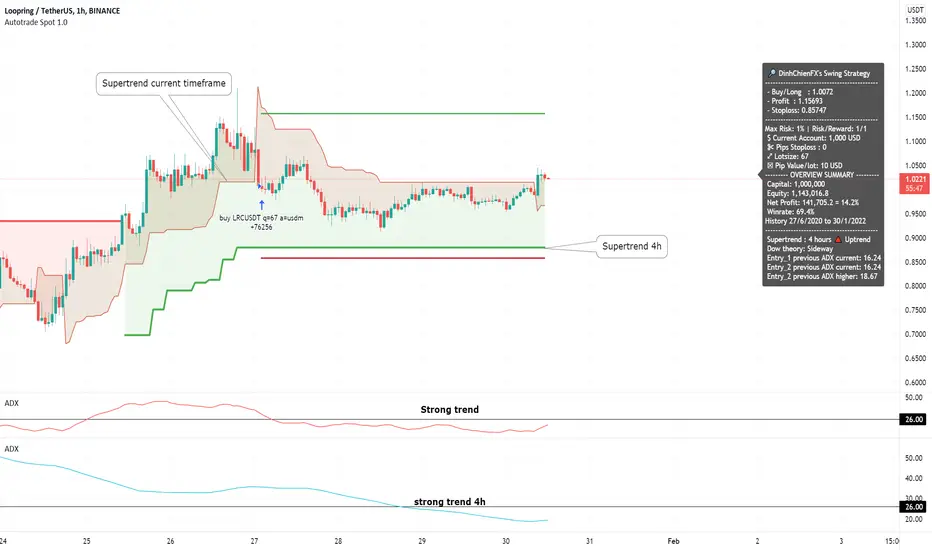
LRCUSDT - Long signal by Supertrend 1/30/2022- H4 timeframe: main trend.
...Supertrend indicator is Uptrend.
...ADX H4 > 26: strong Uptrend.
- H1 timeframe:
...ADX > 26: Strong trend,
...Open buy when close crossunder supertrend H1.
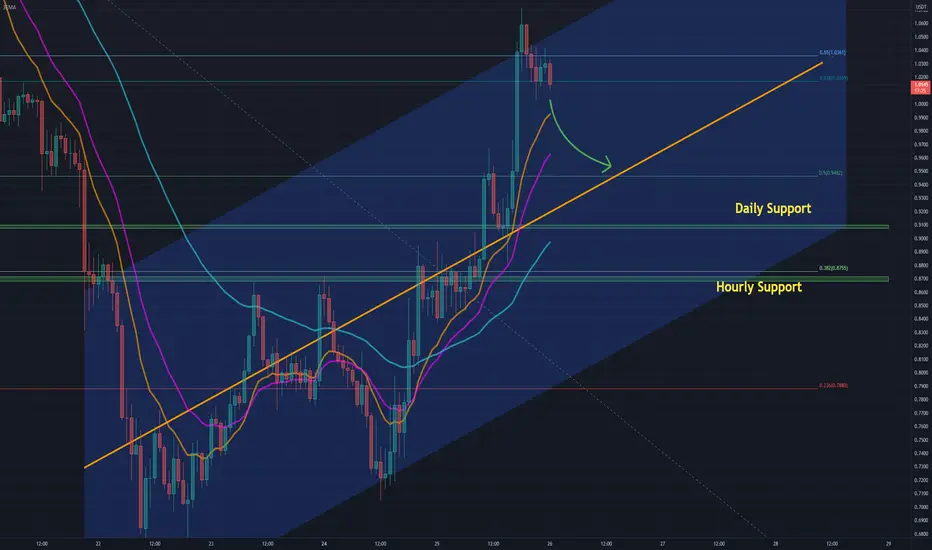
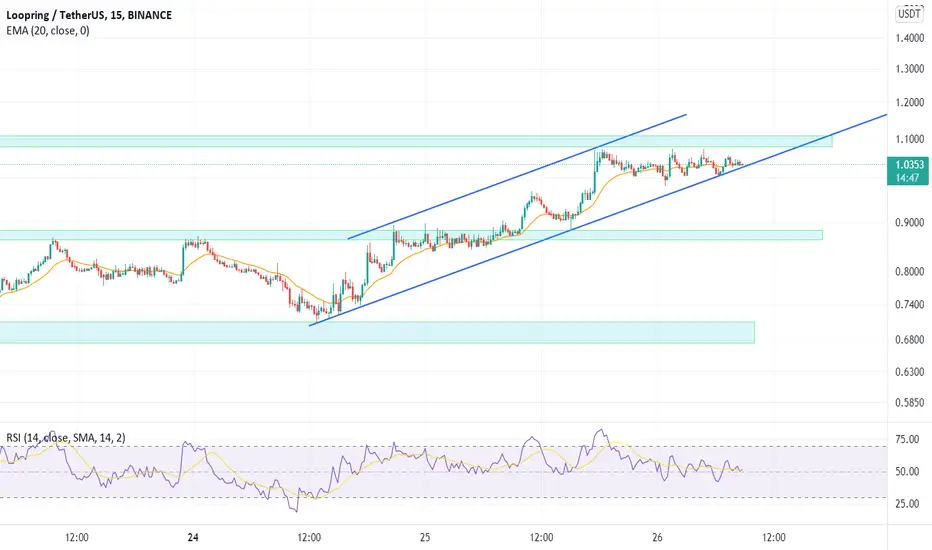
LRC Channeling (sort of)I've attempted to read LRC last week, and kind of succeeded.
Drawing an ascending channel from January 21st, LRC has reached the top of it. Coincidentally the price is in the Golden Pocket of the Fibonacci Retracement taken from the high of January 19th to the low of January 22nd.
If there is a decisive brake down from the Golden Pocket, I expect LRC heading towards the 0.5 (~ 0.9462) Fibonacci Retracement level. Ideally that'll happen at the intersection of the Ascending Channel center line and 0.5 Fib retracement level.
Two notable points of interest on the chart are:
#1 The beginning of Daily Support channel, tested a few times since February 2021. Ranging from 0.91 to 0.7475
#2 Hourly Support since January 21st 2022. Ranging from 0.8716 to 0.8680
Support lines come into play if LRC reaches and breaks through 0.5 Fibonacci Retracement level.
Target 1 = 0.5 Fib Retracement (~ 0.9462)
When in trade I keep to a strict Risk Management plan and keep an eye on BTC
This is my Thesis, targets are purely hypothetical based on my analysis.
This is NOT Investment and/or Trading Advice.
Happy Trades!
BINANCE:LRCUSDT
BYBIT:LRCUSDT
FTX:LRCUSD
Loopring longLoopring broke trough off the upper boundary of descending channel. Bullish movement to resistance level at 1.63 is expected to happen.

LRC is shorter than ever .. get the easy money now. It won't make it past 1.10 even if it had all the volume... its a tank. Went up to fast in such short periods. It must go to at least 0.55. Watch for trend reversal in between but imo a comfortable short.

lrc usdtlrc usdt
Hello friends. This is a personal analysis, you must analyze it with Ramesh and make a profit
LRC 1D Careful, maximum is close, and then it will hurtToday we will consider the trading pair LRCUSDT.
There is not much to write here, a long accumulation of Loopring token around $0.40-0.50 has logical completion — the price pump.
The trigger for the jump probably was some important news for the project, right? Please share the information in the comments below the idea.
Also, similar consolidation was observed in LRCBTC pair , there price reaches strong liquidity zone from above.
At the moment the lucky ones can fix x7 profit, maybe even the price of LRCUSD will give x10 at around $4-4. 40, but you should not test your fortune, because the price is very high and the downfall might be very painful , around $0.90-1.00.
We had a similar situation in IOTEXUSDT, and we warned crypto-market participants very timely that they should forget about longs and gave them levels to buy again.
You can see the result in the idea below.
_______________________________
Since 2016 , we have been analyzing and trading the cryptocurrency market.
We transform our knowledge, trading moods and experience into ideas. Each " like under the idea" boosts the level of our happiness by 0.05%. If we help you to be calmer and richer — help us to be happier :)

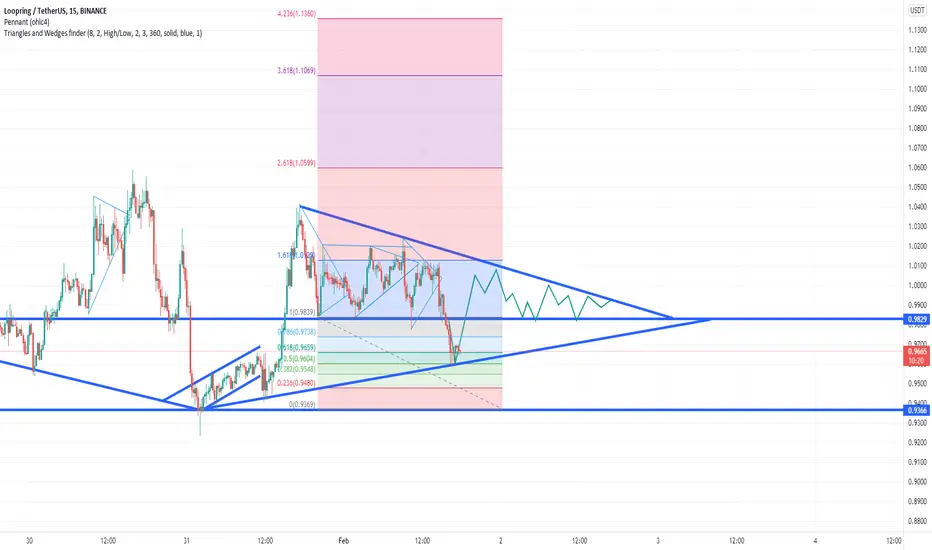
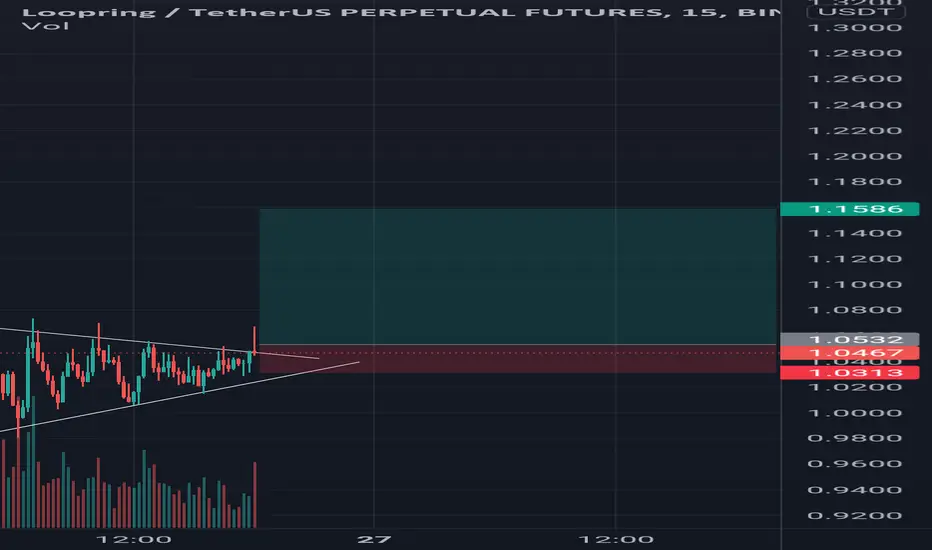
LRCUSDT 15m tf structure brokenLRC was consolidating in a bullish pennant structure in 15 minute timeframe and has finally broken through it. The stop loss has been placed just below the low of previous candle. Looking for a 10% gain here.
LRCWe still have one more step down so don't get your hopes up that we have bottomed - this is a trap to suck your soul out.

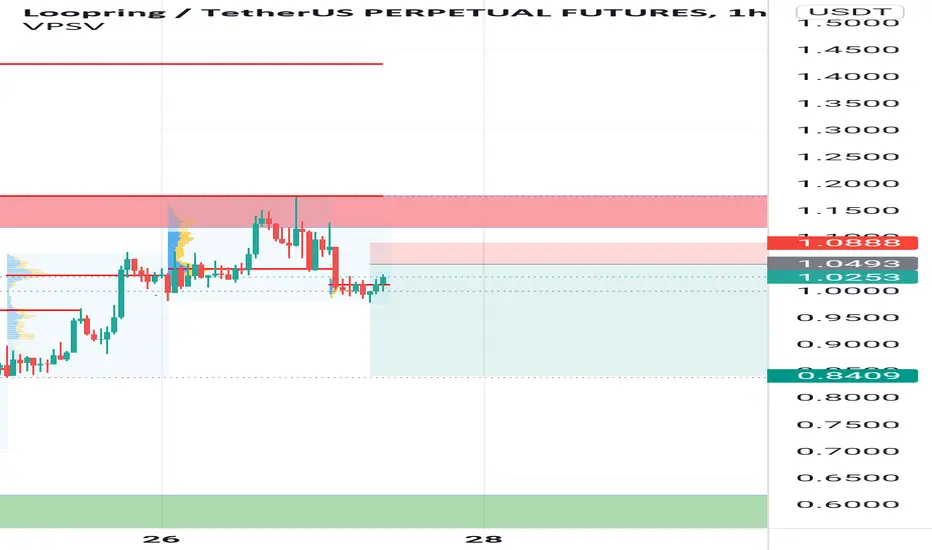
Do you grow or fall?The price is supported in the dynamic support range.
We have to see if the price continues to be supported or if this important support is broken.

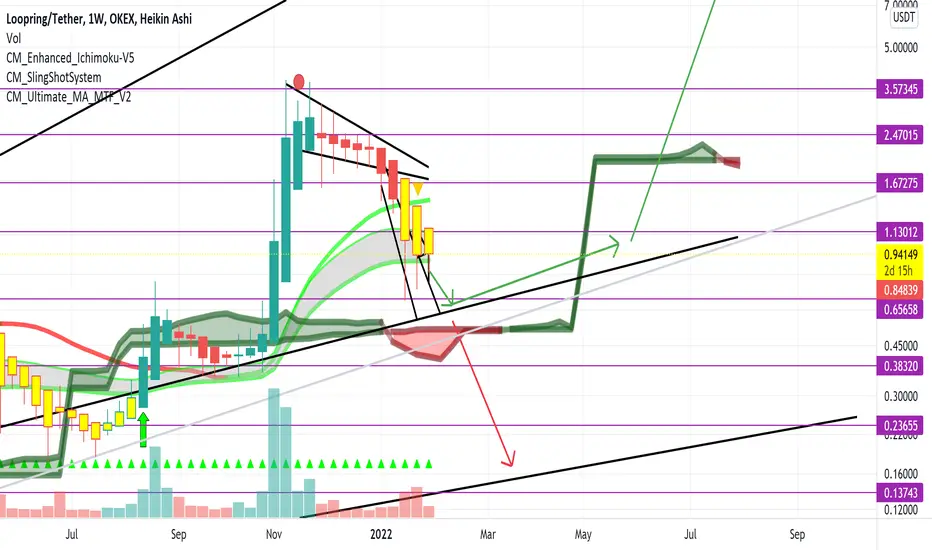
Loopring - Green trend cycle long termHello trading friends,
Also, LRC did break down depending on the last trend of BTC.
Same time know that LRC has a green cycle trend - what means for the long term is still interesting.
Coming time there will be more targets updates of LRC.
Have a great day.
