LRCUSDT trade ideas

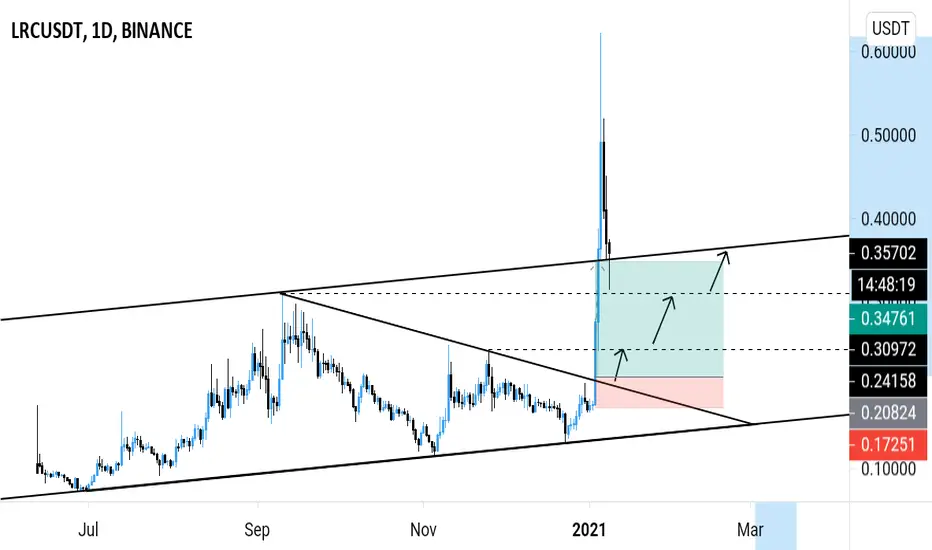
Loopring Long ideaLooking to take a long depending on price respecting the target area.
also one eye on Bitcoin as this can affect my decision.
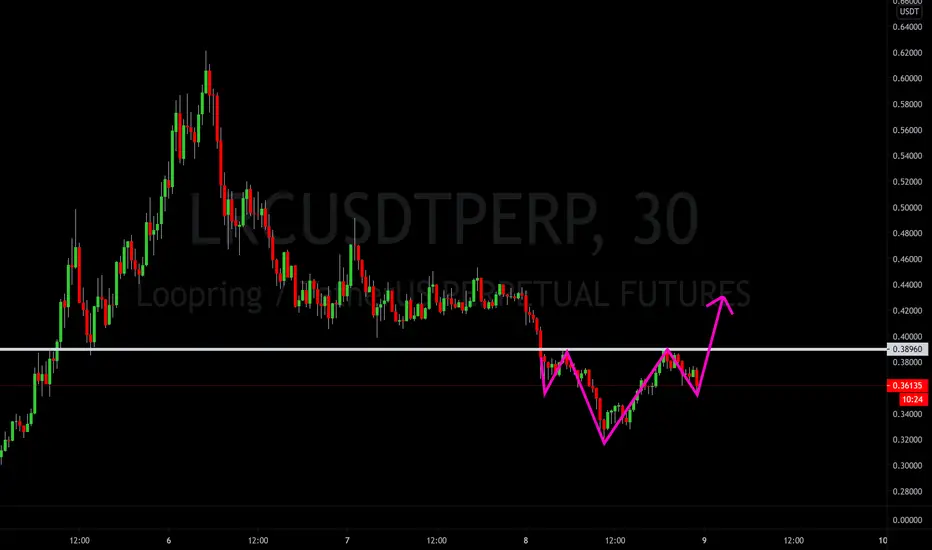
LRC Potential Inverted Head & ShoulderLRC Long Setup on 30 minutes with the potential inverted head & shoulder developing
LRCUSDT - Educational review 📚Good day everyone.
Today I'll be discussing on symmetrical triangle patterns.
How it looks, builds up, and plays out.
1.DEFINITION
First of all, what is a symmetrical triangle?
A symmetrical triangle is a chart formation where the slope of the price’s highs and the slope of the price’s lows converge together to a point where it looks like a triangle.
What’s happening during this formation is that the market is making lower highs and higher lows.
This means that neither the buyers nor the sellers are pushing the price far enough to make a clear trend.
If this were a battle between the buyers and sellers, then this would be a draw.
This is also a type of consolidation.
Symmetrical triangles can play out both ways - equilibrium consolidation (buyers = sellers).
This mean there's a possibility a breakout ⬆️ and a breakdown ⬇️.
2. ENTRY (TRIGGER ENTRY SIGNAL)
In a symmetrical triangle pattern, you're to trade the breakout or breakdown. So your trigger entry is basically when the inclined resistance (for a breakout ⬆️) or inclined support (for a breakdown ⬇️) is broken by the market price.
3. TARGET (TAKE PROFIT)
Here, I'll be discussing on your profit target levels in the case of a symmetrical triangle pattern.
Basically your take profit levels should be where there's a high concentration of sellers ( sell orders ) or buyers (buy orders). And this is basically your resistance levels (in the case of a breakout) and your support levels (in the case of a breakdown).
4. STOP LOSS AND SETUP INVALIDATION
Stop loss and setup invalidation are quite similar terms but different.
Stop loss is simply a level where you cut your losses. It's like a breathing space for your trade. Your stop losses shouldn't be too tight ( to avoid being hit by stop loss hunting or market noise). It shouldn't be too far also (to give you a good risk to reward ratio (R:R)).
Setup invalidation is your last hope of validation. It's the last point that keeps a trade setup valid. When broken, the setup is invalidated ( no longer useful, you'll need to run another analysis).
Setup invalidation in a symmetrical triangle pattern is usually below the previous swing low ( for a breakout ⬆️) or the previous swing high (for a breakdown ⬇️).
Note: Your stop loss can be less or equal to your setup invalidation, but not greater.
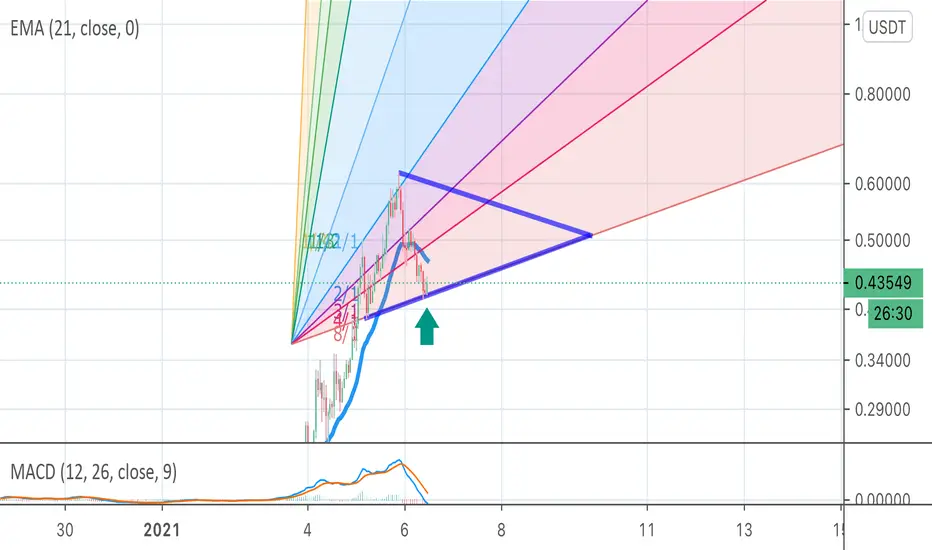
5. TRADE EXAMPLE
I'll be using my analysis on LRCUSDT as example of a symmetrical triangle pattern.
Trade entry (long order ⬆️) - price breakout above the symmetrical triangle inclined resistance as expected from my previous analysis.
Target (take profits levels 🎯) - horizontal resistance / projected ascending channel resistance.
Stop loss - Setup invalidation /2
Setup invalidation - breakdown below the previous swing low.
Price brokeout as expected from my previous analysis and went on to double my expectations.
That's that for symmetrical triangle pattern.
Thank you.
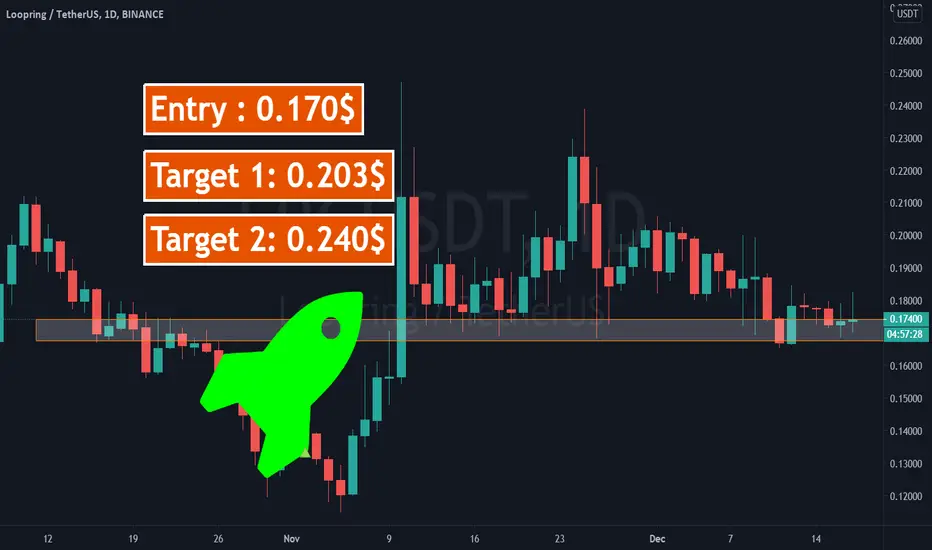
LRC: Long TradeHello Dear Traders,
LRC has performed great rally few months back and from almost a month trading in a demand zone. it doesn't started a upside move yet like other coins but i m expecting soon it will start a rally upside. buy small quantity of bel and entry point and once u see its rallying up u can add more.

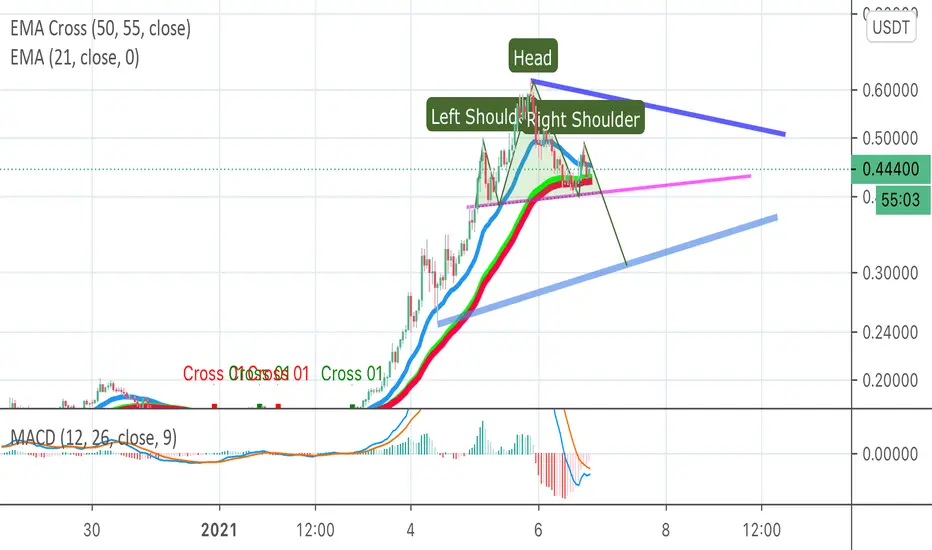
Loopring ideaI've taken profit and watching for the next move
If this head and shoulders plays out it may take price down to my next buy Target
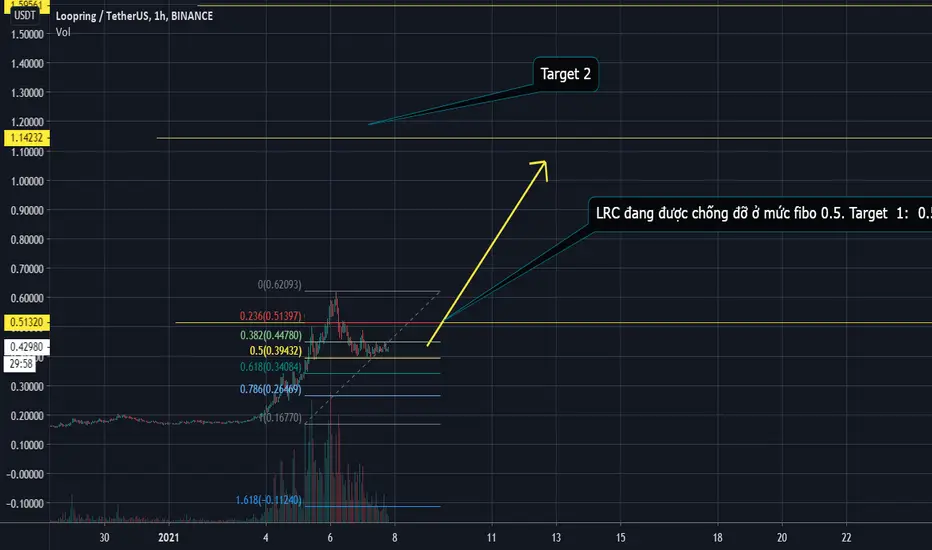
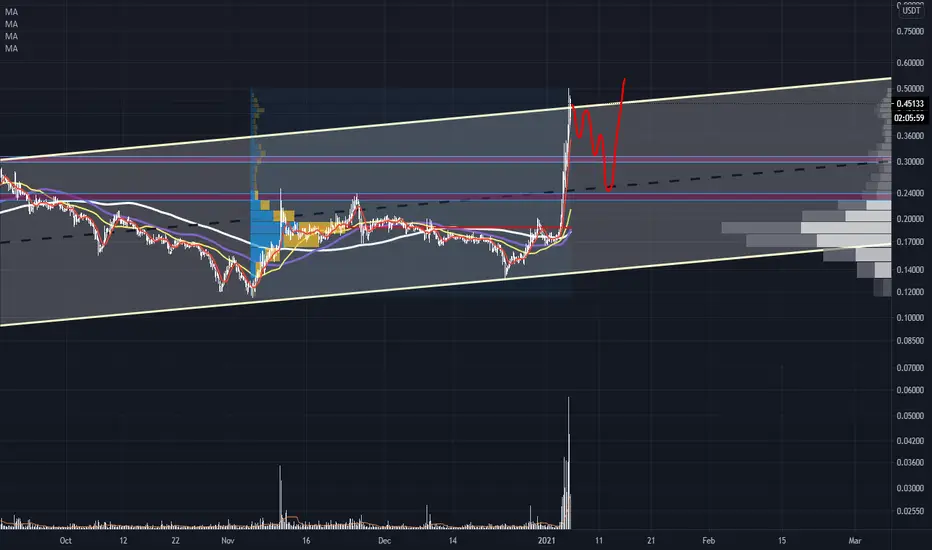
LRC - Update- We Aren't Done Yet!Continuing my theme recently, if you followed my last LRC trade it was good for.... 244%...
Yeah - I don't know how that happened either.
Anyway, looking at the chart, we saw almost a 30% retrace in value since hitting ATH at .6 area, nicely bring us out of oversold.
Uptrend appears to still be in tact on MACD, interestingly the weekly has a ways to go still on RSI, see below
Think we're good for at least another 120% here.. Likely higher as this has seriously legs behind it seemingly.

Loopring Price (Short): +20% in profit by the end of this month?It's time for a correction
> We broke through the trendline
> The asset is over-purchased
> Net network growth is low
> 0% in large transactions


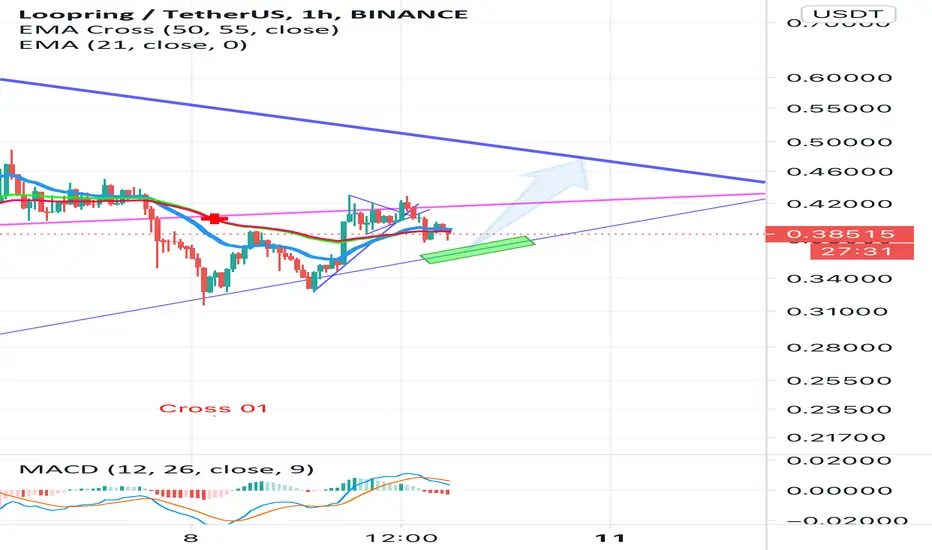
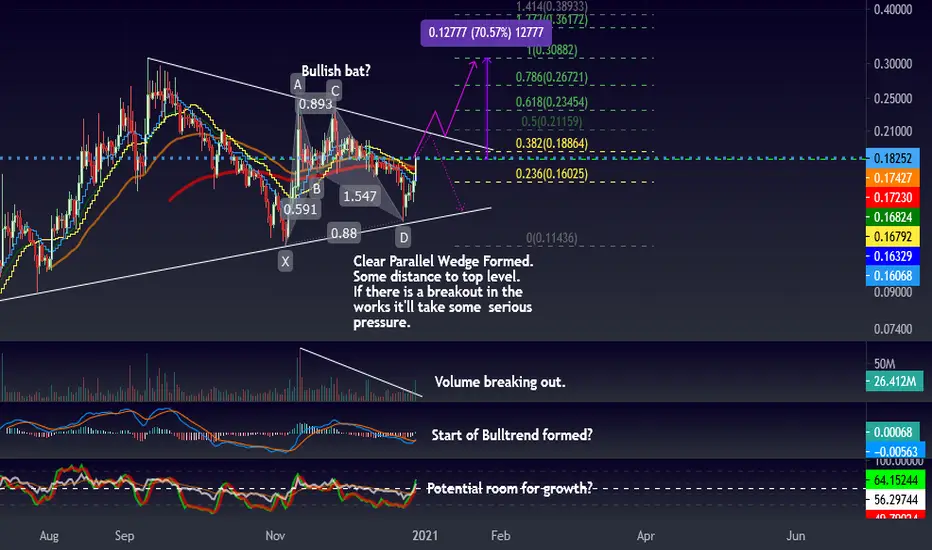
LRC - Potential for a breakout? Charts starting to shape up!LRC is seeing some good signs shape up on the chart.
Pretty clear bullish bat just ended, already yielding +40% and giving us a clear parallel wedge.
Volume seems to be breaking out, we'll have to see if it can sustain this.
MACD is showing first signs of reversal.
Potential room for growth on RSI, though with the distance from the top resistance on the wedge being so large it's likely we'll see a reversal before the action completes.
Pretty strong indicators for a breakout in the works. I'd aim to buy a retrace or a retest.
This is not financial advice. Want financial advice? 2 words: Pet Insurance 🐕
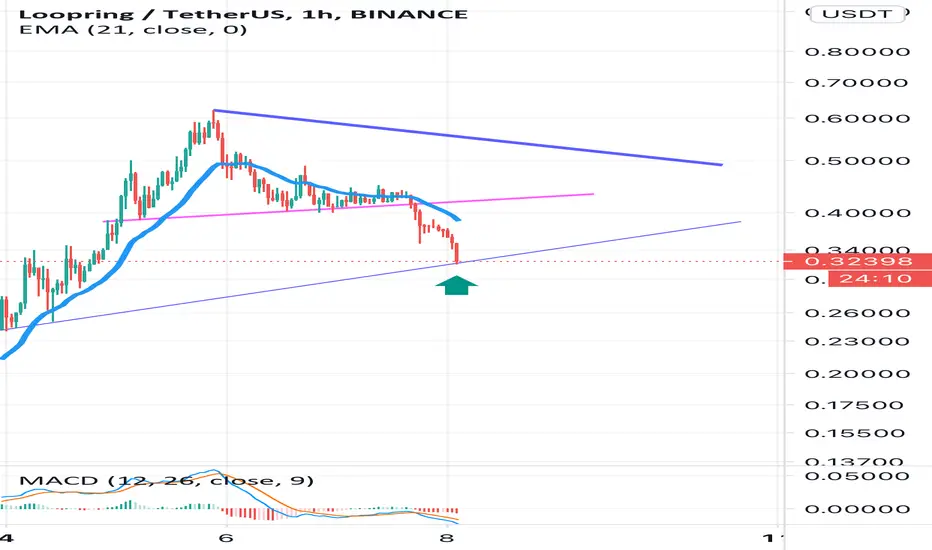
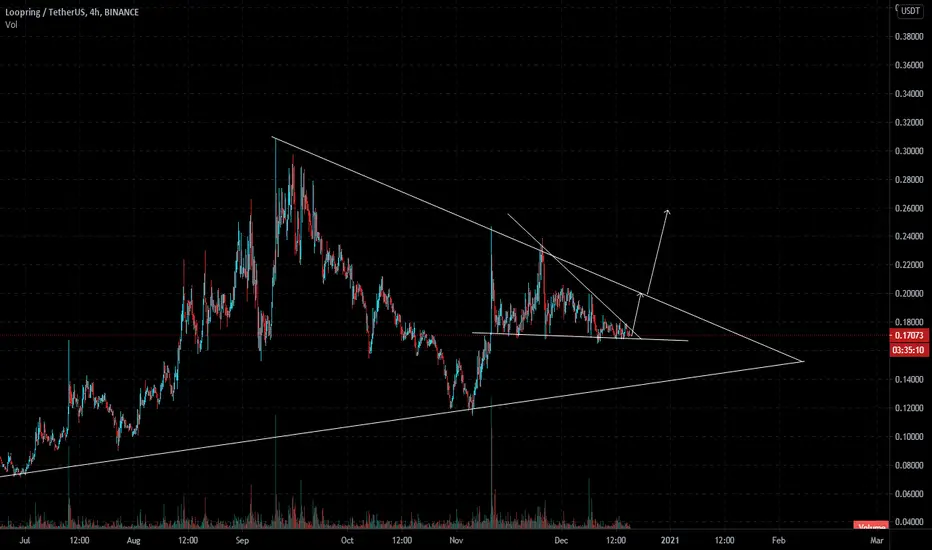
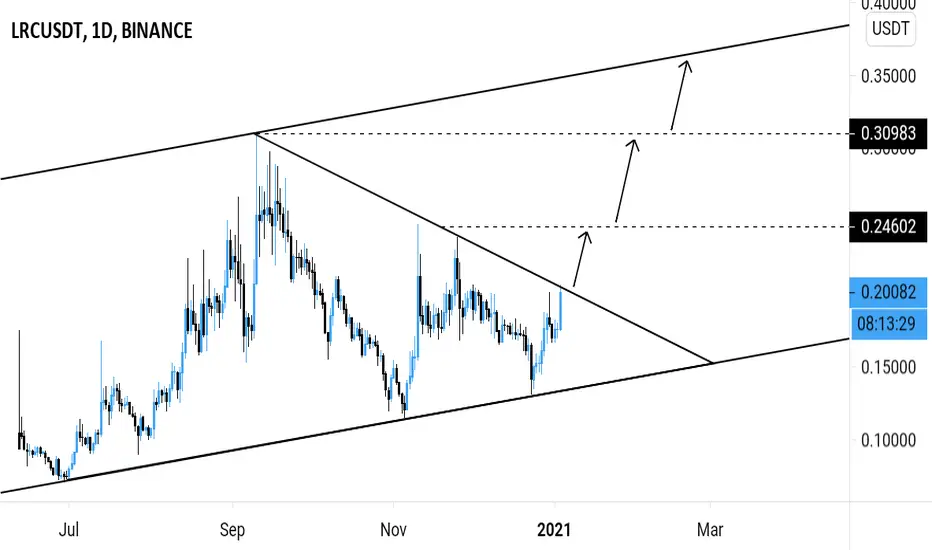
LRCUSDT - Potential buy entry 🔼LRCUSDT has been consolidating in a symmetrical triangle pattern.
Potential breakout.
Buy entry ⬆️ - breakout above the symmetrical triangle resistance.
Target 🎯 - resistance levels, ascending channel resistance.
Setup invalidation ❌ - breakdown below the ascending channel support.
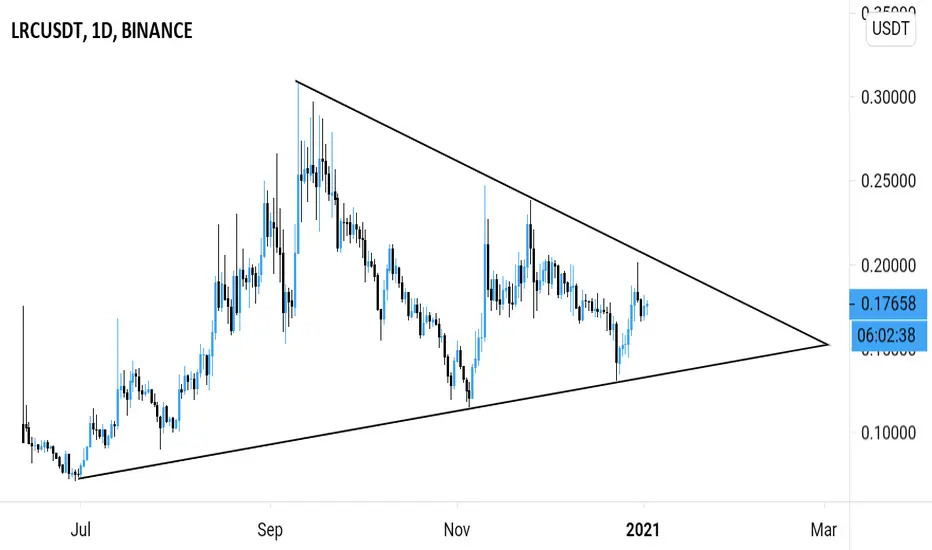
LRCUSDT - Daily analysis LRCUSDT is consolidating in a symmetrical triangle pattern on the Daily timeframe.
Potential breakout.
LRCUSDT shortRisk warning, disclaimer: the above is a personal market judgment based on published information and historical chart data on Tradingview, all analysis is only subjective. Hope investors consider, I am not responsible for your investment decision. Thank you.
Good luck!
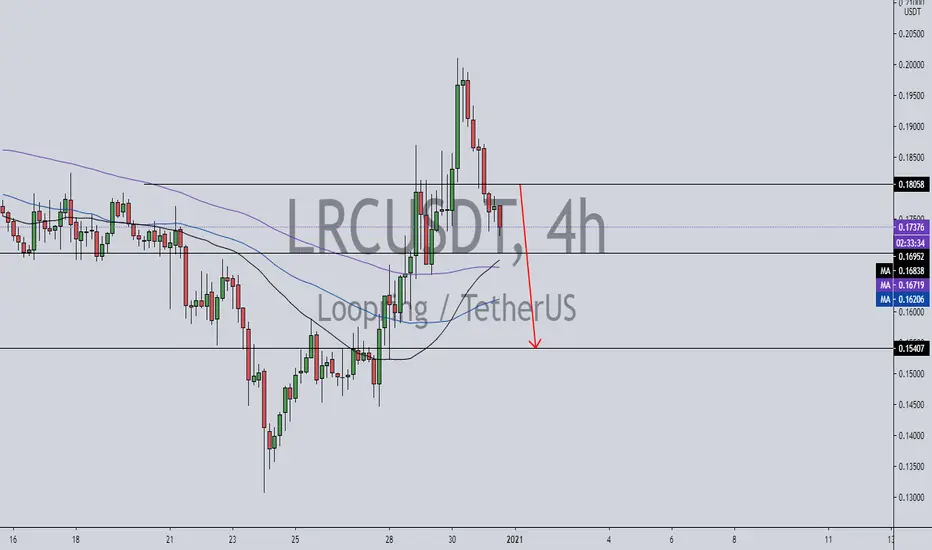

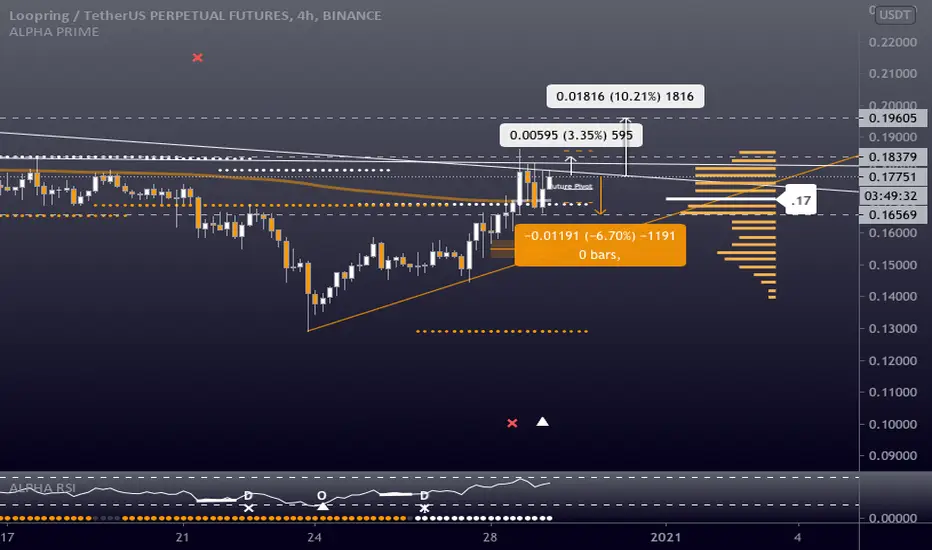
LRCUDSTPERP - Long - Potential 10.21%LRCUDSTPERP - Long - Potential 10.21%
Entry- 17789
TP1- 18379
TP2- 19605
SL- 16569
- Optional Leverage 3-5X
- BTC - breaking new highs always chance of big sell off now, be careful
- RR - 1.55
- Trailing Buy - 0.5%
- Trailing Profit - 1%
- Trailing Stop-Loss - No