0HHR trade ideas
ANET, Arista Networks Inc. 10%+ Upside ANET
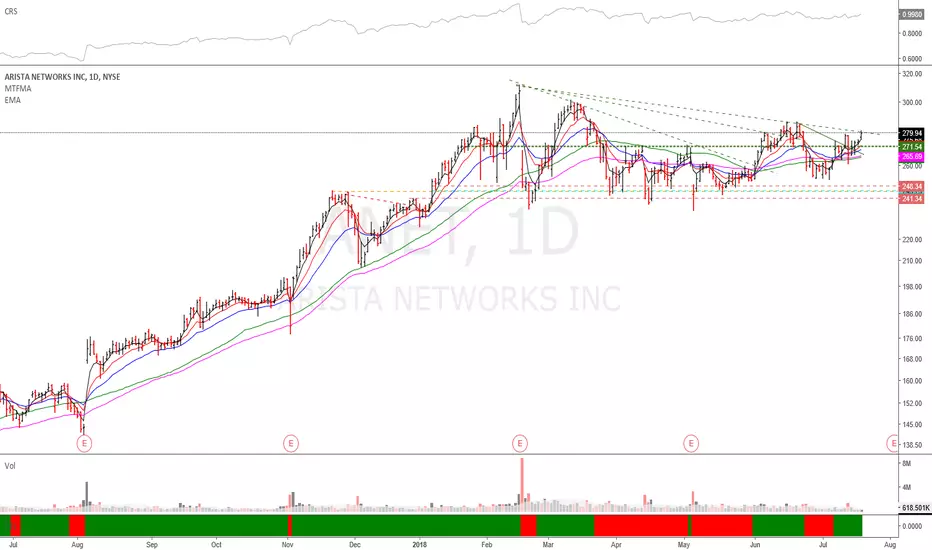
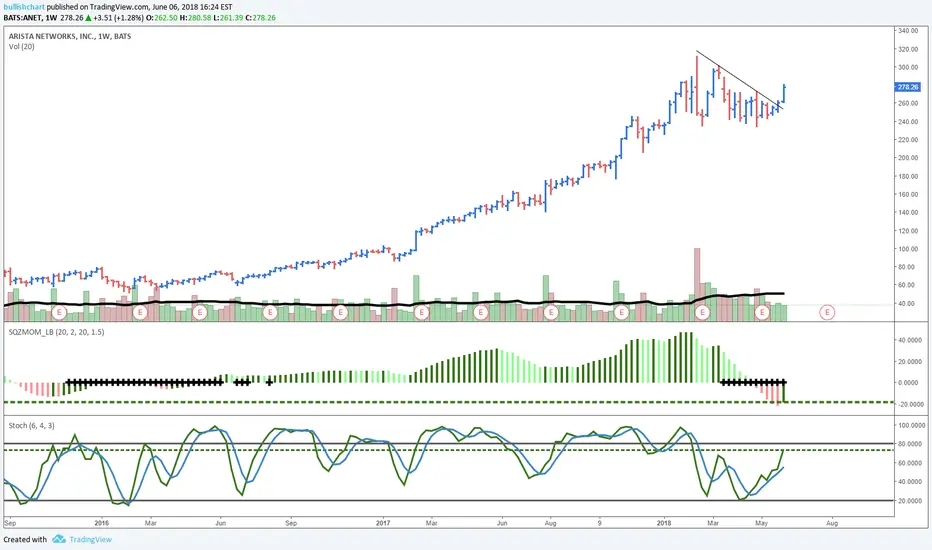
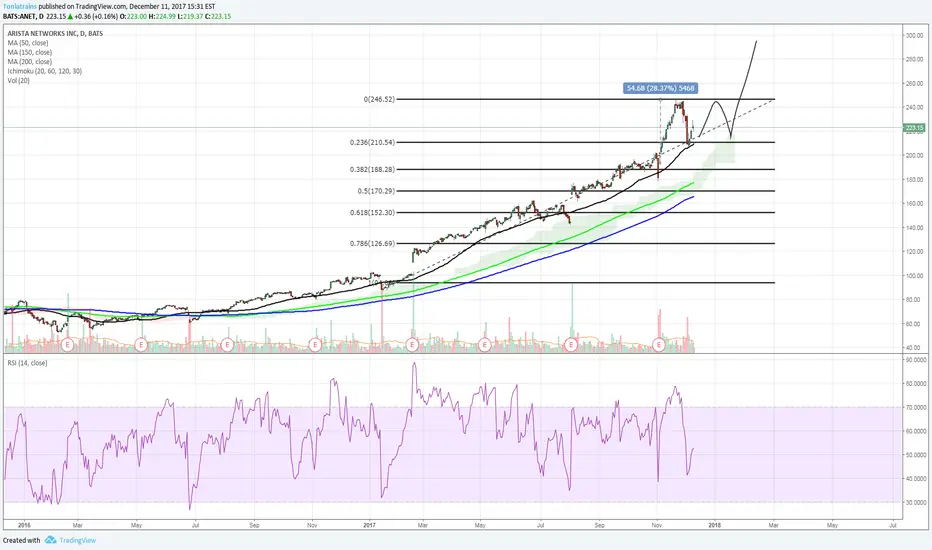
Trend/resistance line: Was stuck in a descending triangle (both on weekly and daily charts), recently broke out with volume and looking to fill the drop made after February correction.
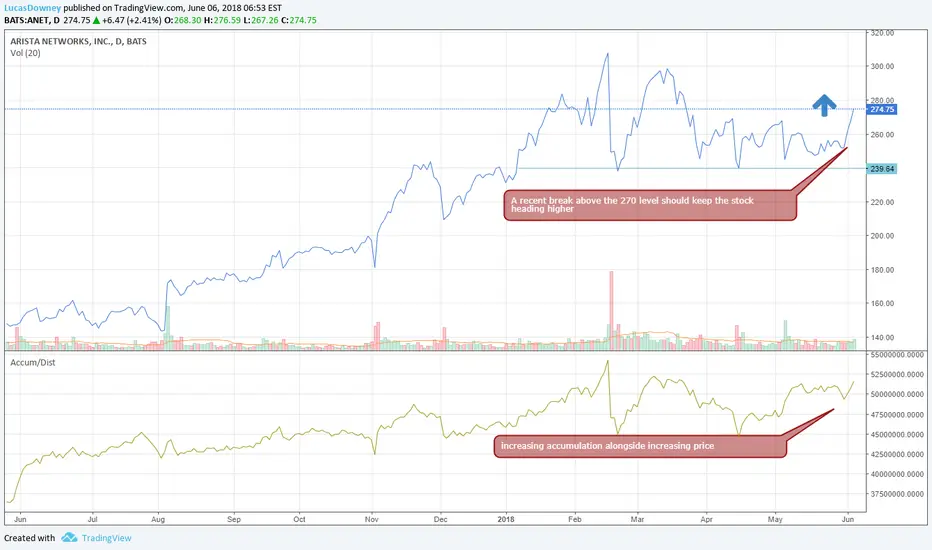
Moving Averages(20/50): On the daily chart we can see a daily 20/50 cross giving a short-term bullish signal. More interesting is the 50ma cross over the price on 6/1/2018, and the positive price action afterward, again showing bullish sentiment for the upcoming days/weeks. There is a similar signal on the weekly chart with the 20ma/price.
RSI(14): Currently on the rise signaling increasing amounts of volume and increased momentum, vital after the chart breakout.
MACD (12, 26, close): Currently turning up on the weekly chart, looking to cross in the near future. MACD has already shown bullish on daily charts, which is what pushed the stock out of the descending wedge.
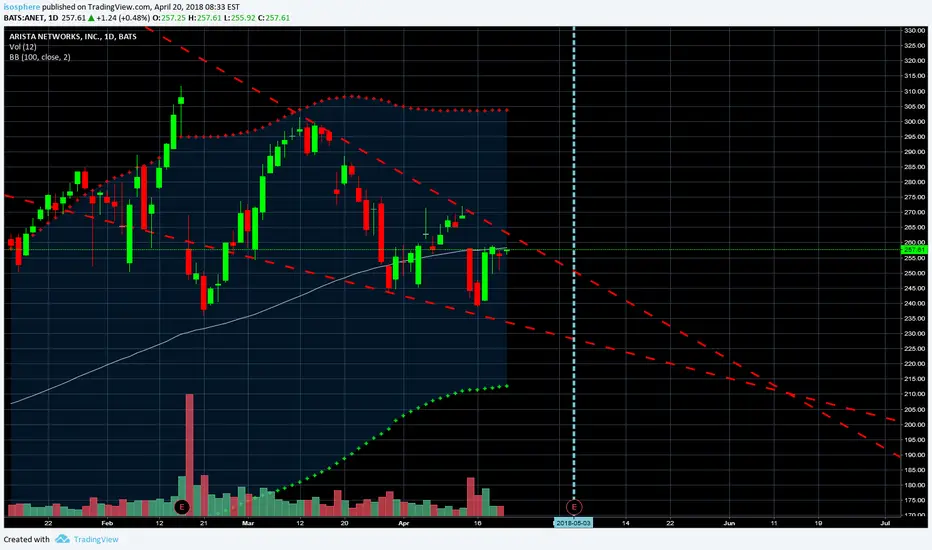
FIB Lines: Shown on the chart with the variety of colors, Possible consolidation in-between the 38 and 61% retracements (yellow). Have a very loose stop around the black line, as it is a relatively weak support if you were comfortable with more risk, the red may be best. I expect the stock to at least retrace to past highs.
Current position 8 shares @ 263.00

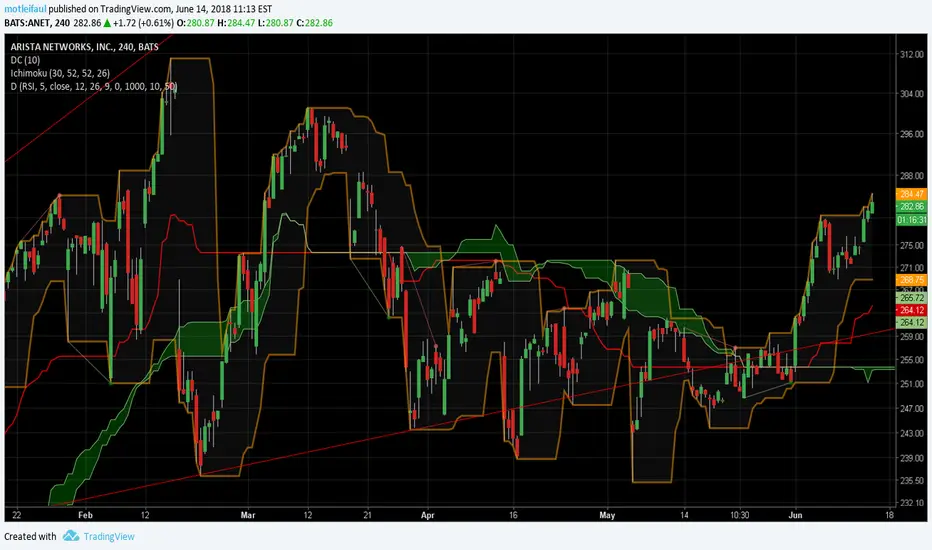
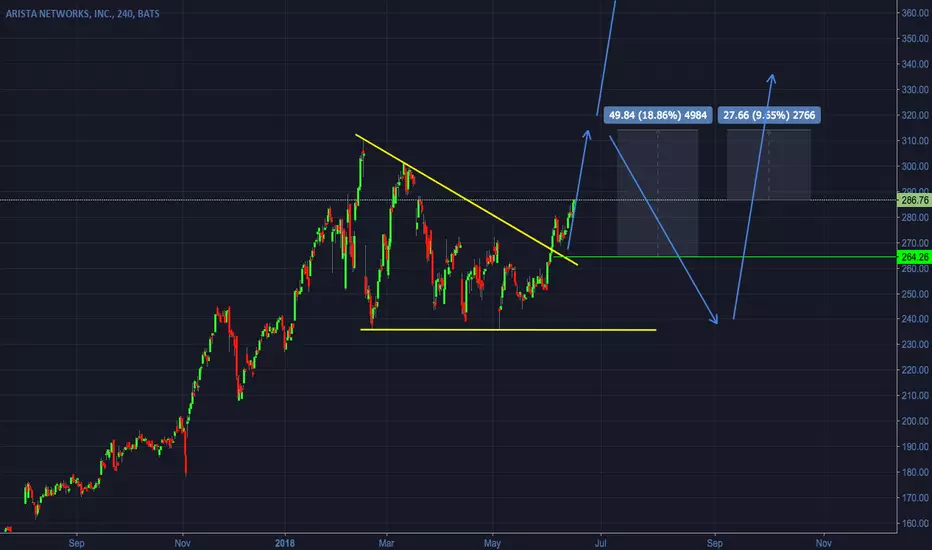
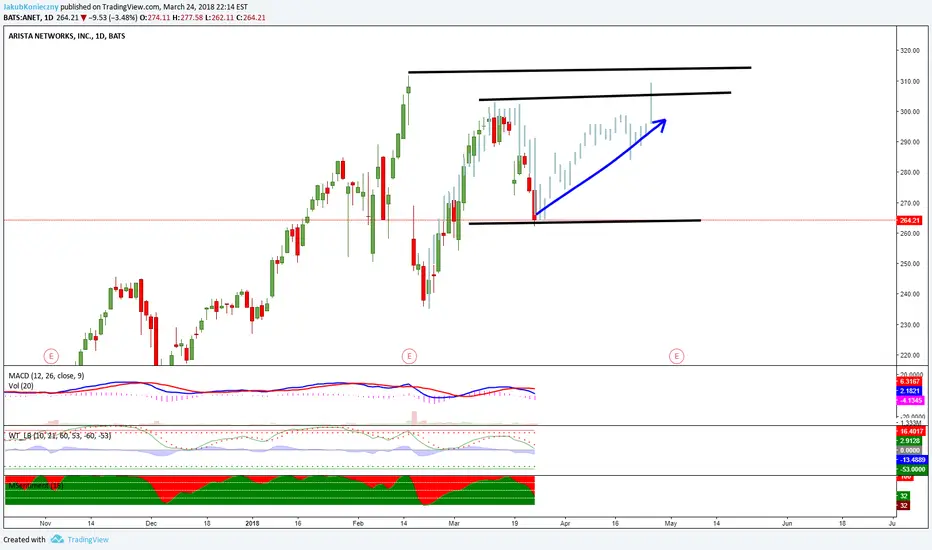
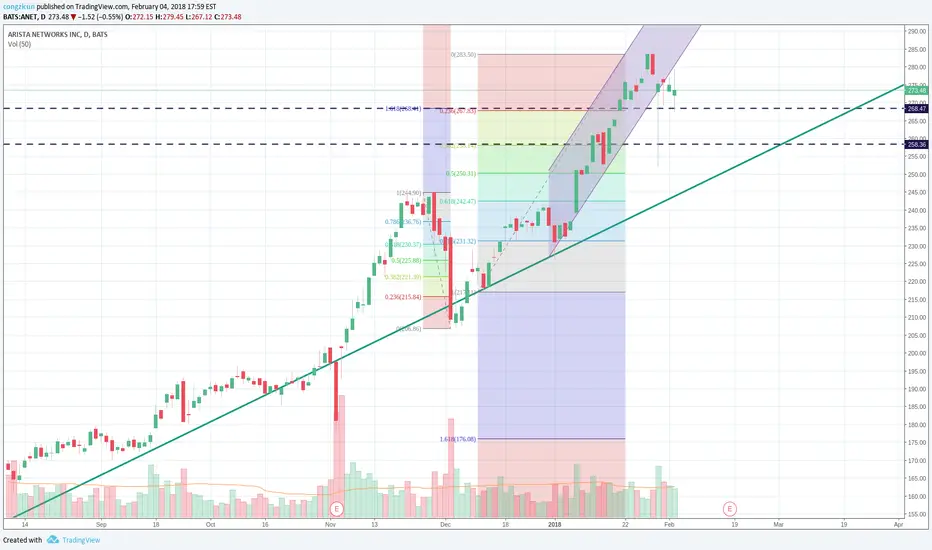
Arista Networks - Buy Opportunities - Short termAs stated in previous publications on Tradingview, we have recently decided, as a complimentary thing, to publicly share some of the analyses on equities we have done and are currently following for our private clients.
A bit late on schedule, Arista Networks, which is currently trading at 286.62 per share, broke out of it's daily correction which came into the shape of a flag type corrective structure and is heading up to retest previous tops. Whether it is the resuming of the uptrend or the completion of a bigger correction it is impossible to know, at the moment. What is certain, however, is that the price will reach the 310 - 320 level, making it a nice long opportunity, although short term. For buy and long traders who decide to enter this stock now be aware that you are positioning your trade very lat in regards to the triangle break. We therefore recommend to put all positions in break even when price reaches the 300 area, and see how it goes. If it's impulsive and carries on, keep long positions. If, instead, the price starts retracing to complete a bigger correction, your positions will automatically close in break even and we will follow the correction for later trades with a more efficient risk to reward ratio.
If you feel that our analyses and views may be a useful complement to your trading strategies and in order to be notified in real time with our updates on the lower timeframes, please remember to click on the Follow button.
Remember that you can double check the bigger structures that are at play are on the weekly and daily time frames also by scrolling around the charts in the lower 4hr and 60min timeframes (right and left, up and down).
Trade with care and only with a backtested strategy that has proven to work in relation to your invested capital, risk appetite and potential small losses you might incur in before profiting from a good trade.
Thank you for viewing.
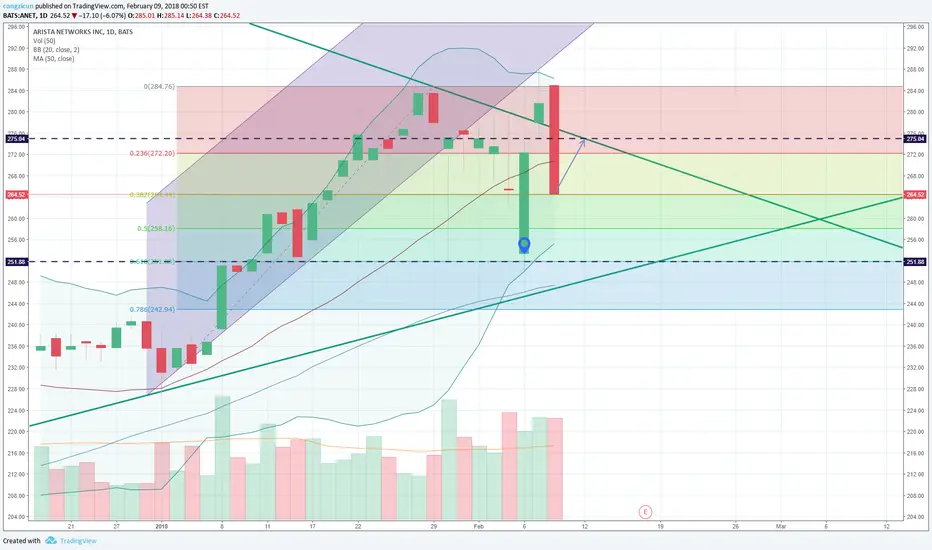
ANET- Ready to shortSince 11 days Stock is in Bull trend but now coming in selling zone. We can short stock at 290 for the targets of 280 and 275. Risk Reward Ratio is 1:2

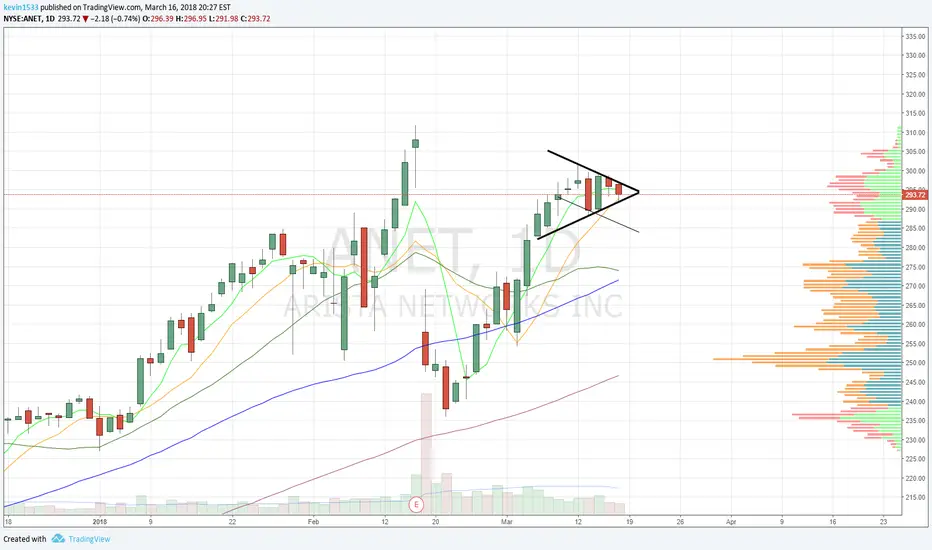
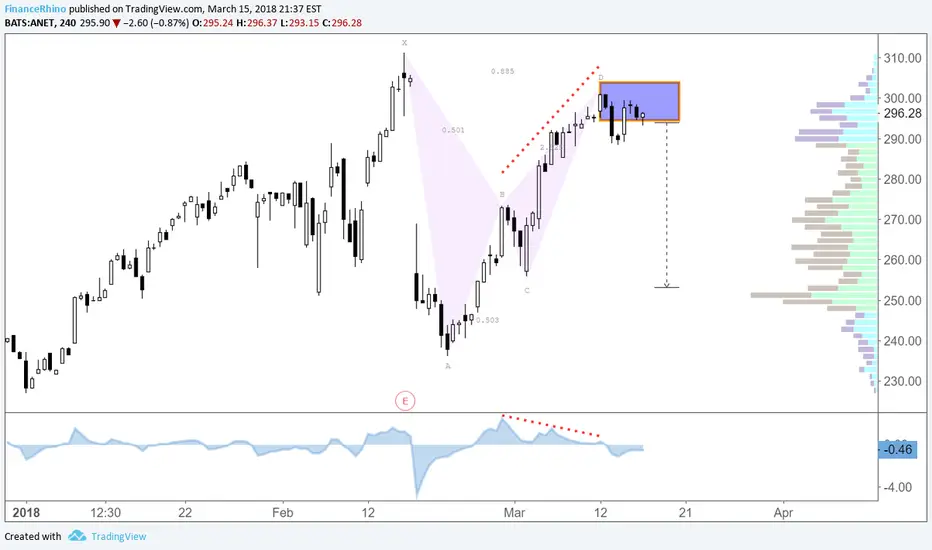
Possible Bull Wedge on ANET into EarningsIf their earnings don't disappoint, I'd hope to capture ~10% in a short term boost. As always, there's a good chance of a fakeout to the downside first. I'd watch volume for confirmation.
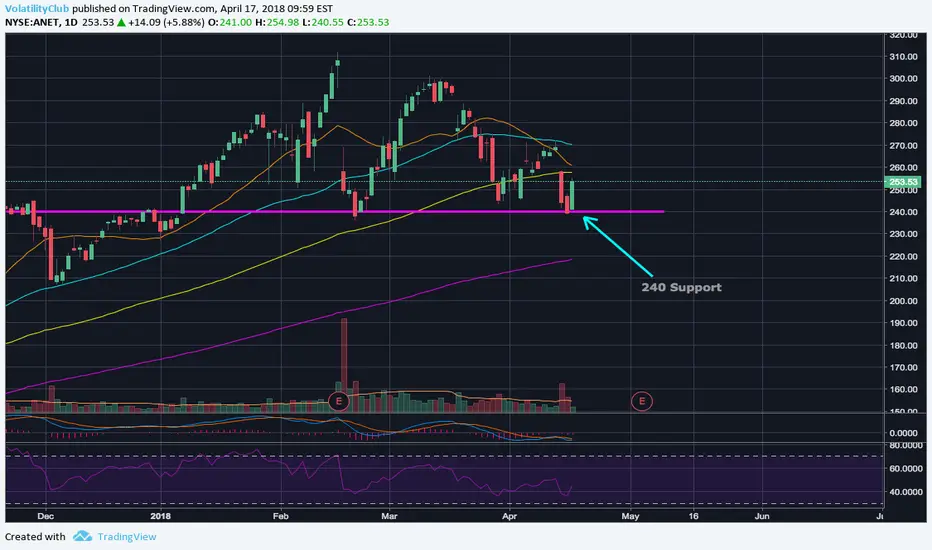
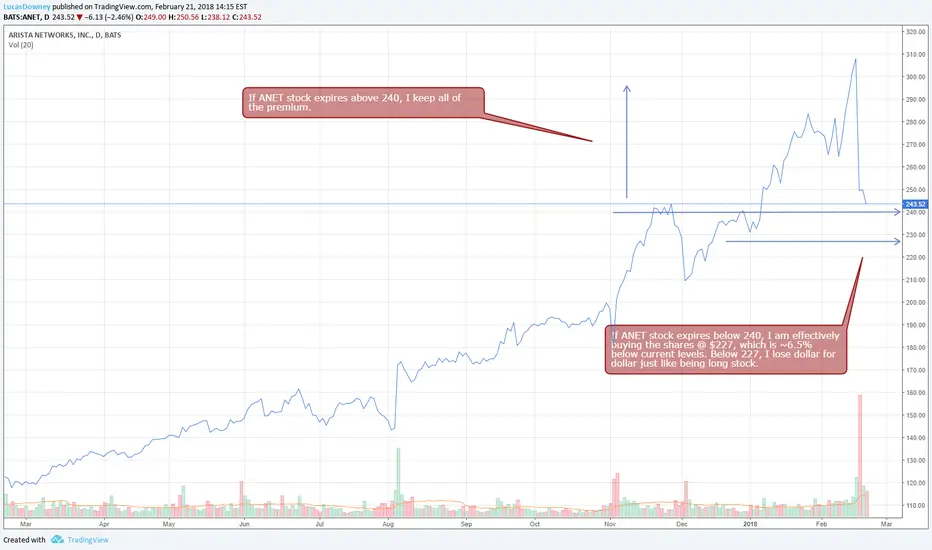
240 looking like solid support here for AristaI've been eyeing this area for quite some time now and I think this is a great area to consider a position.
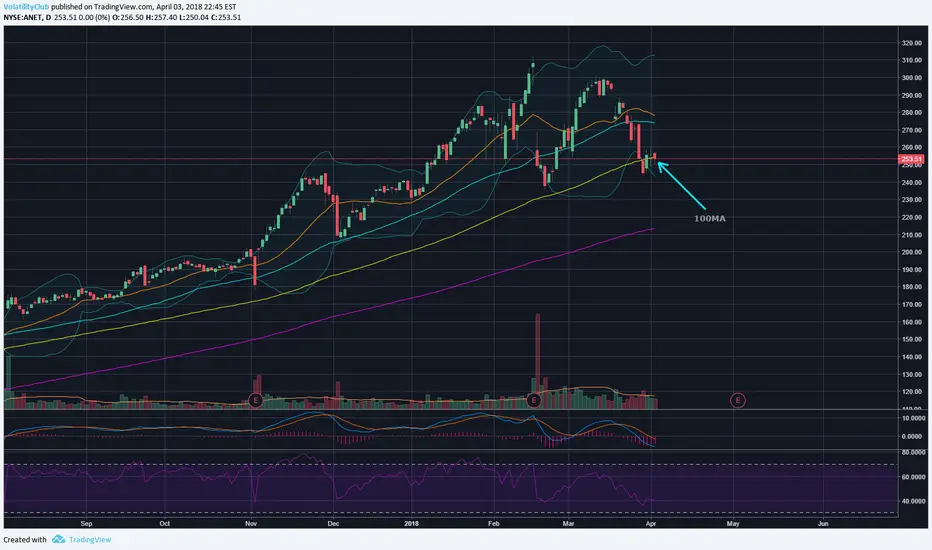
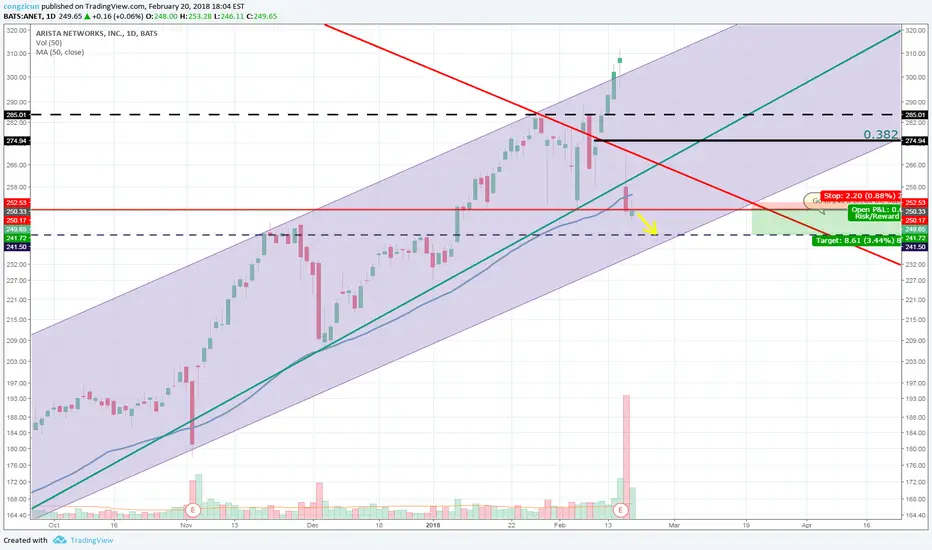
This pullback to the 100MA looks attractive, but...I'm not quite comfortable with the choppiness of the SP500. Will have to continue to wait and see what happens next. :)
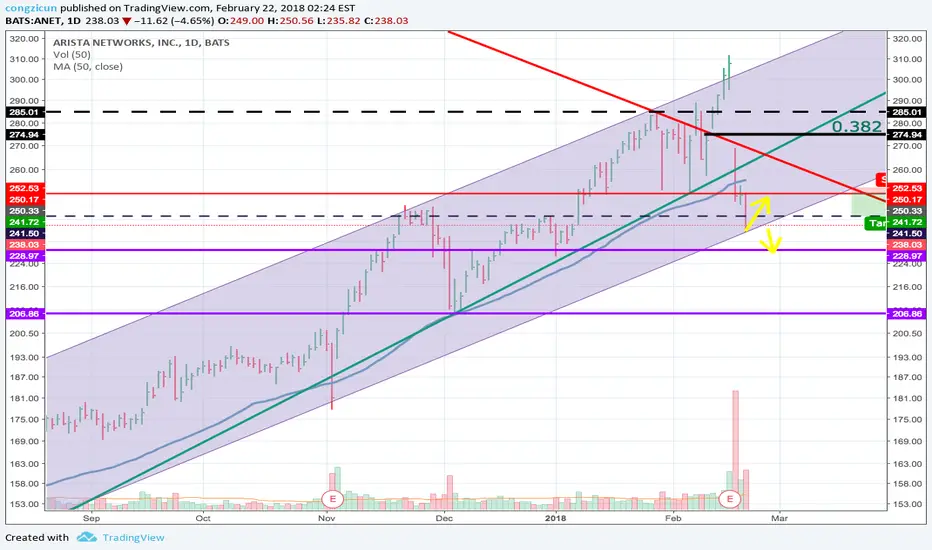

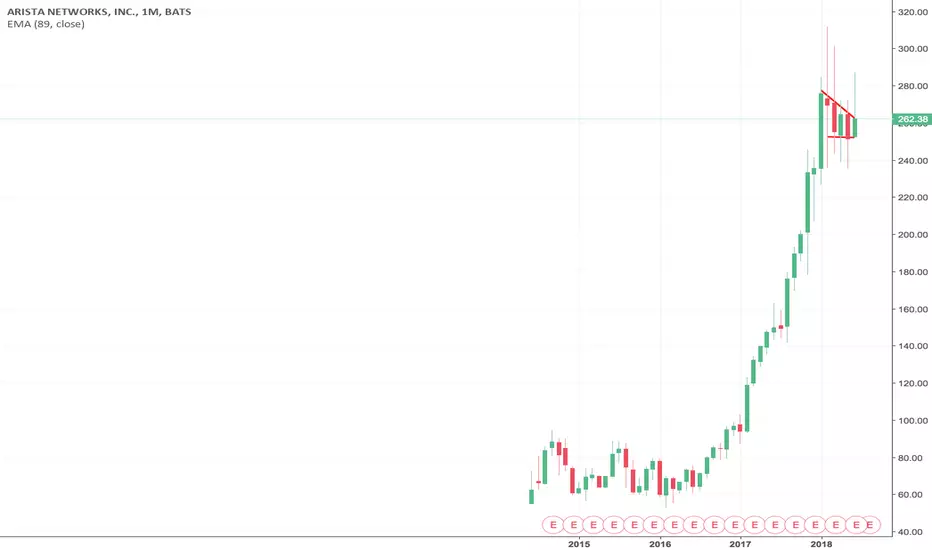
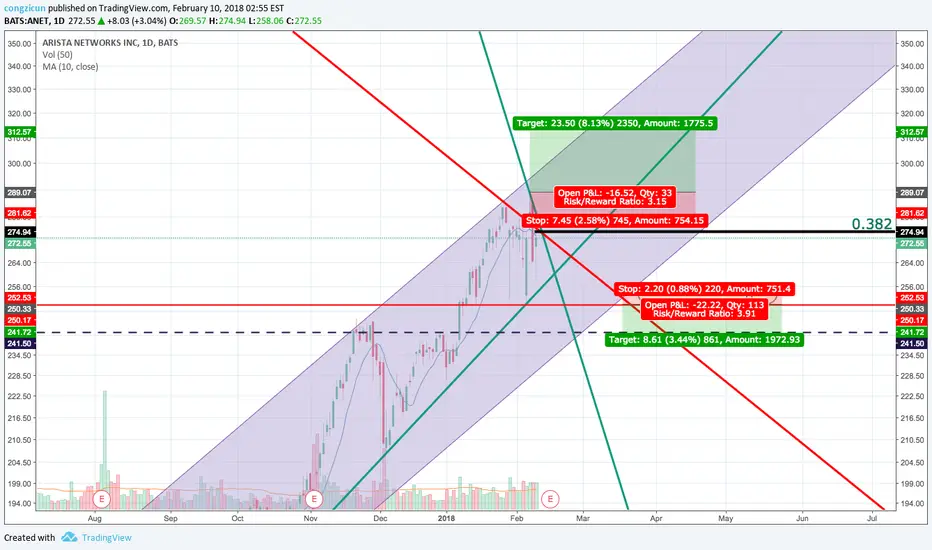
Long term Bull short term under some pressure.1. The store still moves within the uptrend channel which starts since 2016 (Bull)
2. Short term the stock shows LH and HL pattern. (Neutral)
3. In a slaughter day, the stock still gets support at its 10-week MA (Bull)
4. Did not close above the Fib 0.382 / 274 (Bear)
Conclusion
1. The market is waiting for the ER report.
2. If the report is good (High probability), it has a large chance going to ATH.
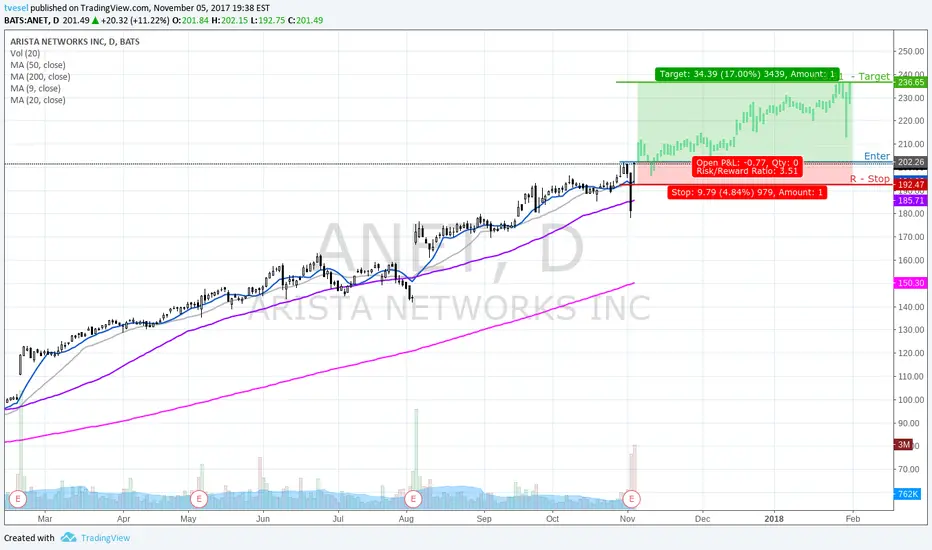
Break of 202.50 might have room to run.Break of 202.50 might have room to run. Looks like the shorts failed with the long tail on Friday.