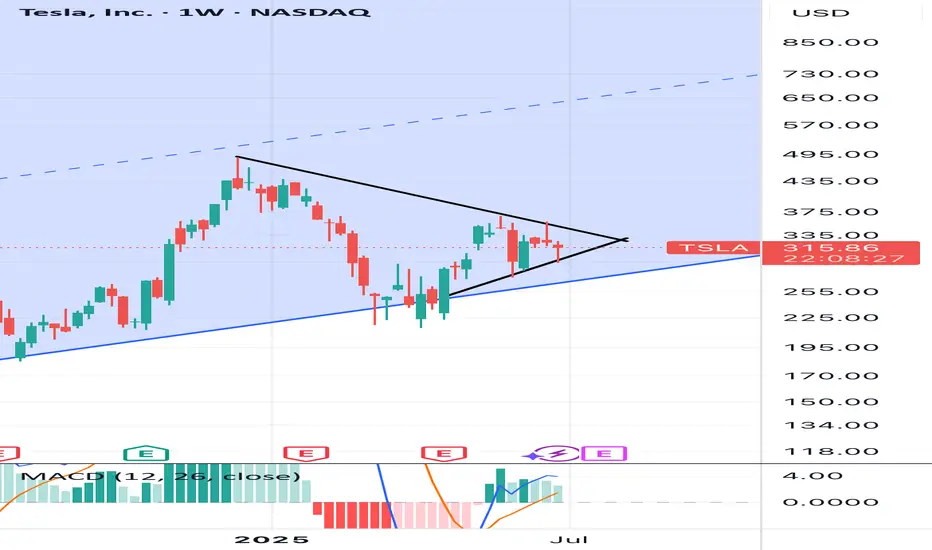
TESLA: Bulls Will Push
The price of TESLA will most likely increase soon enough, due to the demand beginning to exceed supply which we can see by looking at the chart of the pair.
Disclosure: I am part of Trade Nation's Influencer program and receive a monthly fee for using their TradingView charts in my analysis.
❤️ Please, support our work with like & comment! ❤️
0R0X trade ideas
Could TSLA rebound after a weaker decrease than expected deliverTesla Q2 2025 Delivery fell, but could it rebound in 2H?
Key Figures
Q2 2025 Deliveries: 384,122 vehicles
Year-over-Year Change: Down approximately 13–14% from Q2 2024
Wall Street Expectations: Around 385,000–387,000 vehicles
Production vs. Deliveries: 410,244 vehicles produced, indicating a build-up in inventory
Fundamental analyst
Sales Decline: This marks the second consecutive quarter of declining deliveries for Tesla, reflecting intensifying competition, especially from Chinese EV makers like BYD and legacy automakers such as General Motors, who have gained significant market share.
Aging Product Line: Tesla’s current lineup is considered to be aging, with no major new models launched recently, while competitors continue to introduce fresh, competitively priced vehicles.
Brand and Leadership Impact: Tesla’s brand image and CEO Elon Musk’s public controversies and political activity have contributed to softer demand in some markets.
Inventory Build-Up: Production exceeded deliveries by about 26,000 vehicles, suggesting demand-side challenges rather than supply constraints.
Stock Market Reaction: Despite the delivery decline, Tesla’s stock price rose by about 4–5% after the report, as actual results were better than the most pessimistic forecasts (340,000–360,000 deliveries). The markets are expecting the decreasing trend to be slower.
Techincal Analyst
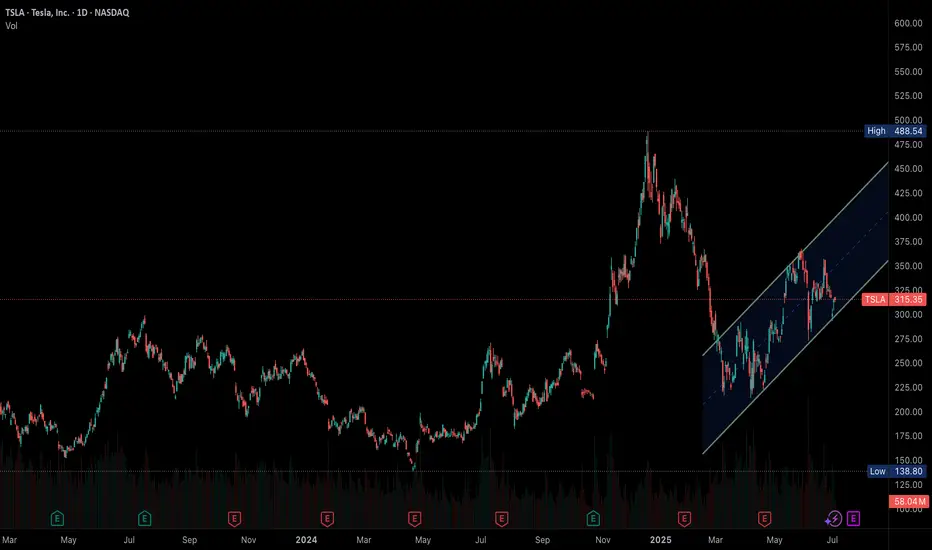
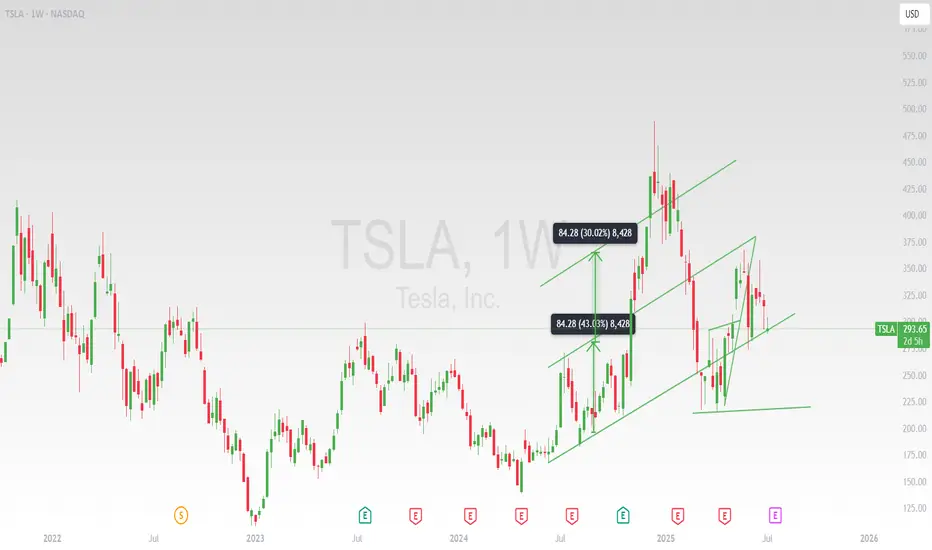
TSLA has rebounded strongly from its 2023 lows, forming a clear upward channel since late 2024. The stock is currently trading near the lower end of this ascending channel, indicating a key support area.
If TSLA sustains above the $300–$310 zone, the uptrend could resume, targeting $350 and potentially $400.
A breakdown below $300 could trigger further declines toward $275 or lower, especially if accompanied by high volume.
TSLA is at a technically important level. Holding above $300–$310 keeps the bullish channel alive, while a break below could signal a deeper correction. For the next directional move, watch for volume spikes and price action near these key levels.
By Van Ha Trinh - Financial Market Analyst from Exness
Diamond Reversal Forming On Tesla ($TSLA)This pattern on TSLA fits the outline for a diamond reversal that is referenced on Investopedia.
It has all the "classical" facets of a diamond reversal which is a high (A), a low (C) a higher-high.
Furthermore, this is happening alongside a very similar pattern on NFLX and some bearish patterns on many other stocks.
Similar forms also occurred on SPX in 2021-2222 and Bitcoin in 2021.
The move up from the 2023 lows has the form of an ABC up... which suggests another 5 wave downmove on-par with or even exceeding the previous downmove is on the way.
The move off the highs was a whole 75% so even presuming a moderate 1:1 ratio, the next wave down could be very aggressive which means that an excellent short could be lining up.
Trade safe and be careful out there.

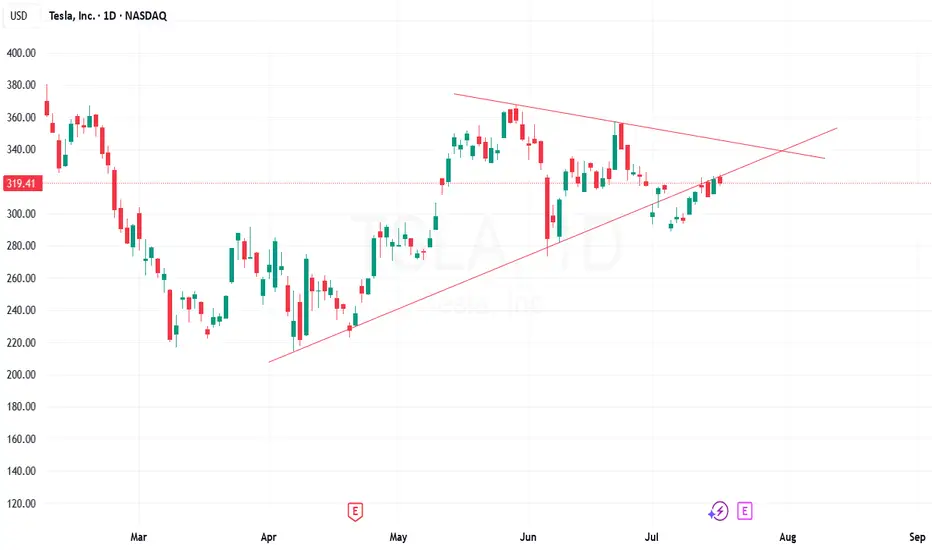
Expected to go in Bearish Mode - Keep watchDaily candle clearly says, retracement from the triangle breakout line completed. It showing as reversal.
TSLA: Anyone knows this pattern?TSLA:
Anyone knows this pattern?
Think contrarily to the market — seek opportunities in things that few people notice or pay attention to, and when you do, opportunities will come to you earlier than they do to the crowd.
.
US STOCKS- WALL STREET DREAM- LET'S THE MARKET SPEAK!
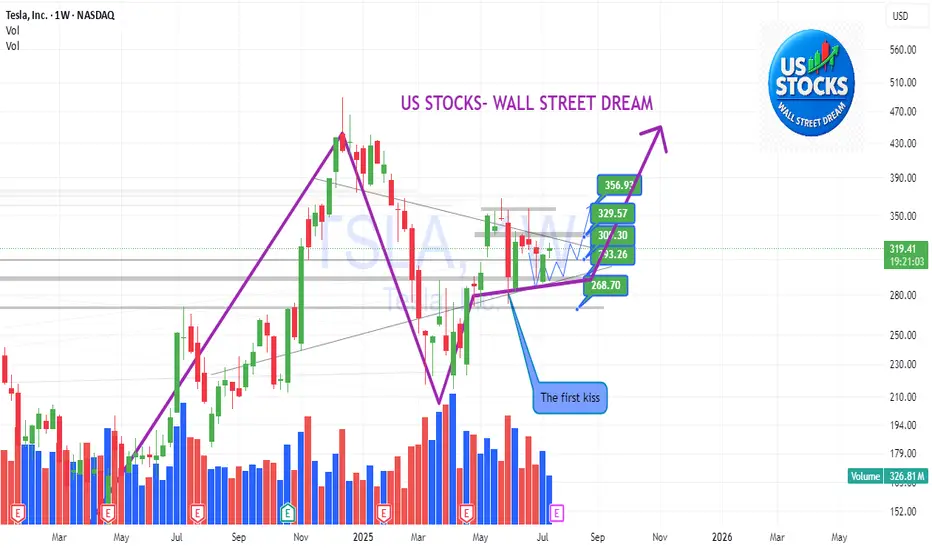
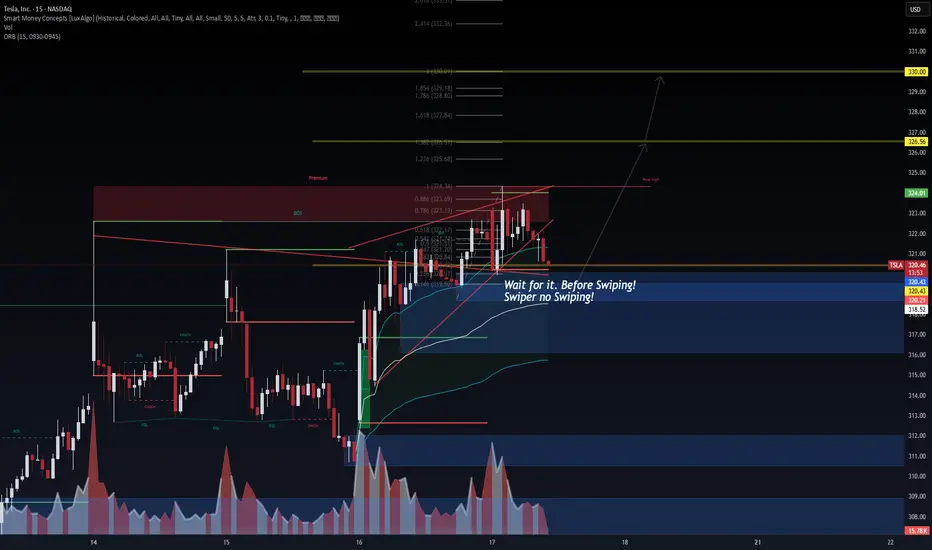
TSLA: Time for the 2/3 rally?TSLA remains tightly wedged inside a bullish pennant, hovering just above the ORB high (324.01) and within the premium SMC zone. Smart Money structure is clear:
🔹 Bullish BOS + CHoCH stacking
🔹 Fibonacci confluence from 0.618 to 0.886 holding strong
🔹 Hidden demand resting at 320.21 / 318.66 zone
🧠 VolanX DSS Logic:
Break above 324.34 unlocks liquidity toward 1.236 = 325.68, then key magnet zone 326.56
Liquidity sweep + micro pullback ideal entry signal
Volume shows absorption at each higher low → bullish intent
🎯 Trade Plan (15m):
Entry: 322.00–324.00 with confirmation
Target: 326.56 → 328.18
Invalidation: Below 320.21 BOS flip
ORB + Fib + SMC stack = High-conviction directional play
💬 Price may seek inefficiencies left in prior imbalance zones below, but current order flow favors upside continuation.
📢 This analysis is powered by the VolanX Protocol under WaverVanir DSS — where liquidity meets logic.
#TSLA #WaverVanir #VolanX #SMC #DayTrading #Fibonacci #ORB #SmartMoneyConcepts #Tesla #MacroEdge #OptionsFlow
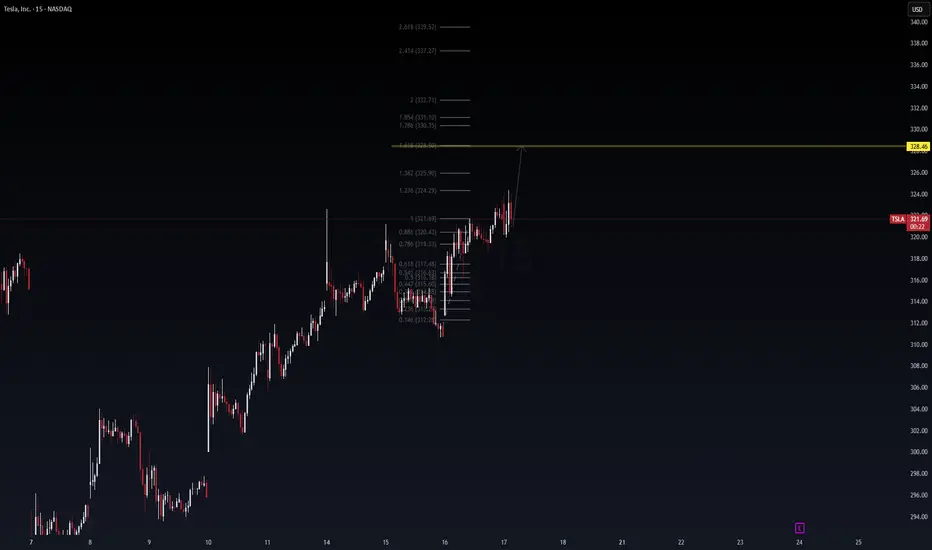
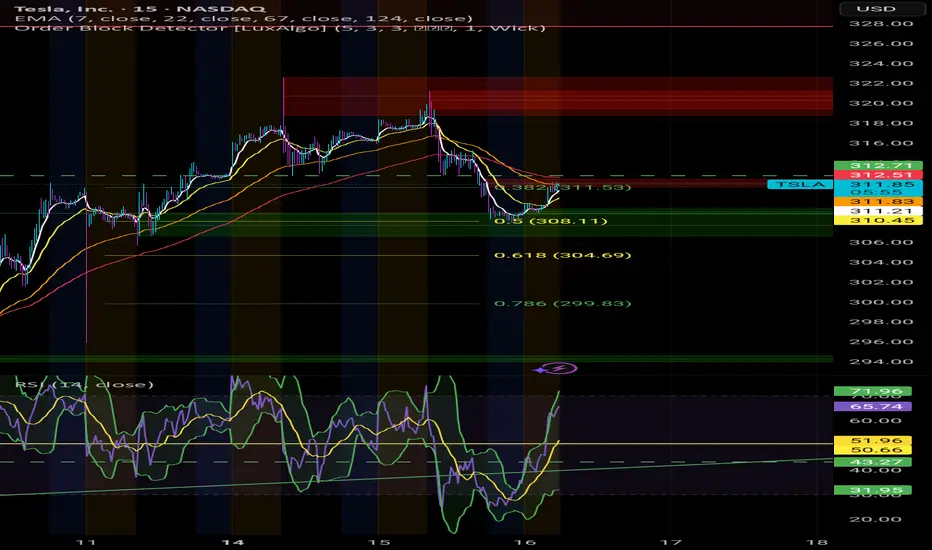
TSLA Fibonacci Launchpad: 328.46 in Sight? (15-min Daytrade Setu🔋 TSLA Fibonacci Launchpad: 328.46 in Sight? (15-min Daytrade Setup)
Posted by WaverVanir_International_LLC | Powered by VolanX Protocol
TSLA continues to show bullish continuation structure on the 15-min timeframe. After a textbook retracement to the golden pocket (0.618–0.786), bulls defended $315-$317 zone and reclaimed $321 resistance.
📌 Technical Thesis
Clean impulsive wave from $312.24 → $321.69
Consolidation → Breakout structure with low selling volume
Fib extension targets 1.618 at $328.46, followed by confluence zones at $331 and $332.71
Price respecting higher lows, forming micro bull flag
📈 Entry Idea:
Intraday breakout confirmation above $324.29 (1.236 extension)
Risk-managed long setup with stops below $320.43 (0.886)
Target zones: $328.46 → $330.35 → $332.71
⚠️ Risk Note:
Heavy resistance expected around $328–$332 zone. Scalp profits near extensions or trail stops tight.
🔮 VolanX Signal Score: 7.5/10
Favoring upside continuation unless macro catalyst shocks sentiment.
#TSLA #DayTrading #Fibonacci #Scalping #VolanX #WaverVanir #TechStocks #OptionsFlow #AITrading #PriceTargets #TeslaTraders
TSLA: DT 7/16/2025Took a trade at the fair value gap 15 min TF, If the market is going to reverse it is either going to be from .50 or .382.
Is the BullRun over? I don't think so. $TSLAYesterday we saw a somewhat heavy fall in Indexes, and it probably scared alot of retail Bulls outs.
However, it seems we've fallen straight into potential medium term supports across multiple stocks in the markets.
I'm convinced we will get a good economic data print today.
This would open the door to new ATHs, again, in the Indexes.
For this to play out, the local bottoms established over night need to hold.
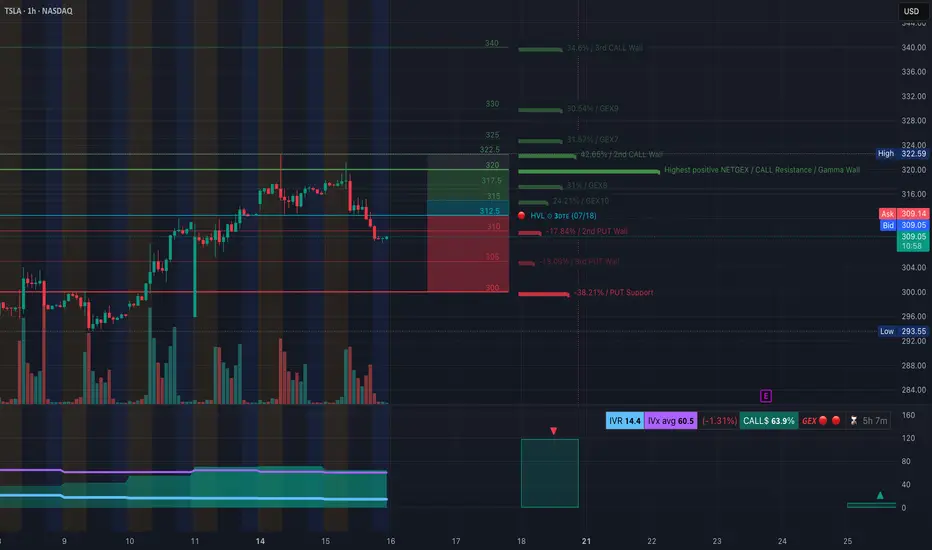
TSLA at a Turning Point. Gamma Flip + Price Breakdown? TAJuly 16🔍 GEX Analysis (Options Sentiment)
* Key Call Walls (Resistance):
* $322.5: +42.65% GEX — Major resistance and 2nd Call Wall
* $325 / $330: More overhead call resistance
* $317.5: Minor resistance
* Gamma Flip Zone (Highest Net GEX / Resistance):
* Around $320–322.5, price is likely to face supply pressure from dealers hedging short calls.
* PUT Walls (Support):
* $305: 2nd PUT Wall (−17.84% GEX)
* $300: PUT Support (−38.21% GEX)
* HVL (High Volume Level):
* $312.5: High-volume strike for this week’s expiration – significant battleground.
* IVR/Flow:
* IVR is 14.4 – low implied volatility.
* Call bias dominates: Calls 63.9% vs Puts.
* GEX sentiment = 🟥 Bearish leaning.
💡 Options Strategy Based on GEX
* Bearish Play:
* Buy 305P or 300P for short-term swing into the gamma void.
* Best risk:reward as dealers are likely to unwind positive gamma, accelerating downside toward PUT walls.
* Neutral-to-Bearish Strategy:
* Bear Call Spread around $317.5–$322.5 (above HVL, inside call wall congestion).
* Expect price rejection below $317.5 if no reclaim happens.
* Avoid CALLs unless price reclaims and holds above $317.5 with strong volume and momentum shift.
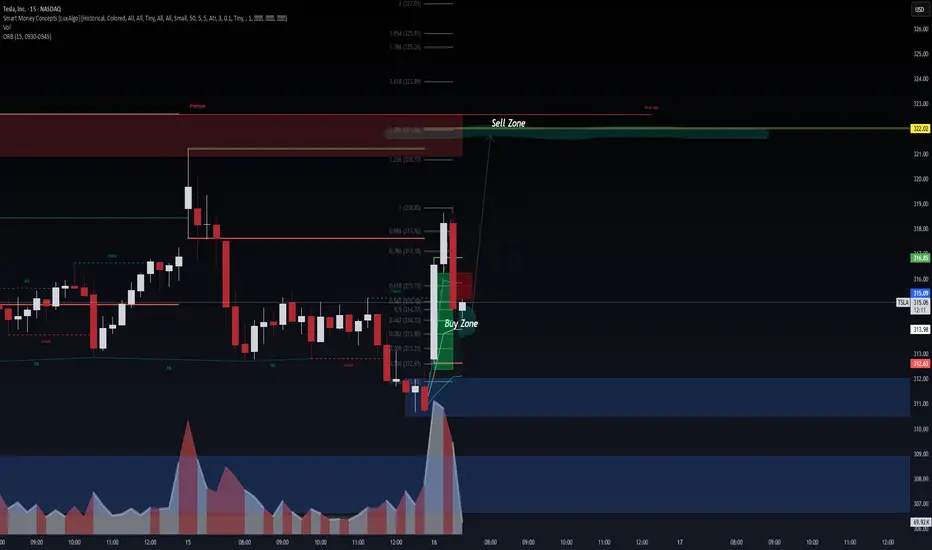
📈 1-Hour Chart Technical Analysis
* Structure:
* Bearish CHoCH and confirmed Break of Structure (BOS) below $310.
* Price dropped from the upper OB and failed retest confirms supply zone around $317–$321.
* Trendlines:
* Descending wedge forming with lower highs and current support at $307.97 and $305.
* Watch for bounce-to-fail retests at $312.5 or breakdown continuation.
* Zones to Watch:
* Bearish Order Block (OB): $316–$321 (purple zone) = Sell zone.
* Demand/Support Zone: $293–$296 (green box) – likely bounce zone.
📌 Trade Scenarios
* Bearish Intraday Trade Setup:
* Entry: Below $309 or retest rejection from $312.5
* Target: $305 → $300
* Stop: Above $313 or OB invalidation at $317.5
* Bullish Counterplay (Only if confirmed):
* Entry: Hold above $317.5
* Target: $322.5 → $325
* Stop: Break below $315
🎯 Final Thoughts
TSLA looks weak and in distribution after sweeping local highs. The current GEX map favors bearish continuation, and the 1H BOS confirms breakdown structure. Unless $317.5 is reclaimed, bears have the upper hand.
Disclaimer: This analysis is for educational purposes only and not financial advice. Always do your own research and manage risk before trading.
Stocks SPOT ACCOUNT: TESLA stocks buy trade with take profitStocks SPOT ACCOUNT: MARKETSCOM:TESLA stocks my buy trade with take profit.
Buy Stocks at 297 and Take Profit at 319.
This is my SPOT Accounts for Stocks Portfolio.
Trade shows my Buying and Take Profit Level.
Spot account doesn't need SL because its stocks buying account.
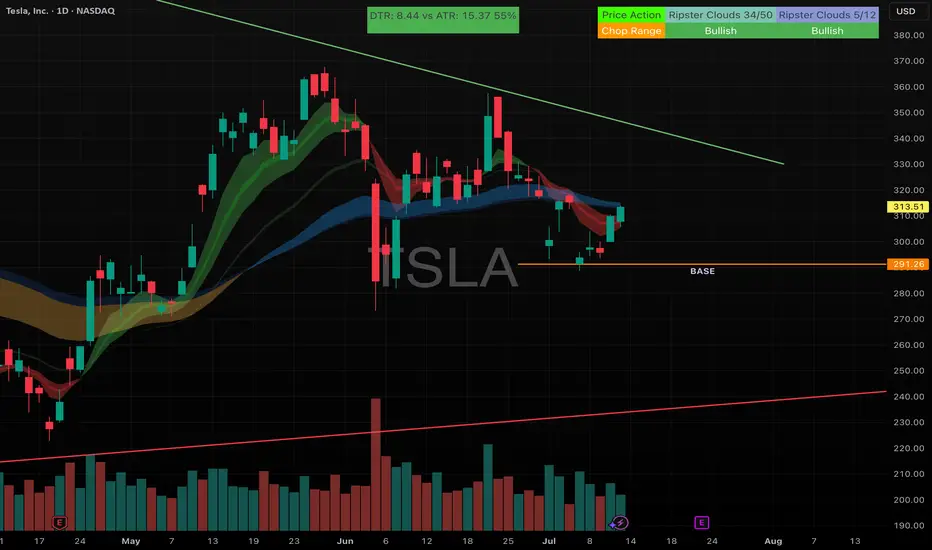
TSLA / Earning seasonNASDAQ:TSLA showing nice price action bounce off the base last week. With earnings season here, watch the $315 level — a breakout could send it toward $320 and $326 next 🚀📈 #TSLA
$Tsla $350 looks promisingNASDAQ:TSLA $350 looks promising in the upcoming weeks.
AMEX:SPY NASDAQ:QQQ NFA
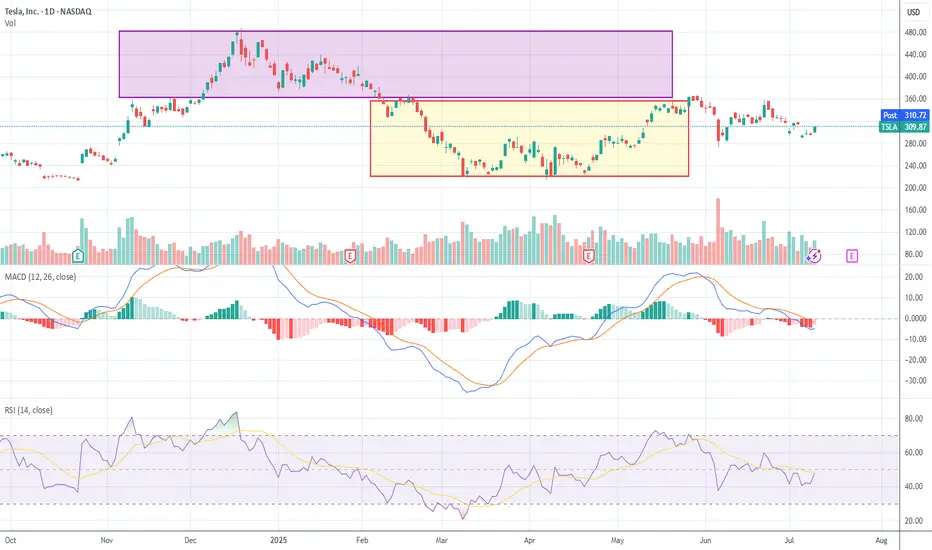
Tesla Flashes Bullish Reversal: Engulfing Candle and Volume PoinLet’s reassess TSLA now that we have this new candle (a big move +4.73%) in context. This changes things substantially, so I’ll reapply candlestick techniques, assess trend health, box positioning, and momentum.
Candlestick Analysis
The new candle:
Large white body (+4.7%) closing at $309.87. Engulfing prior 2 candles’ real bodies → this is a Bullish Engulfing Pattern. Occurs near the 50% retracement ($290) zone (previous support). Volume expanded vs prior days → adds validity. Bullish engulfing after a down leg is an early reversal signal.
Context:
This happens after weeks of indecision candles (spinning tops / dojis) → classic “coiling” behavior before expansion.
Trend Health & Momentum
MACD: Still below zero but histogram bars turning less negative → momentum starting to shift.
RSI: Up to ~47.6, breaking out of its down channel. A move >50 would confirm momentum pivot.
Box Dynamics
TSLA just punched through the upper edge of Box 2 ($300) with conviction.
Now entering “no man’s land” between Box 2 ($300–$360) and Box 1 ($360–$465).
For a sustained breakout it must close above $306–310 range for 2-3 days. Ideally see follow-through with a test of $328 (78.6% Fib).
Tactical Breakdown
✅ Breakout case (higher probability now):
Bullish Engulfing + volume expansion at support zone.
Closing above $306-310 increases odds of a run toward $328 (78.6%) and possibly $360.
❌ Reversal back down (lower probability):
Only if TSLA immediately rejects $310 and falls back below $300 in the next 1–2 sessions.
This price action looks like accumulation showing its hand. Large white candle suggests buyers absorbing supply at prior resistance.
Breakout above $306 confirmed if follow-through continues. Odds for a reversal lower just dropped sharply after today’s engulfing.
Tesla Share Price at Key Technical LevelTesla’s share price has returned to a well-established upward trendline. The key question now is: will this trendline act as support and trigger a bounce, or will it be breached, attracting further selling pressure and pushing the price lower?
We’d love to hear your thoughts — will the bulls defend this level, or are the bears gaining ground?
Tesla's Self-Inflicted Crisis of ConfidenceInvestors wanted Elon Musk to double down on EVs. Instead, they got a new political party and another reason to sell the stock.
Musk vs Trump: A Fight Investors Didn’t Ask For
Tesla’s latest sell-off has little to do with earnings or electric vehicles. Shares dropped 6.8% on Monday after Elon Musk announced plans to launch a new US political party, escalating his feud with Donald Trump and reigniting investor concerns about distraction at the top.
The fallout from Musk’s political re-entry has been swift. Tesla’s valuation has lost over $200 billion since late May, when Musk’s role in Trump’s short-lived government efficiency task force came to an end. His renewed focus on political activism contradicts April’s pledge to spend “far more” time on Tesla, and comes at a moment when the business is already under pressure from slowing EV sales and collapsing regulatory tailwinds.
Politics, Profits and a Shrinking Mandate
Trump’s so-called “big, beautiful bill” is slashing support for electric vehicles across the board. Gone is the $7,500 federal tax credit, set to expire in September. Gone too are the emissions penalties that allowed Tesla to bank billions in regulatory credits from legacy automakers. William Blair analysts estimate that over $2 billion in high-margin profit is now at risk.
The political clash is getting personal. Trump has mocked Musk’s behaviour as a “train wreck”, suggested deportation, and floated nationalising SpaceX. Investors, meanwhile, are left questioning whether Musk’s growing list of battles is starting to erode Tesla’s long-term advantage. The distraction risk is real, and the market is responding.
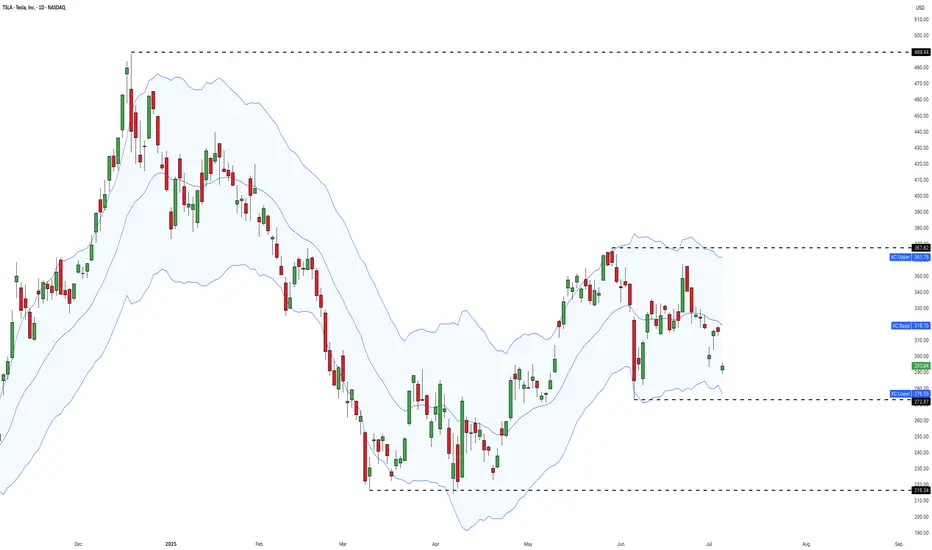
Technical Breakdown: Key Levels in Play
Tesla’s share price has woefully underperformed this year. The stock is down 22% year-to-date, while the S&P 500 is up 6%. Recent price action highlights just how vulnerable Tesla has become to the political whims of its CEO. The public fallout with Trump helped define a new swing high in May, which now acts as clear resistance. A new swing low was formed in early June, and that is now the short-term level bulls need to defend.
Adding Keltner Channels to the chart puts the recent volatility into perspective. The sideways bands and price bouncing between them show a market stuck in broad equilibrium. There’s little directional conviction, but that may be changing. Monday’s sell-off pushed Tesla below the volume-weighted average price anchored to the April lows. If the shares remain below this VWAP and break under the June swing lows, it would confirm the attempted recovery has failed and signal that the bears are back in control.
For now, Tesla isn’t trading like a high-growth innovator. It’s trading like a politically charged meme stock with no clear trend and no adult supervision.
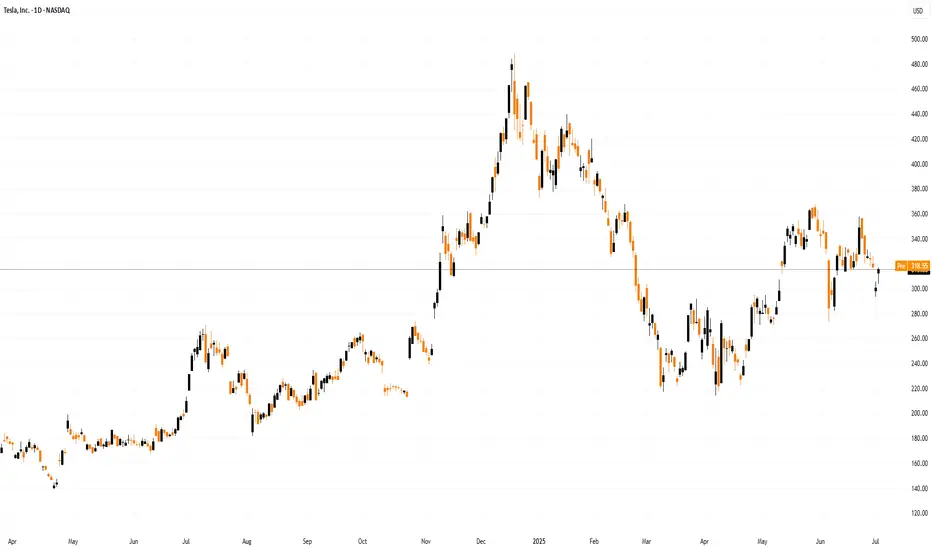
Tesla (TSLA) Daily Candle Chart
Past performance is not a reliable indicator of future results
Disclaimer: This is for information and learning purposes only. The information provided does not constitute investment advice nor take into account the individual financial circumstances or objectives of any investor. Any information that may be provided relating to past performance is not a reliable indicator of future results or performance. Social media channels are not relevant for UK residents.
Spread bets and CFDs are complex instruments and come with a high risk of losing money rapidly due to leverage. 85.24% of retail investor accounts lose money when trading spread bets and CFDs with this provider. You should consider whether you understand how spread bets and CFDs work and whether you can afford to take the high risk of losing your money.
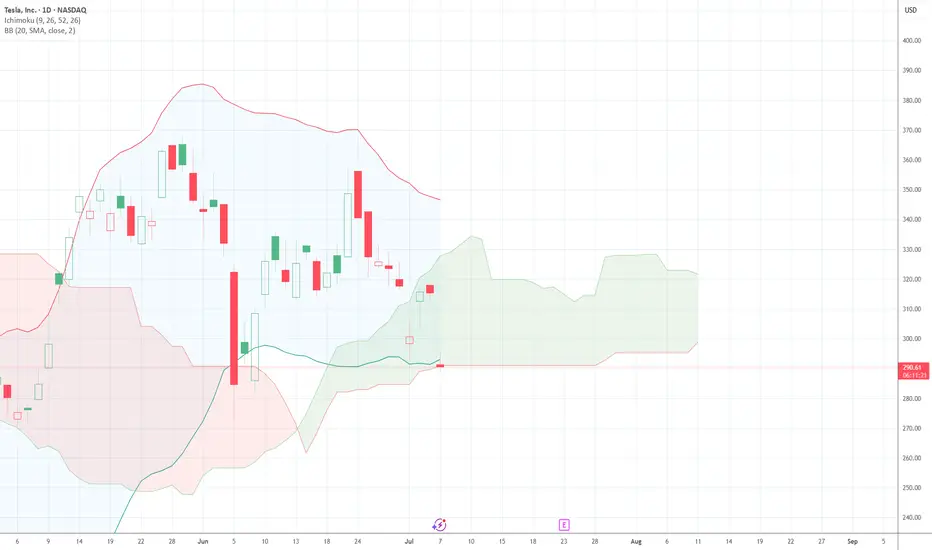
$TSLA hanging by a threadNASDAQ:TSLA getting rocked again today. Gapped down over 7% at open. Literally hanging by a thread on the bottom of the daily cloud. It's also OUTSIDE of the bottom Bollinger band...
Also otm call flow just came in $1.8 million 325c 7/25 @ 6.40
TSLA: Agentic and real world AIThe "this is a just a car company" crowd, as usual, continues to point at the valuation as a reason to short. Not realizing that the valuation has always been high. It's been apart of Tesla's DNA for many years. Like a trend line, you must consider it in your thesis along with everything else.
We will remain on trend. Money printer is running again. Don't get left behind. Don't be a hater because the stock will move the way it wants regardless of how you feel about it.
I'm not a trader.
Direct Access Trading SystemsDirect Access Trading Systems
Direct access trading systems (DATS) offer traders a direct line to financial markets. By bypassing traditional brokerage routes, DATS enable swift, precise trading, essential for strategies reliant on speed and accuracy. This FXOpen article delves into the workings, benefits, and considerations of DATS, providing valuable insights for both seasoned and aspiring traders navigating the fast-paced world of modern trading.
Understanding Direct Access Trading Systems
Direct access trading systems (DATS) revolutionise how traders interact with financial markets, typically in the realm of stock trading. Unlike traditional brokerage platforms, these systems offer direct market access trading, a method allowing traders to place orders directly into the market's electronic order book. Such immediate access is crucial for those who require precision and speed in their trading decisions.
Traditionally, orders placed through brokers are processed internally before reaching the market, potentially causing delays. However, brokers with direct market access provide a conduit for traders to bypass these intermediate steps. These systems typically appeal to day traders and other short-term investors who value the ability to respond swiftly to market movements.
Usually, direct access brokers list Level 2 quotes, where bid and ask prices alongside order sizes are given for the asset, providing an additional layer of valuable information. By offering a more direct link to financial markets, these systems may provide an enhanced trading experience that aligns with the needs of active traders.
Selecting the best direct access broker for day trading involves considering several key factors. Traders look for platforms that offer high reliability and uptime, as any downtime can significantly impact outcomes. Speed of order execution is crucial in capturing market opportunities. Additionally, traders assess the fee and commission structure to ensure it aligns with their trading volume and strategy.
How Direct Access Trading Systems Work
DATS offer a sophisticated network that connects traders directly to financial markets. These systems use specialised software platforms, helping traders make efficient and swift operations:
- Order Entry: Traders use the DATS platform to enter their orders. These platforms are equipped with various order types, such as market, limit, or stop orders, giving traders flexibility in how they execute trades.
- Order Routing: After order placement, DATS route these orders directly to the market instead of through a broker. The process often involves Electronic Communication Networks (ECNs), which play a critical role. ECNs are automated systems that match buy and sell orders for assets, eliminating the need for intermediaries like traditional stock exchanges. They also provide a venue for trading outside traditional hours, offering greater liquidity and potential efficiency.
- Execution: Orders are executed via these ECNs or other market venues. The rapid execution capability is a defining feature of DATS, enabling traders to capitalise on fleeting market opportunities.
- Feedback and Reporting: Following execution, the system promptly provides feedback. Traders receive immediate trade confirmations, including execution price and time, essential in maintaining transparency and control over trading activities.
Through this streamlined process, DATS offer a high-efficiency trading environment. Such a setup is particularly advantageous for strategies that require quick decision-making and execution, such as day trading or scalping.
Advantages of Direct Access Trading Systems
DATS offer several compelling advantages over traditional brokerage platforms, particularly for those who engage in frequent trading. These benefits cater to the needs of active traders seeking efficiency and control in their strategies.
- Speed of Execution: DATS enable traders to execute orders almost instantaneously. Rapid processing is crucial in fast-paced markets where prices can fluctuate within seconds.
- Enhanced Control: Traders have greater control over their orders, including the timing, price, and order type. This level of control is especially crucial in volatile market conditions.
- Access to Real-Time Market Data: DATS provide real-time data, allowing traders to make informed decisions based on the latest market movements.
- Lower Transaction Costs: By eliminating the middleman, DATS often result in lower transaction costs, a significant advantage for high-volume traders.
- Customisation and Flexibility: Many direct access trading platforms come with advanced charting and analysis tools. These tools can be customised to fit individual strategies and preferences.
- Direct Market Interaction: Traders can interact directly with market liquidity providers, potentially leading to better pricing and execution quality.
Risks and Considerations
While these systems offer several advantages, they also come with inherent risks and considerations:
- Increased Complexity: DATS are typically more complex than traditional brokerage platforms. They require a sophisticated understanding of market dynamics and trading strategies, making them better suited for experienced traders. The complexity also extends to the technological infrastructure needed to use these systems, which may involve higher setup and maintenance costs.
- Higher Costs: Using DATS may be more expensive than traditional online brokers. The costs go beyond technology requirements; for example, the price of direct access trading systems and the commissions for trades can be higher. This aspect makes it vital for traders to evaluate the cost-benefit ratio of using DATS compared to other trading methods.
- Stricter Trading Rules: Direct market access often comes with more stringent rules. This could include tighter regulations around repeat dealing, deal rejections if trading outside normal market sizes, and potential penalty fees for inactive accounts.
The Bottom Line
In summary, direct access trading systems may enhance efficiency, offering speed, control, and direct market insights. However, they require a careful approach due to their complexity and cost.
This article represents the opinion of the Companies operating under the FXOpen brand only. It is not to be construed as an offer, solicitation, or recommendation with respect to products and services provided by the Companies operating under the FXOpen brand, nor is it to be considered financial advice.
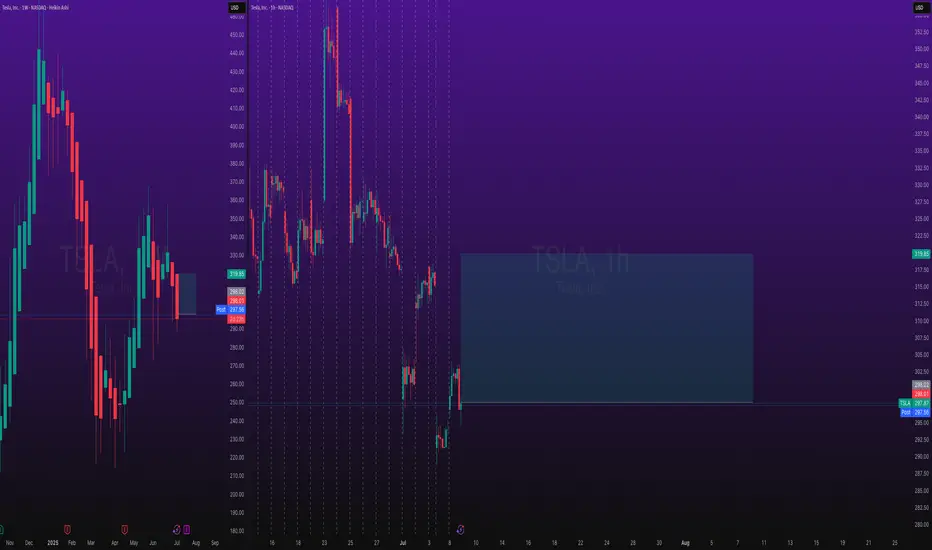
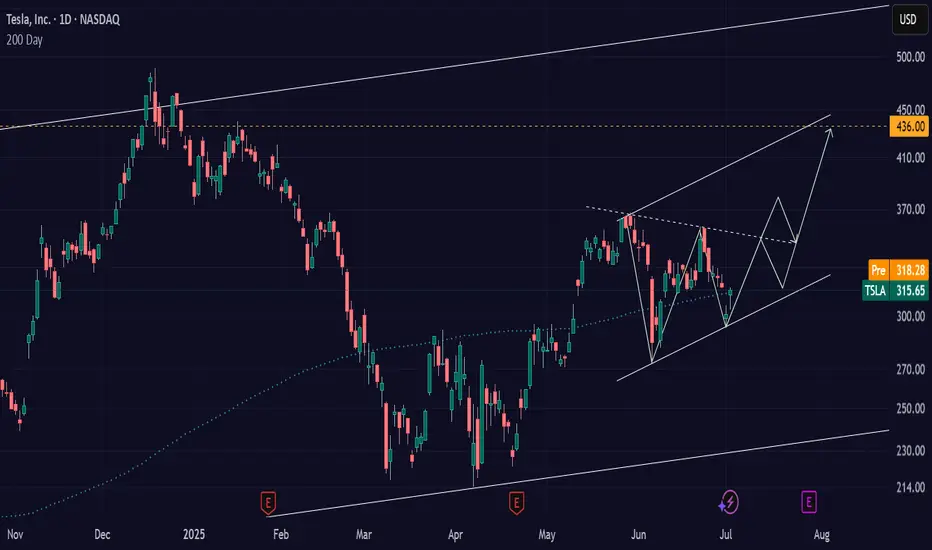
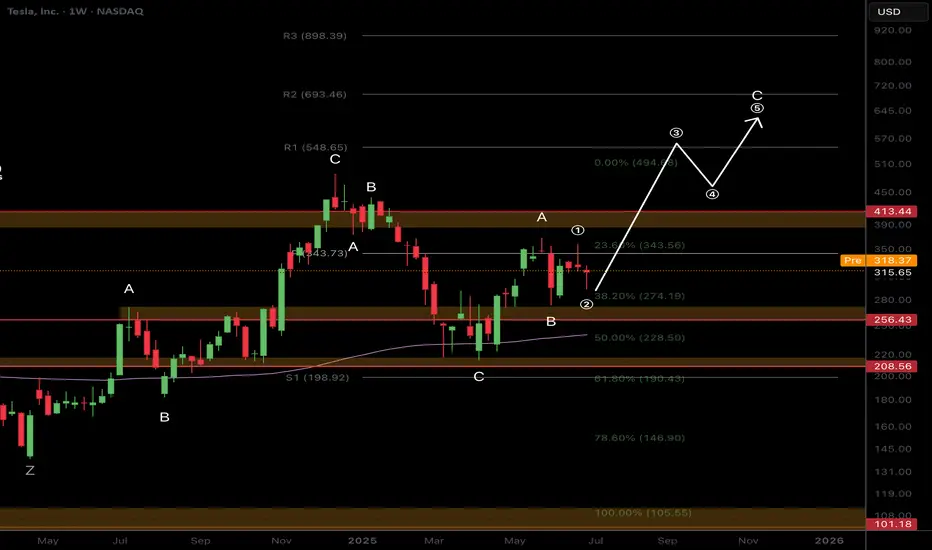
$TSLA Time to Fade or..?NASDAQ:TSLA (like NASDAQ:GOOG ) is standing out to me as bullish, yet, corrective Elliot Waves a higher degree series of ABCs appear to be underway.
A final wave C appears to be underway which would take price too all time highs in an expanded flat correction pattern. My count could be wrong and the interference could be from the increase it sentiment volatility connected to the US headlines lately and Trump posting on socials. Things may get back to normal after the summer and a clearer pattern may emerge.
Price is struggling to get past the weekly pivot point bullishly or the weekly 200EMS bearishly and is trapped within that range.
For now long term target is the R2 daily pivot at $693 as the higher probability is continued upside
Safe trading
Tesla - This bullish break and retest!Tesla - NASDAQ:TSLA - confirmed the bullish reversal:
(click chart above to see the in depth analysis👆🏻)
Tesla recently created a very bullish break and retest. Therefore together with the monthly bullish price action, the recent rally was totally expected. But despite the short term volatility, Tesla remains bullish, is heading higher and will soon create new highs.
Levels to watch: $400
Keep your long term vision!
Philip (BasicTrading)

Big fat cup & handle on the weekly My instinct tells me today was the last dip buying opportunity before parabolic move. The daily chart is showing wedge consolidation and big institutions are buying. Elon just needs to focus
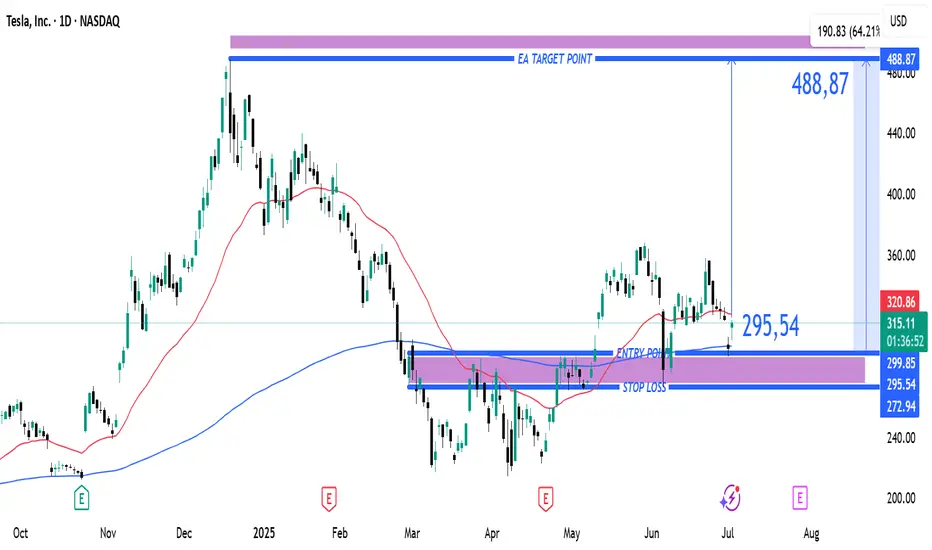
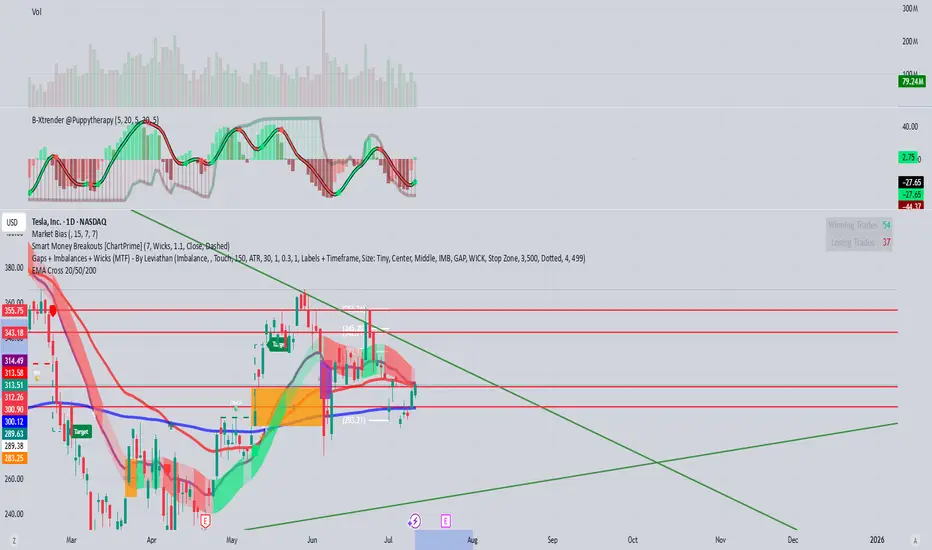
Tesla Bullish Breakout Setup: Entry at $295.54 Targeting $488.87Entry Point (Buy Zone): Around $295.54
Stop Loss: Between $272.94 – $295.54 (lower purple support zone)
Target (TP): $488.87
Current Price: $315.33 (as of the latest candle)
📈 Strategy Summary:
Setup Type: Long (Buy)
Risk-Reward Setup:
Reward: ~$193.33 per share (from $295.54 to $488.87)
Risk: ~$22.60 per share (from $295.54 to $272.94)
Reward:Risk Ratio ≈ 8.6:1 — a high potential payoff if the trade works out.
📊 Technical Context:
Support Zone: Price recently bounced off the support region (marked in purple).
Moving Averages:
Red Line (Short-Term MA): Price just crossed back above.
Blue Line (Long-Term MA): Price reclaimed this level — bullish signal.
Price Action: After a corrective phase, a possible reversal is forming at support, confirming bullish interest.
✅ Bullish Signals:
Bounce from support zone with a strong bullish candle.
Price closing above the 200-day MA (bullish trend resumption).
High reward-to-risk trade setup with clear stop loss.
⚠️ Considerations:
Confirmation with volume or a second bullish candle would add confidence.
Watch for earnings or macro events that could disrupt the trend.
Tight stop is essential to avoid drawdowns if the setup fails.
🔚 Conclusion
This is a well-structured long setup with a high potential reward. If price maintains above the entry zone and breaks recent highs, a push toward the $488.87 target is plausible.