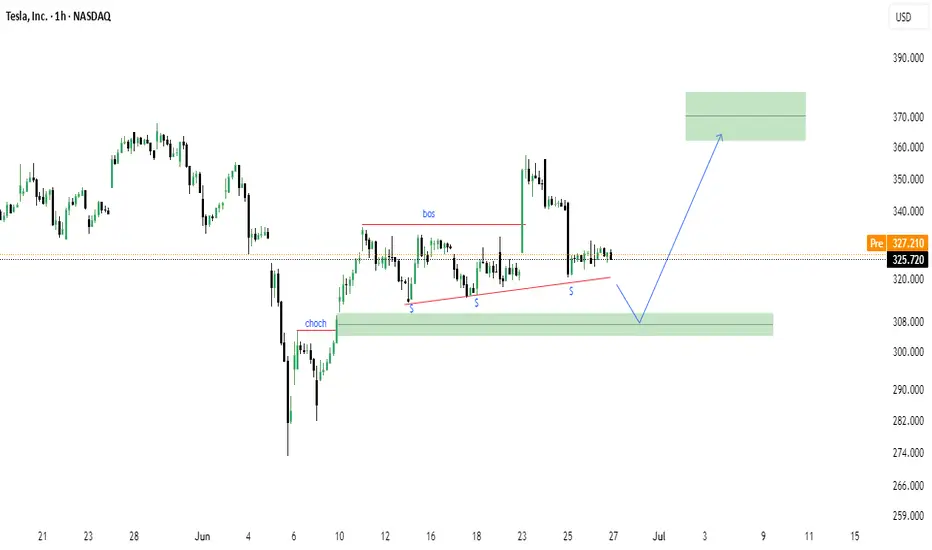
Tesla (TSLA) -Bullish Reaccumulation Setup | Smart Money conceptTesla shows a clean CHoCH followed by BOS structure, indicating a potential bullish continuation. The market is forming equal lows into a demand zone (green box), suggesting a possible liquidity sweep before a move higher.
Key Technical Points:
CHoCH (Change of Character) confirmed on strong bullish impulse.
BOS (Break of Structure) signals market intent to continue upward.
Ascending triangle structure with multiple support tests (marked "S").
Anticipated sweep into demand zone: $308–$312 area.
Potential upside target: $365–$375 supply zone.
Bias: Bullish on confirmation of demand reaction.
Disclaimer:
This is not financial advice. Always do your own analysis before investing.
0R0X trade ideas
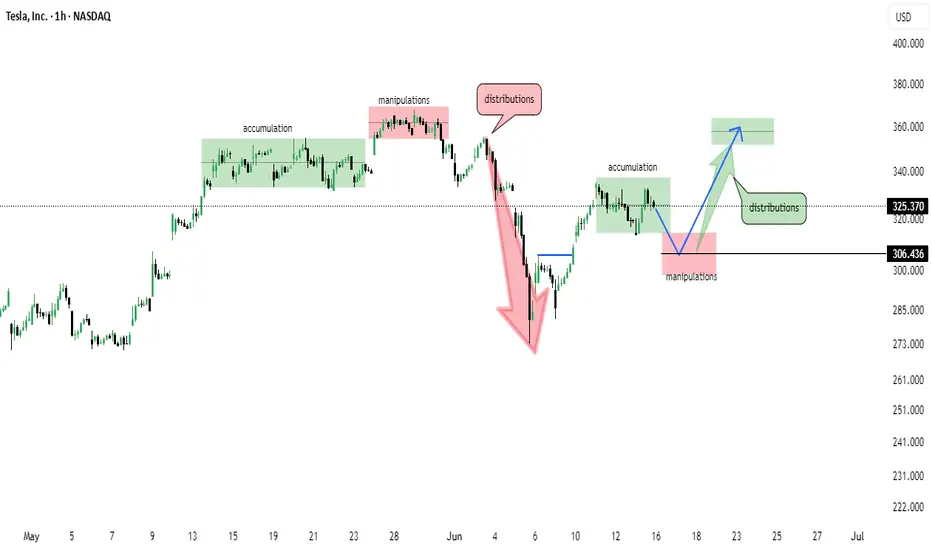
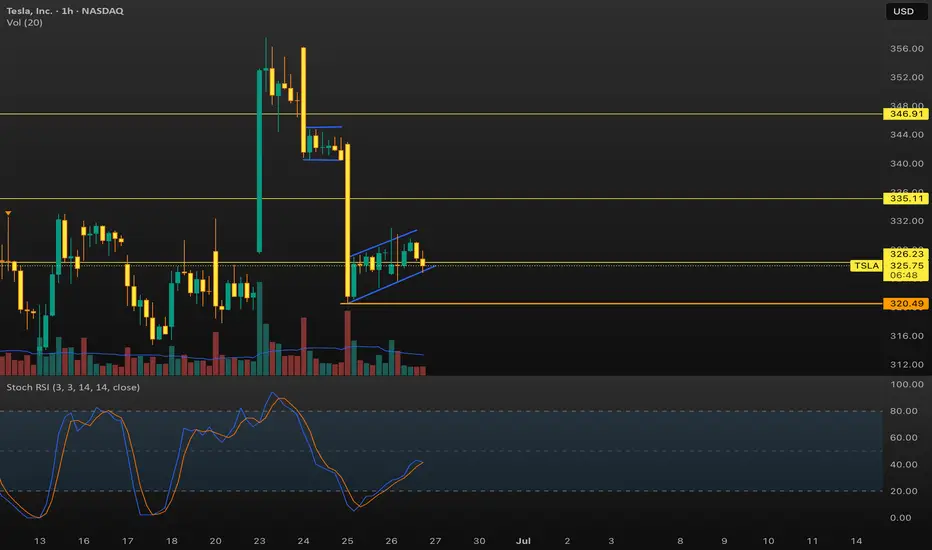
Tesla (TSLA) 1H Chart – Wyckoff Cycle in ActionThis chart reflects a textbook Wyckoff pattern unfolding on TSLA’s 1-hour timeframe:
🔹 Accumulation Phase observed early May
🔹 Followed by Manipulation & Distribution – classic trap before markdown
🔹 Sharp selloff led to another Accumulation zone around $305
🔹 Further manipulation wicks indicate smart money involvement
🔹 Now projecting a move towards $360–$370 distribution zone
📌 Structure breakdown:
Smart Money Accumulation ➡️ Manipulation ➡️ Distribution
Bullish momentum building from $306 support
Eyes on reaction near the marked green distribution box 📦
📅 As of June 15, 2025 – chart aligns with Wyckoff theory and institutional behavior.
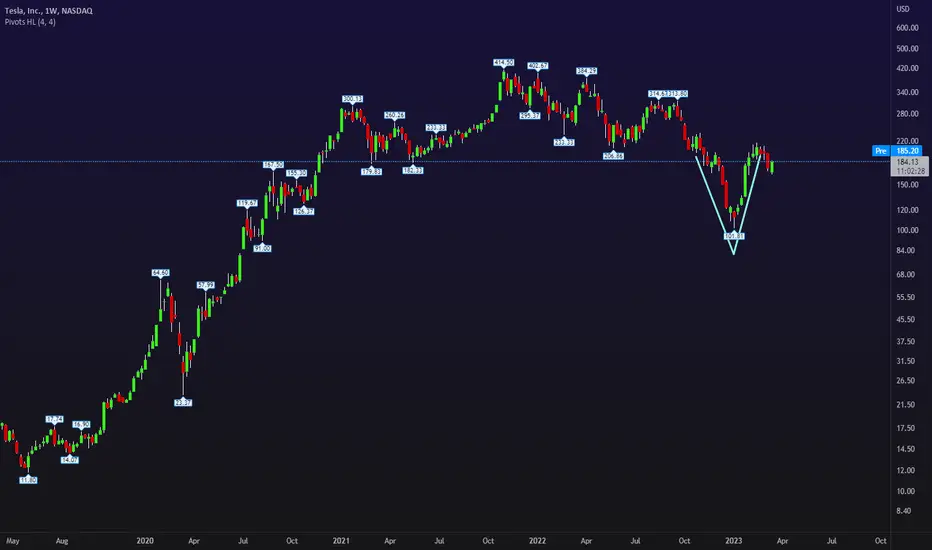
V-Bottom + Apocalypse news => Going UpV bottom was formed.
News are clearly bearish in a conclusive way =>> fool the public to sell shares to the big fish while the market will go up...
Overall market sentiment under the hood is bullish. Public is in huge fear of banks that collapsed and will continue to collapse, so the masses will sell stocks on an up wave fearing it will go down.
How else you will make the mass public sell their stocks? if there is no apocalypse on the way...? think about it...
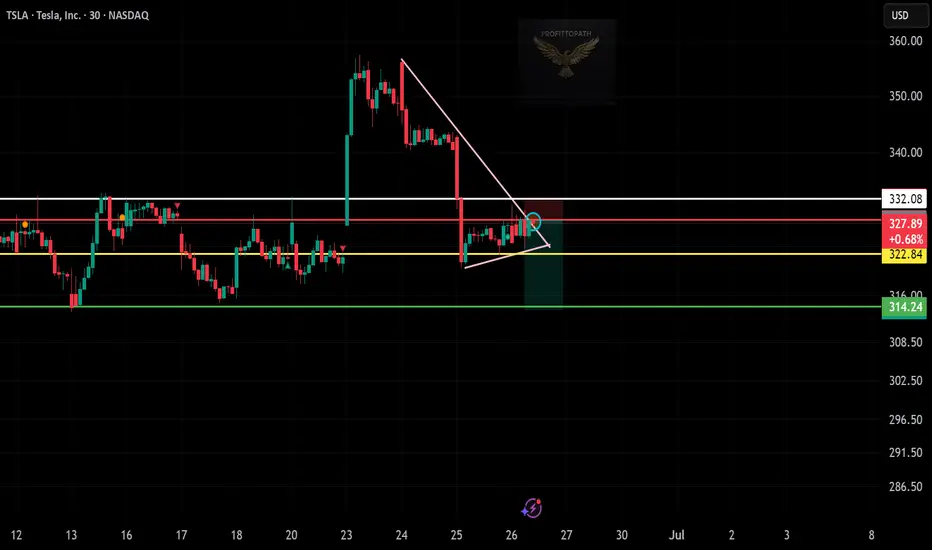
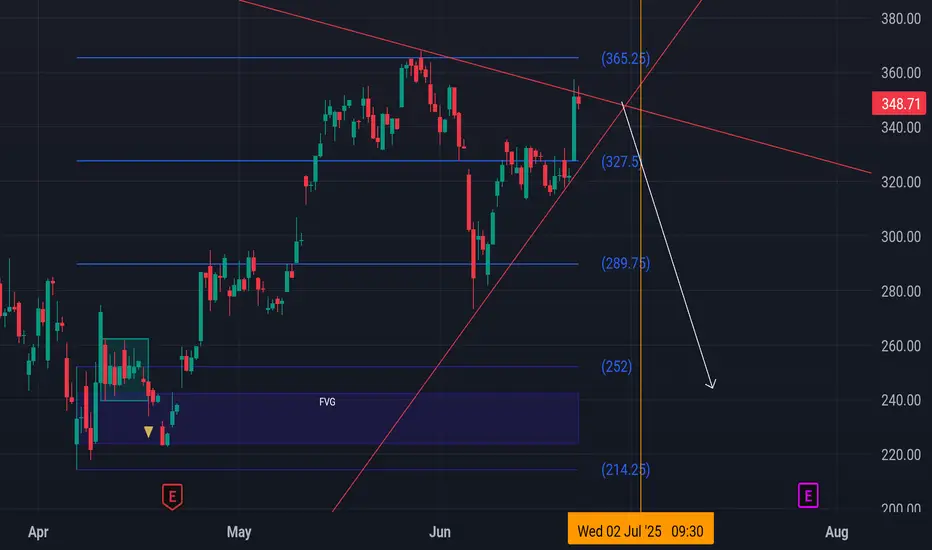
TSLA Short Setup Alert!Price rejected near resistance and forming lower highs.
Entry: $327.78 | Stop: $332.08
Target: $314.24 — watching for breakdown below support.
#TSLA #ShortTrade #TechnicalAnalysis #StockMarket #TradingSetup
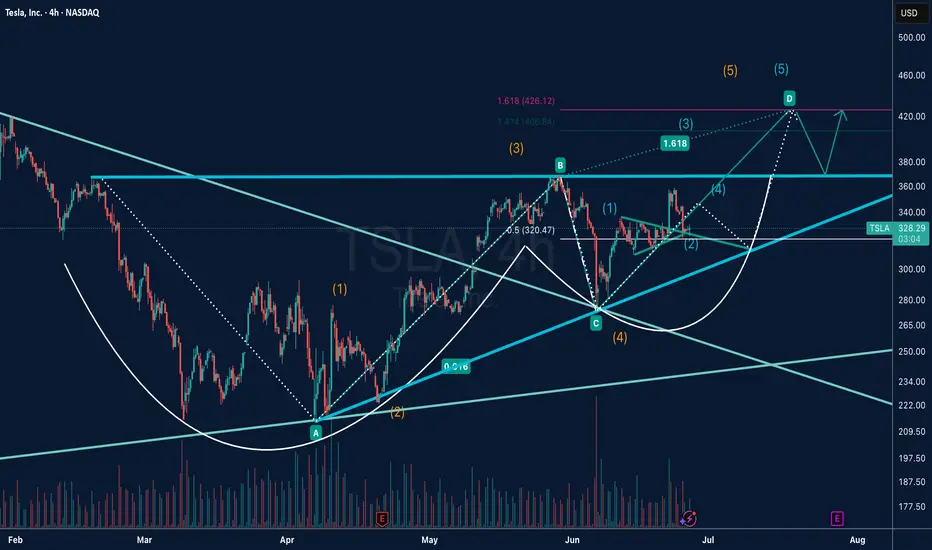
TSLA Elliott Wave Analysis | Bullish Scenario UnfoldingThis chart presents a detailed Elliott Wave analysis on Tesla (TSLA) in the 4-hour timeframe.
The price structure from the April low suggests a completed corrective ABC pattern, forming a solid wave (4) base.
A new bullish impulse appears to be underway, with wave (1) and (2) of wave (5) already confirmed.
We are now tracking the development of wave (3), which has the potential to extend toward the 1.618 Fibonacci extension zone around $426, with intermediate resistance at $406.84 (1.414 Fib).
The projected wave (5) could complete near $440, marking the end of a larger degree 5-wave impulse structure.
Key levels to watch: support near $320.47 (0.5 retracement level of wave 1–3) and resistance at $360–380 before the next leg higher.
Two possible scenarios are outlined:
Primary Path (solid lines): Strong bullish continuation toward wave D and (5).
Alternate Path (dotted lines): Short-term correction back to the trendline support before resuming the uptrend.
The chart also highlights the breakout from a long-term descending trendline and a potential cup-and-handle continuation pattern, supporting the bullish thesis.
📈 Trade Plan: Watching for confirmation above $360 to target $406 and $426+ in the coming weeks. Stops should be considered below $310 depending on risk tolerance.
NFA
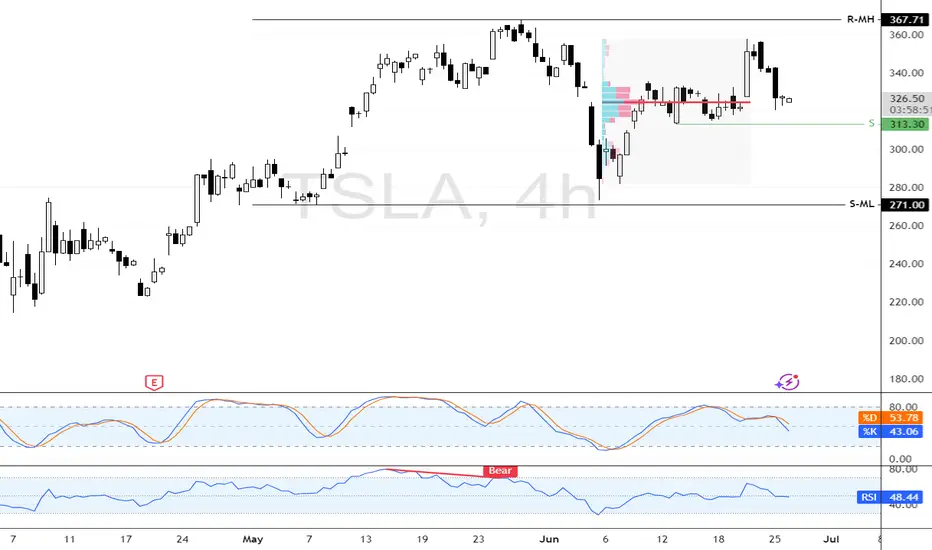
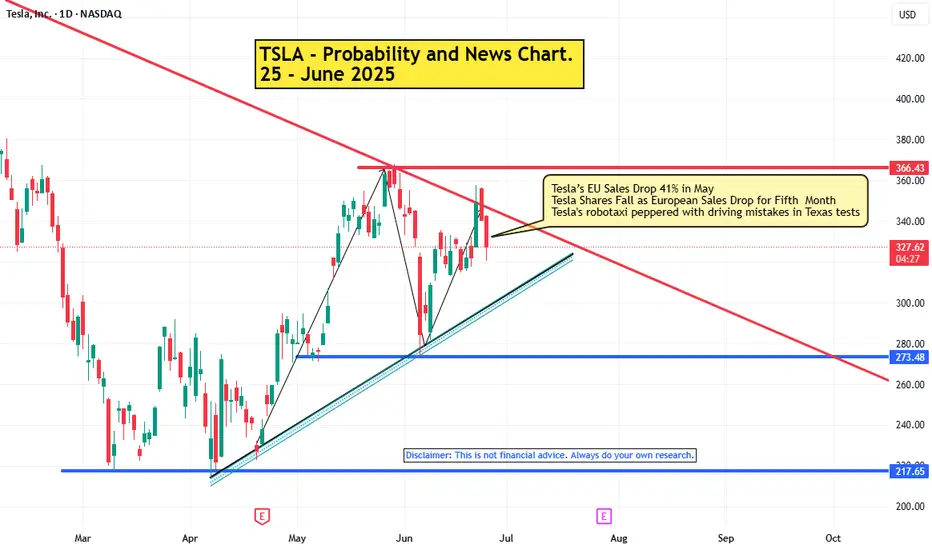
Key Support at $313.3 Holds Potential for TSLA UpsideTesla tested the order block with an average price of $325.00 in yesterday's trading session. The critical support for TSLA is at $313.3, and if this level holds, the price can target $367.71.
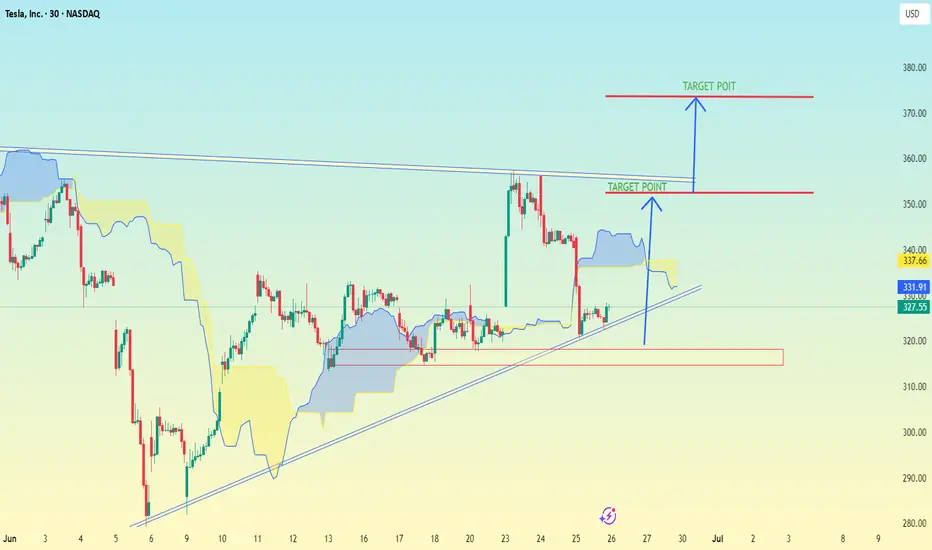
TESLA..(TSLA) 30M TIME FRAME..Tesla (TSLA) on a 30-minute timeframe using Ichimoku Cloud along with trendlines and breakout levels.
There are two target levels indicated:
---
🔵 Immediate Target Point (Breakout Target):
Price Level: ~$350
This seems to be the first breakout target if price breaks above the current resistance zone.
Based on the measured move from the ascending triangle or trendline breakout.
---
🔵 Extended Target Point (Full Target):
Price Level: ~$375–$380
This is the higher target possibly based on a full breakout move from the bottom of the triangle pattern to the top projection.
---
🟢 Current Price: ~$327.55 (at the time of the screenshot)
🧠 Suggested Trade Plan (if you’re trading this setup):
Entry: Above breakout level (possibly ~$335–$340)
First TP: $350
Second TP: $375–$380
Stop Loss: Below trendline or recent support (~$320 or slightly lower)
Let me know if you want a risk-reward analysis or SL/TP calculator based on your entry.
TSLA PRICE ACTION JUNE 25 2025This is the price action for Tesla. I have discussed all the levels. I have given a trade today & have discussed it thoroughly.
If you have any doubts, then feel free to Dm me or leave a comment below
NOTE:DO NOT BUY CALLS

TSLA shortPart of a larger analysis, at the moment Tsla rejected 332 B pivot and imo retesting possible b.o. area. missed gap up open, retest of highs sent 305p strike. looking to close at 310-305 tgt zone. n.f.a. g.l.h.f

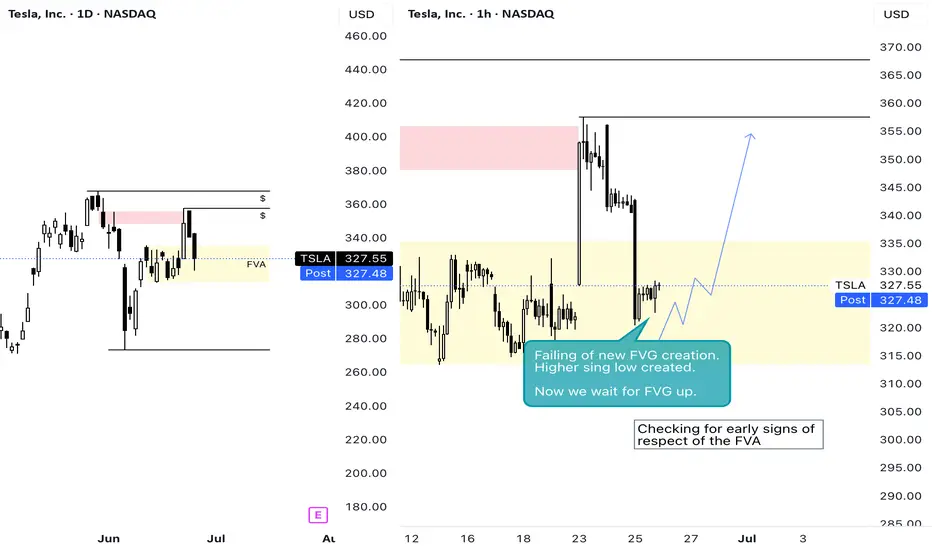
AoO Series No.3Wed - Monitoring the FVA reaction. The last swing high on the D is the last line of defence of the bearish FVG. If we run that high, there is no resistance left and we enter an area of opportunity.
Monitoring on the 4H and 1H early signs of respect of the FVA.
TSLA : Up trend is becoming weakNASDAQ:TSLA is in Up trend. But the uptrend is becoming weak. Bullish momentum may become weak here. It has pull backed from the down trend line. So It may enter in sideways trend. Down trend line may act as resistance and up trend line may act as support.
Will the Robotaxi euphoria continue to push TSLA higher?NASDAQ:TSLA pushing higher the last few days thanks to the start robotaxis. Will this rally continue? the answer is yes until the LIS gets broken.
LIS is at 311, any break below will give a retrace. If you are long, get out and get back in when the next LIS gets broken on the upside. This is efficient investing. Don't waste time doing HODL.
LIS is evolving over time, I will keep you updated on it.
This is really simple trading based on important levels. Keep following my post, so you can see it by yourself.
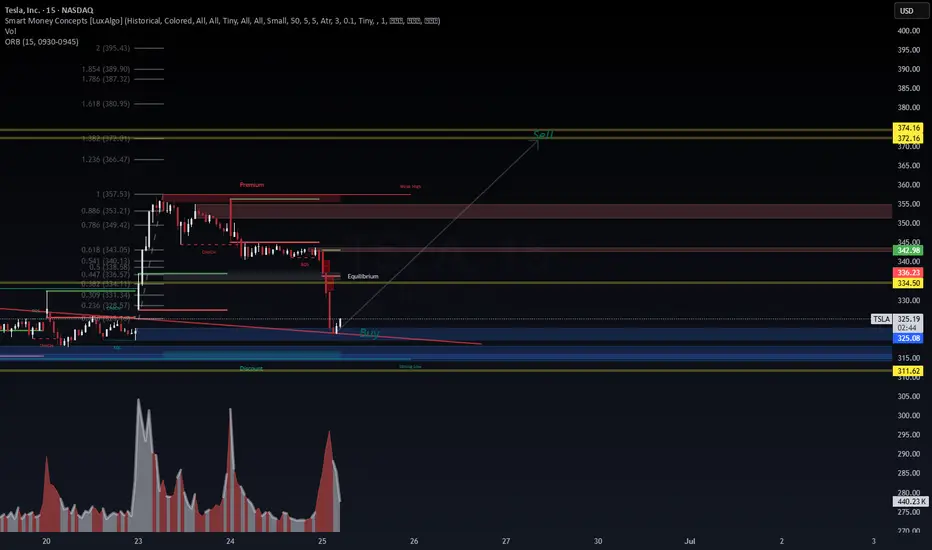
TSLA Intraday Reversal Setup | Smart Money Buy Zone HitTesla just tapped into a deep discount + strong demand confluence with SMC confirmation.
📍 Buy Zone: $311–$324
📍 Target Zone: $372.16 – $374.16 (liquidity above weak high)
📍 Midpoint (EQ/TP1): $336.23 – $345
Trade Thesis:
BOS confirmed after internal CHoCH
Price swept lows into premium discount zone
Volume spike + divergence near key Fibonacci (0.236–0.382)
Bullish intent visible if PA reclaims 336.23 (EQ)
🎯 Targeting ~15%+ intraday swing from reaccumulation. Ideal for scalpers with asymmetric R/R profiles.
🧠 Wait for confirmation – this is where Smart Money steps in.
⚠️ Not financial advice. Educational content only.
#TSLA #Tesla #SmartMoneyConcepts #SMC #LiquiditySweep #Equilibrium #Fibonacci #DayTrading #Scalping #VolumeProfile #WaverVanir #TradingView #IntradayEdge
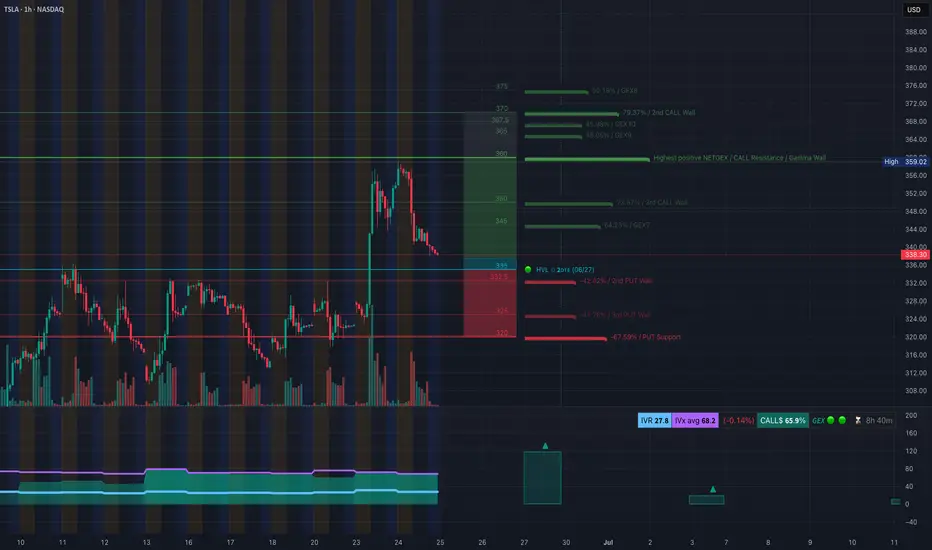
TSLA: GEX Points to Bounce Setup. Is This the Dip to Load Calls?📊 GEX-Based Options Suggestion
Gamma Exposure (GEX) data paints a bullish opportunity if TSLA holds the critical support zones:
* ✅ Key GEX Levels:
* $338: Near current price, minor GEX flip zone.
* $345–$350: Strong upward magnets (3rd Call Wall + GEX build-up).
* $359: Gamma Wall + Highest Net Positive GEX — market makers may pin price near this into end of week if bulls hold.
* 🛡️ Below Support:
* $330: Light PUT defense.
* $320: Major Put Support (-67.5%) — strong bounce zone if downside accelerates.
🔔 Option Trade Idea Based on GEX:
With TSLA near the $338 zone and GEX showing stacked resistance above + positive net exposure, a high-risk/reward call entry is forming.
* Play: Buy 345C or 350C expiring 06/28 or 07/05
* Trigger: Only if price holds $335+ and shows strength with volume bounce
* Target: $345 → $350 → potential pin near $359 (Gamma Wall)
* Stop: Close under $332 invalidates the bounce setup
🧠 Trading Setup – 1H Chart (Second Image)
From the second image, we analyze price action and structure to validate the GEX idea:
📉 Market Structure:
* Price is pulling back into a prior demand zone from $335–$338.
* Trendline support + Fair Value Gap zone + SMC CHoCH aligning at this base.
* Multiple bullish CHoCHs suggest potential reaccumulation if support holds.
🎯 Trading Plan Based on Price Action:
Bullish Case (Base Holds):
* Entry: $335–$338 zone (bounce off trendline and demand zone)
* Target: $345 (GEX level) → $348 → $350
* Stop-Loss: $331
High confluence with GEX option play. Use volume spike for confirmation.
Bearish Breakdown Scenario:
* Trigger: Loss of $331 + trendline break
* Target: $325 → $320 (strong PUT wall support)
* Put Options: 325P or 320P if breakdown triggers with momentum
⚠️ Summary:
TSLA is entering a decision zone — GEX shows bullish opportunity if $335 support holds, with upside targets toward $350–$359. But if price breaks under $330, expect a flush toward PUT support.
Patience is key — let price confirm the bounce or the break.
This setup is for educational purposes only. Trade with discipline and use stops. Always do your own research.
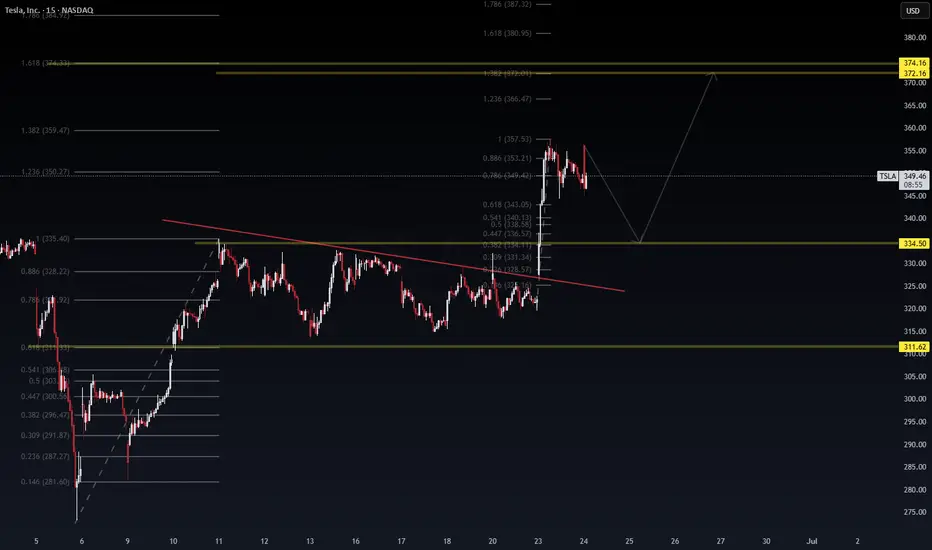
Technical Analysis – TSLAChart Summary:
Current Price: ~$349.21
Local Top: ~$357.53 (100% Fib extension)
Bearish Rejection: Notable wick + retrace from 0.886–1.0 zone
Probable Pullback Zone: 343.00–338.50 (Fibonacci 0.618–0.5 retracement)
Major Support Levels:
$334.50 – Prior key horizontal + Fib confluence
$311.62 – Historical demand zone
Projection:
Intraday double-leg correction toward $338–$343
Possible bounce and continuation toward the golden target zone:
$366.47 (1.236 Fib)
$374.16–$380.95 (1.618 zone)
🌍 Macro Alignment
Bullish backdrop:
Tech sector leading broader rally
Tesla’s robotaxi and AI narrative lifting sentiment
Oil down → margin relief for EV production
Catalysts this week: Powell testimony, PCE inflation
📈 Trading Plan
Type Direction Entry Target(s) Stop Loss Confidence
Intraday Bearish $352–$353 rejection zone $343 → $338.5 Above $357.5 🔶 Medium
Swing (Buy the dip) Bullish $338–$334 zone $366.47 → $374.16 Below $330 🟢 Strong
📌 Suggested Strategy
Scalp short if rejection at $353.2–$357.5 confirms with bearish candle on volume.
Add long exposure if price consolidates or reverses from the $338–$334.5 support area.
Monitor Powell’s remarks – Any dovish tilt could accelerate tech upside.
TSLA sentiment remains strong, but intraday shakeouts are expected.
✍️ Summary Signal
“TSLA remains bullish on a swing basis, but intraday looks set for a Fibonacci pullback to $338–$334. Buy dips if structure holds. Macro backdrop (robotaxi + Fed pause) supports continuation to $366–$374.”
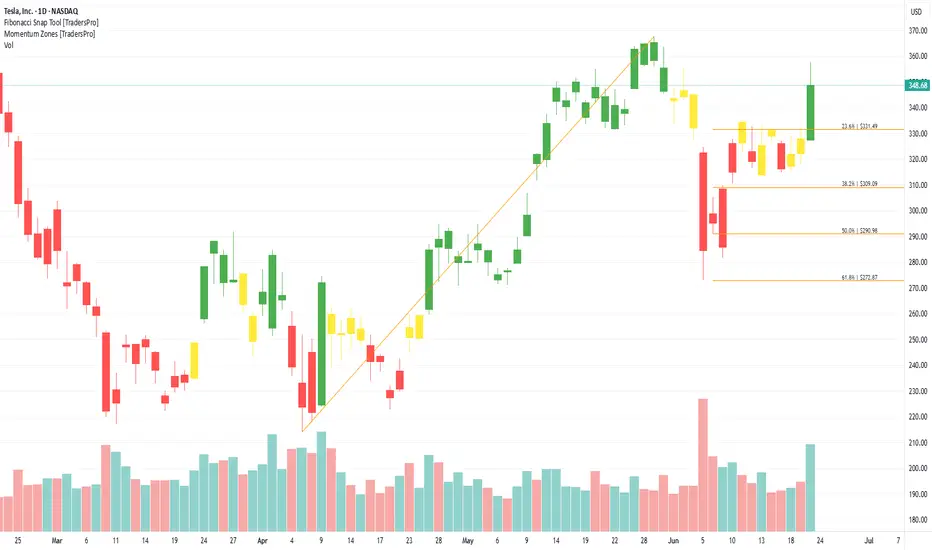
Tesla, Inc. (TSLA) Boosted by Energy StorageTesla, Inc. (TSLA) is a global leader in electric vehicles, clean energy solutions, and battery technology. The company designs and manufactures EVs, solar products, and energy storage systems that help drive the transition to sustainable energy. Tesla’s growth is fueled by rising EV adoption, battery innovations, and expansion into new markets with its cutting-edge technologies.
On the chart, a confirmation bar with increasing volume signals strong buying interest. The price has moved into the momentum zone by breaking above the .236 Fibonacci level. A trailing stop can be set just below this level using the Fibonacci snap tool to protect gains as momentum continues.
Launch of Robotaxi Service Boosts Tesla Share Price by Over 8%Launch of Robotaxi Service Boosts Tesla (TSLA) Share Price by Over 8%
As previously announced by Elon Musk, Tesla has launched its robotaxi service in Austin, Texas. The cost of a ride is $4.20.
The service is not yet fully operational. It is more of an extended testing phase, as access is currently by invitation only, and a Tesla employee may be present in the back seat.
Nevertheless, the market responded positively — Tesla (TSLA) shares rose by more than 8% (comparing the closing prices of daily candlesticks).
Technical Analysis of TSLA Share Price Chart
In our 11 June publication, we:
→ identified an ascending channel;
→ highlighted the May support level (marked with an arrow), suggesting it could act as resistance following a bearish breakout.
Since then:
→ the channel has remained relevant;
→ the aforementioned level acted as resistance but was broken by the bulls yesterday.
As a result, the TSLA share price has reached the median of the current ascending channel, where it may find equilibrium and form a consolidation zone once the initial positive reaction to the robotaxi launch subsides.
It is also worth noting the stock’s resilience following Elon Musk’s controversy with President Trump — the price has already risen more than 28% from the June low, indicating the potential for a scenario in which resistance at $365 is tested.
This article represents the opinion of the Companies operating under the FXOpen brand only. It is not to be construed as an offer, solicitation, or recommendation with respect to products and services provided by the Companies operating under the FXOpen brand, nor is it to be considered financial advice.
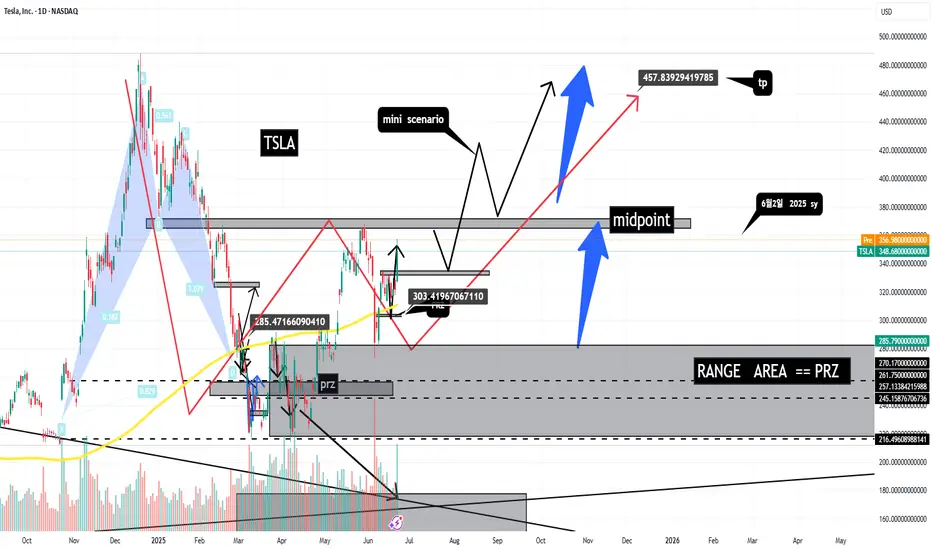
TSLA long scenario
TSLA long scenario
1.. important Registance ( $370 )
if break midpoint ( $370 ) next TP $457
2. i expect some correction near $ 330
it will be one more buy chance
-----------------------------------------
based on price action
harmonic theory
Bearish Elliot Triangle Wave $250 targetObserving Tesla Chart, I noticed a bearish 4hr Elliot Wave A-E. The flow is also bearish and lines up with the bear sentiment. Looking for a bearish Apex Breakout..
TSLA Breaking Out! Is This Just the Beginning or a Trap? Jun 24 🔥Price Action Overview:
TSLA had a powerful move, jumping +8.23% to $348.68. It cleared key resistance and now consolidates near $349–350. Volume surged, but we’re seeing a bull flag structure with some internal weakness forming.
🧠 Smart Money Market Structure (15-min Chart)
* CHoCH occurred before the breakout, showing smart money accumulation.
* Break of Structure (BOS) confirms bullish intent.
* Price is now ranging in a supply zone, rejecting upper levels with signs of compression.
* Consolidation wedge suggests a possible breakout or fakeout setup.
🔮 Gamma Exposure (GEX) Breakdown (1h Chart)
* Current Price: $348.68
* Gamma Resistance (Call Wall):
* $357.53 → 1st resistance
* $365.00 → heavy resistance
* $367.5 → Extreme Call Wall / GEXY8
* Gamma Support:
* $340 → strong support
* $320 → HVL (High Volume Level) and PUT defense
* $315 / 312.5 → 2nd PUT Wall (if breakdown)
Interpretation:
Price is trapped between GEX compression levels. A breakout above $350 could trigger a gamma squeeze toward $357–360+. A breakdown below $340 targets $320 fast.
📈 Indicators Snapshot
* Volume: High on the breakout, but tapering off during consolidation.
* RSI/MACD (not shown): Likely cooling off — favoring a pullback or re-accumulation.
* CHoCH & OB Zones: Indicate smart money watching $340-$345 for support retest.
⚖️ Scalping vs Swing Outlook
✅ Bullish Case
* Break above $350 → Watch $357.50 and $365 targets.
* Above $367 = gamma squeeze zone unlocked.
Entry: Break and hold $350
Target: $357.50, then $365
Stop: Below $345
⚠️ Bearish Case
* Break below $340 → Flush to $320 and possibly $315
* GEX puts will dominate under $320
Entry: Break and hold below $340
Target: $320, $315
Stop: Above $345
🧭 Trade Strategy Summary
* ⚔️ Inflection Zone: $340–$350 = Decision zone
* 🚀 Watch for gamma squeeze if $350+ holds
* 🛑 Breakdown below $340 flips bias bearish
* 🔄 Volume confirmation is key
Disclaimer: This analysis is for educational purposes only and does not constitute financial advice. Always do your own research and manage risk carefully.

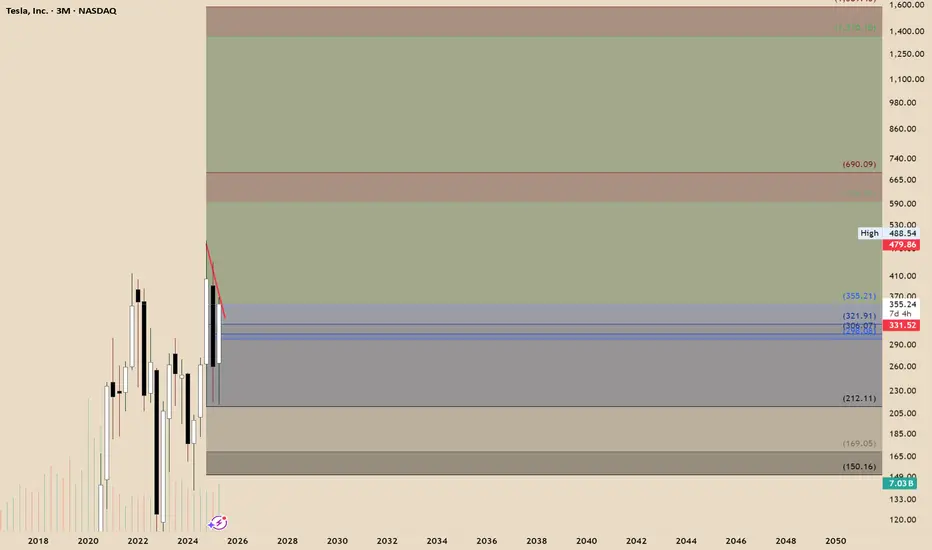
A Bullish Long-Term Outlook Tesla continues to present a compelling case for long-term investors, underpinned by its innovation-led growth trajectory and emerging dominance in autonomous mobility. Technically, recent market structure reveals an imbalance within a quarterly bullish breaker, suggesting further price expansion. If macroeconomic conditions remain favorable, the next algorithmic target zones fall between $594 and $690, signaling potential upside.
On the fundamental front, Tesla’s recent moves—particularly its rollout of the robotaxi network—have ignited fresh investor optimism. Analysts now estimate that autonomous driving could account for a substantial portion of Tesla’s future valuation, with some long-range forecasts placing the stock above $2,000 within the next several years.
While short-term pressures such as softening EV demand and regulatory barriers persist, Tesla’s consistent execution on AI-driven mobility may unlock new valuation territory.
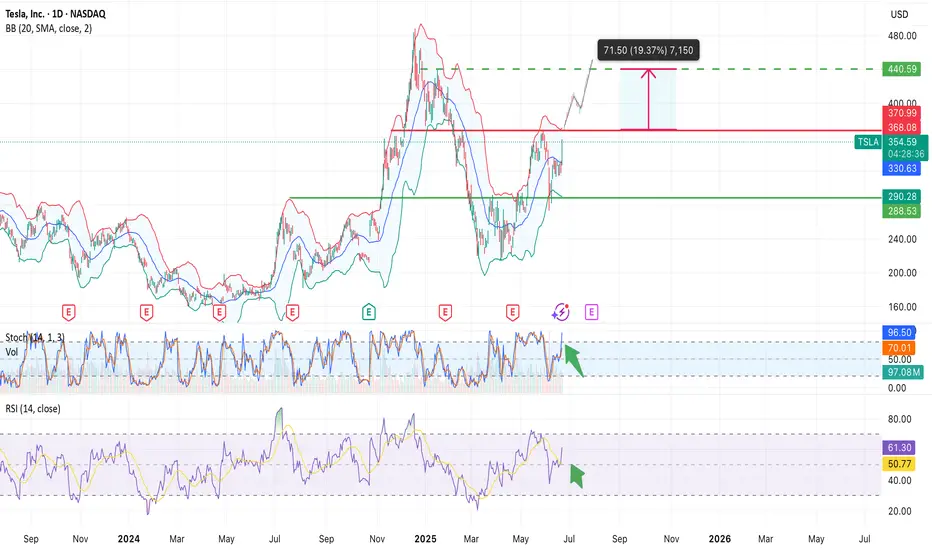
Tesla: Robotaxi Hype and Breakout WatchNASDAQ:TSLA surged nearly +10% today, driven by growing anticipation around the upcoming robotaxi unveiling on August 8.
Investors are positioning early, speculating this innovation could open new revenue streams for Tesla and redefine mobility.
📊 Technical Setup:
• Price broke out of local resistance near $330
• Approaching major resistance at $370–371 (Bollinger Band + prior support)
• If $370 is broken and held, the stock could enter a new trading range: $370–$440
• RSI and Stochastic are heating up, but no signs of reversal yet
⚙️ Robotaxi Catalyst:
• Elon Musk confirmed the Robotaxi event set for August 8
• Analysts speculate this could boost valuation through AI and self-driving revenue potential
• Option volume and retail interest are rising fast
📌 Levels to watch:
• Breakout level: $370
• Target: $440
• Support zone: $330
• Invalidation: Close below $310
👀 Watch for pre-event momentum. A break above $370 could trigger a squeeze.