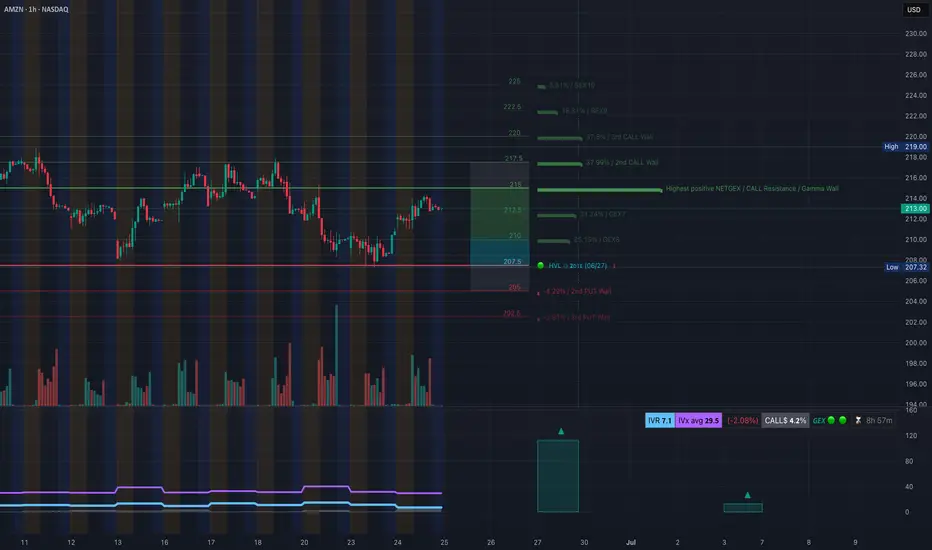
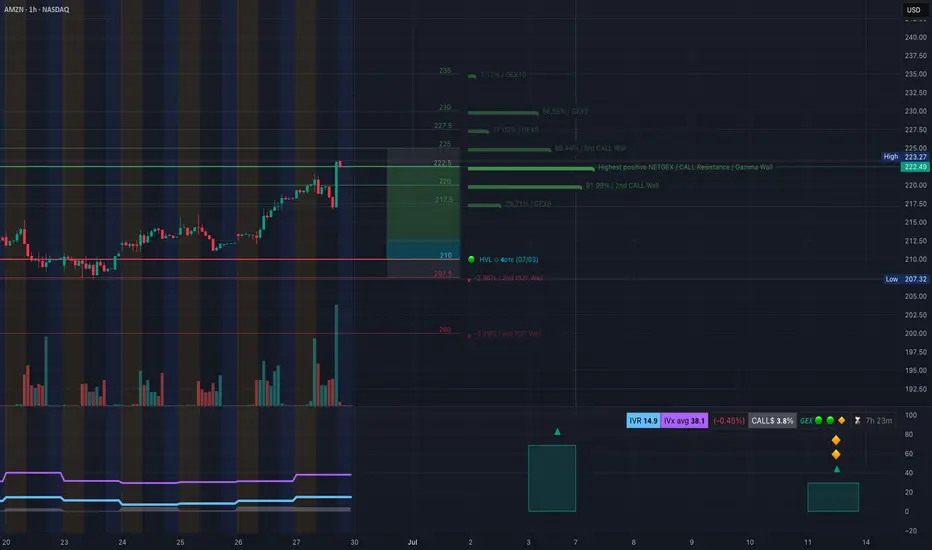
AMZN Heating Up – GEX Shows There's Room to Run!
Alright, guys – here's the scoop on Amazon (AMZN) right now based on the latest GEX map and price action.
🧠 GEX Setup:
We’re seeing solid call gamma buildup from 213 → 220, and a strong positive NET GEX wall near 215–217. That tells us market makers might start pushing price toward those high-gamma
Next report date
—
Report period
—
EPS estimate
—
Revenue estimate
—
6.2 USD
59.25 B USD
637.96 B USD
9.49 B
About Amazon.com
Sector
Industry
CEO
Andrew R. Jassy
Website
Headquarters
Seattle
Founded
1994
FIGI
BBG00JPR0JG2
Amazon.com, Inc. is a multinational technology company, which engages in the provision of online retail shopping services. It operates through the following segments: North America, International, and Amazon Web Services (AWS). The North America segment offers retail sale of consumer products, including from sellers, advertising, and subscriptions services through North America-focused online and physical stores. The International segment focuses on retail sale of consumer products, including from sellers, advertising, and subscription services through internationally-focused online stores. The AWS segment is composed of global sales of compute, storage, database, and other services for start-ups, enterprises, government agencies, and academic institutions. The company was founded by Jeffrey P. Bezos in July 1994 and is headquartered in Seattle, WA.
Related stocks
AMZN: Daily Trend Change with Bullish Continuation Setup
🗓 Published: June 26, 2025
📍 Ticker: NASDAQ:AMZN – Amazon.com Inc.
🕒 Timeframes: Daily & 4H
📊 Technical Bias: Bullish
📈 Trend: Higher Highs & Higher Lows
🧠 Analysis Summary
Amazon has successfully reclaimed a bullish market structure on the daily chart by forming higher highs and higher lows sin
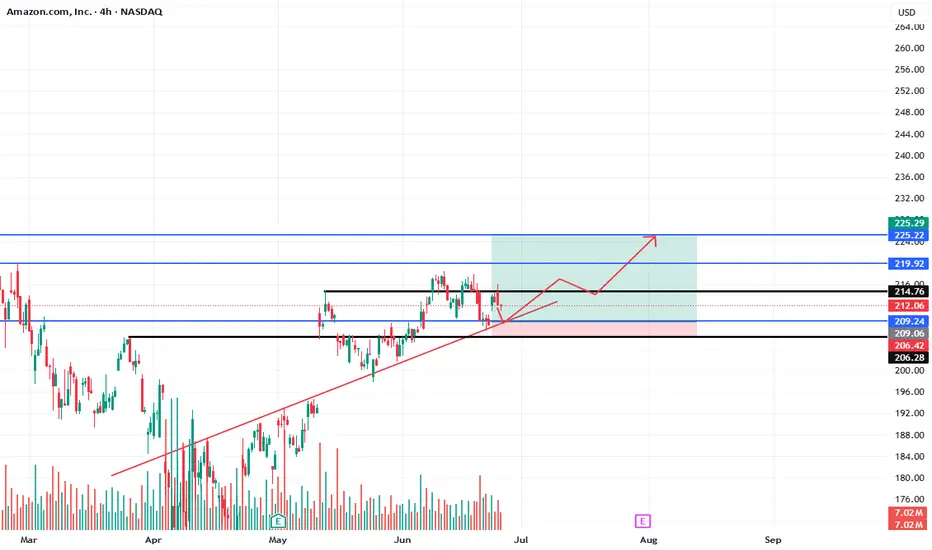
AMAZONAMZN needs some more upside before a pullback.
Disclosure: We are part of Trade Nation's Influencer program and receive a monthly fee for using their TradingView charts in our analysis.
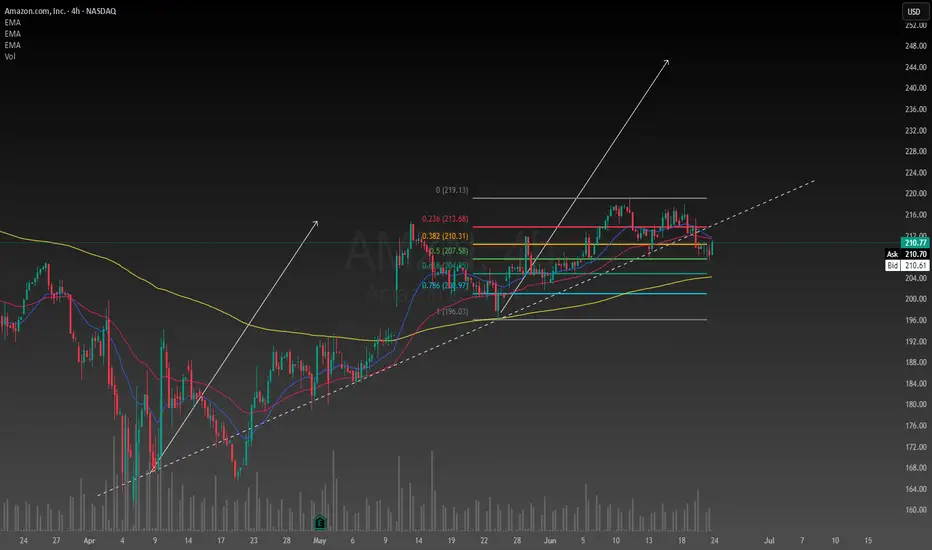
Amazon swing trade ideaAmazon has fallen below its trendline and started to dip slightly despite the fact that the broad market is going higher. I have found an opportunity for a decent long entry and have ran the numbers, the intrinsic value of Amazon right now is between $180 and $520. Not only is it a retail giant but
AMZN Monday Setup: Will $225 Hold or Fold? Key Levels for Trader🚨GEX-Based Options Sentiment (as of Sunday Close):
* $225 – Key Call Wall & Highest Positive GEX level: Strong resistance. AMZN closed right below this — very telling.
* $220 – GEX8 / 2nd Call Wall: Gamma magnet zone. Price may gravitate here early in the session.
* $210 – Strong Put Wall + HVL zone
Amazon “All-In” on UK InvestmentIon Jauregui – Analyst at ActivTrades
Amazon announced on Tuesday an ambitious £40 billion investment in the United Kingdom over the next three years. The goal: to boost technological innovation, expand its logistics network, and strengthen the infrastructure needed for artificial intelligence deve
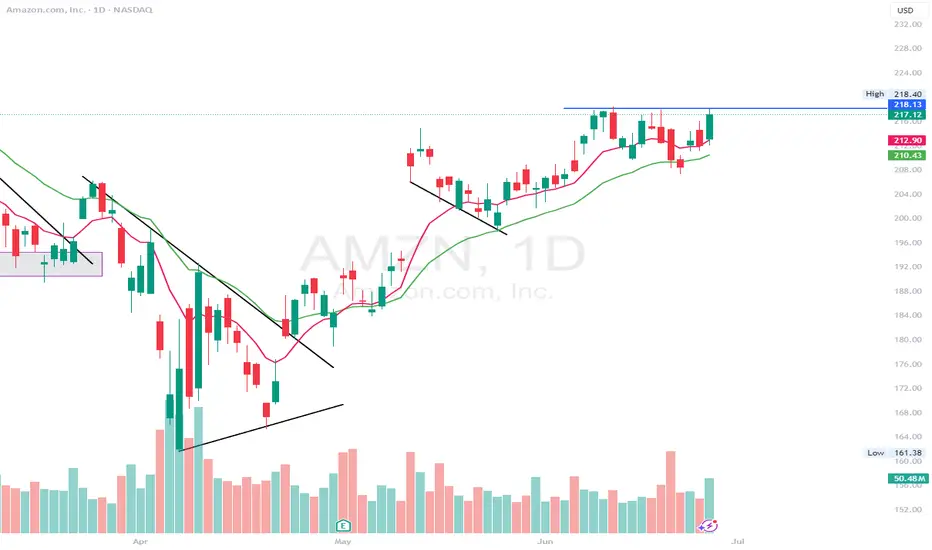
$AMZN - $2128.20 break for move higher. Multiple catalystAMZN - Stock rejecting daily highs at $218.20 and rejecting it trice. Long and swing calls added in the group. July has been a good month for the stock. Prime day coming in the next 2 weeks. looking for more calls above $220 for a move towards $240 and higher
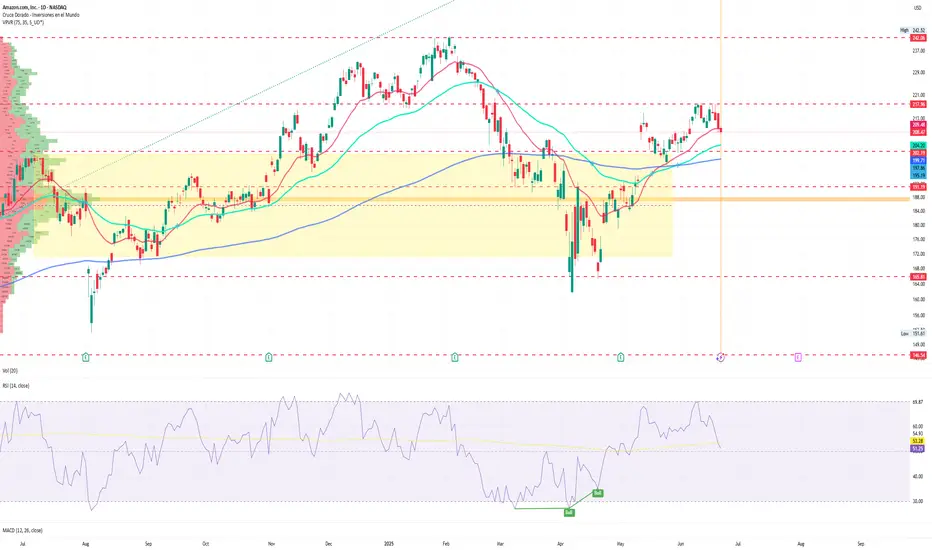
Amazon getting ready for another leg downAmazon is now in consolidation mode right below the 200MA which also happens to line up with a previous area of resistance. As long as it continues to consolidate below the 200MA, look for another leg down. If it breaks above the 200MA and closes an entire candle above then that would cancel the bea

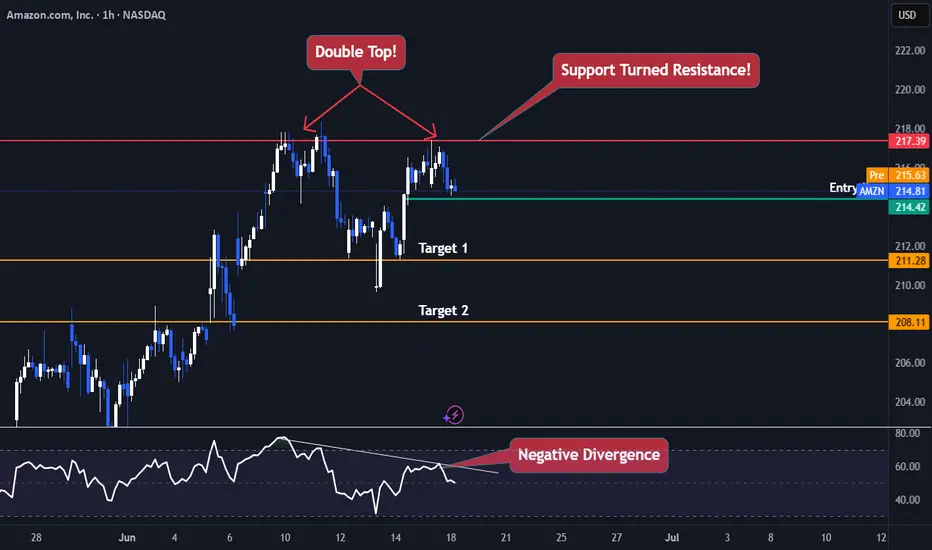
AMAZON TROUBLENASDAQ:AMZN Is currently trading Just 11% below its all time high and currently Facing exhaustion.
Amazon is currently trading 217$ range which was previous support now turned resistance (Daily Timeframe) , making a double top pattern and a negative divergence on the RSI.
The best Trades are th
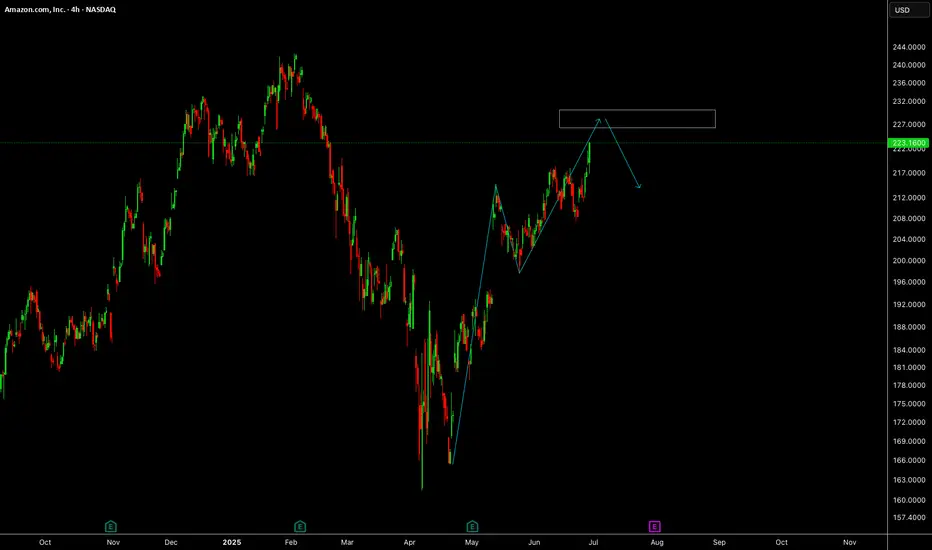
Amazon: Continuing to RiseWith Amazon’s recent climb, prices are edging closer to the top of wave (1) in magenta. However, there is still a bit of upside potential in the short term before wave (2) makes its corrective move. Our primary scenario does not anticipate a new low below $160.50. Instead, we expect wave (3) in mage

See all ideas
Summarizing what the indicators are suggesting.
Neutral
SellBuy
Strong sellStrong buy
Strong sellSellNeutralBuyStrong buy
Neutral
SellBuy
Strong sellStrong buy
Strong sellSellNeutralBuyStrong buy
Neutral
SellBuy
Strong sellStrong buy
Strong sellSellNeutralBuyStrong buy
An aggregate view of professional's ratings.
Neutral
SellBuy
Strong sellStrong buy
Strong sellSellNeutralBuyStrong buy
Neutral
SellBuy
Strong sellStrong buy
Strong sellSellNeutralBuyStrong buy
Neutral
SellBuy
Strong sellStrong buy
Strong sellSellNeutralBuyStrong buy
Displays a symbol's price movements over previous years to identify recurring trends.
Curated watchlists where 0R1O is featured.


Frequently Asked Questions
The current price of 0R1O is 220.0 USD — it has increased by 0.30% in the past 24 hours. Watch AMAZON COM INC COM USD0.01 stock price performance more closely on the chart.
Depending on the exchange, the stock ticker may vary. For instance, on LSE exchange AMAZON COM INC COM USD0.01 stocks are traded under the ticker 0R1O.
0R1O stock has risen by 5.22% compared to the previous week, the month change is a −87.36% fall, over the last year AMAZON COM INC COM USD0.01 has showed a −87.36% decrease.
We've gathered analysts' opinions on AMAZON COM INC COM USD0.01 future price: according to them, 0R1O price has a max estimate of 290.00 USD and a min estimate of 195.00 USD. Watch 0R1O chart and read a more detailed AMAZON COM INC COM USD0.01 stock forecast: see what analysts think of AMAZON COM INC COM USD0.01 and suggest that you do with its stocks.
0R1O reached its all-time high on Sep 4, 2018 with the price of 2,050.2 USD, and its all-time low was 200.0 USD and was reached on Jun 5, 2025. View more price dynamics on 0R1O chart.
See other stocks reaching their highest and lowest prices.
See other stocks reaching their highest and lowest prices.
0R1O stock is 2.76% volatile and has beta coefficient of 1.37. Track AMAZON COM INC COM USD0.01 stock price on the chart and check out the list of the most volatile stocks — is AMAZON COM INC COM USD0.01 there?
Today AMAZON COM INC COM USD0.01 has the market capitalization of 2.37 T, it has increased by 0.20% over the last week.
Yes, you can track AMAZON COM INC COM USD0.01 financials in yearly and quarterly reports right on TradingView.
AMAZON COM INC COM USD0.01 is going to release the next earnings report on Jul 31, 2025. Keep track of upcoming events with our Earnings Calendar.
0R1O earnings for the last quarter are 1.59 USD per share, whereas the estimation was 1.37 USD resulting in a 16.38% surprise. The estimated earnings for the next quarter are 1.32 USD per share. See more details about AMAZON COM INC COM USD0.01 earnings.
AMAZON COM INC COM USD0.01 revenue for the last quarter amounts to 155.67 B USD, despite the estimated figure of 155.15 B USD. In the next quarter, revenue is expected to reach 161.90 B USD.
0R1O net income for the last quarter is 17.13 B USD, while the quarter before that showed 20.00 B USD of net income which accounts for −14.38% change. Track more AMAZON COM INC COM USD0.01 financial stats to get the full picture.
No, 0R1O doesn't pay any dividends to its shareholders. But don't worry, we've prepared a list of high-dividend stocks for you.
As of Jul 1, 2025, the company has 1.56 M employees. See our rating of the largest employees — is AMAZON COM INC COM USD0.01 on this list?
EBITDA measures a company's operating performance, its growth signifies an improvement in the efficiency of a company. AMAZON COM INC COM USD0.01 EBITDA is 127.91 B USD, and current EBITDA margin is 19.15%. See more stats in AMAZON COM INC COM USD0.01 financial statements.
Like other stocks, 0R1O shares are traded on stock exchanges, e.g. Nasdaq, Nyse, Euronext, and the easiest way to buy them is through an online stock broker. To do this, you need to open an account and follow a broker's procedures, then start trading. You can trade AMAZON COM INC COM USD0.01 stock right from TradingView charts — choose your broker and connect to your account.
Investing in stocks requires a comprehensive research: you should carefully study all the available data, e.g. company's financials, related news, and its technical analysis. So AMAZON COM INC COM USD0.01 technincal analysis shows the sell today, and its 1 week rating is sell. Since market conditions are prone to changes, it's worth looking a bit further into the future — according to the 1 month rating AMAZON COM INC COM USD0.01 stock shows the strong sell signal. See more of AMAZON COM INC COM USD0.01 technicals for a more comprehensive analysis.
If you're still not sure, try looking for inspiration in our curated watchlists.
If you're still not sure, try looking for inspiration in our curated watchlists.