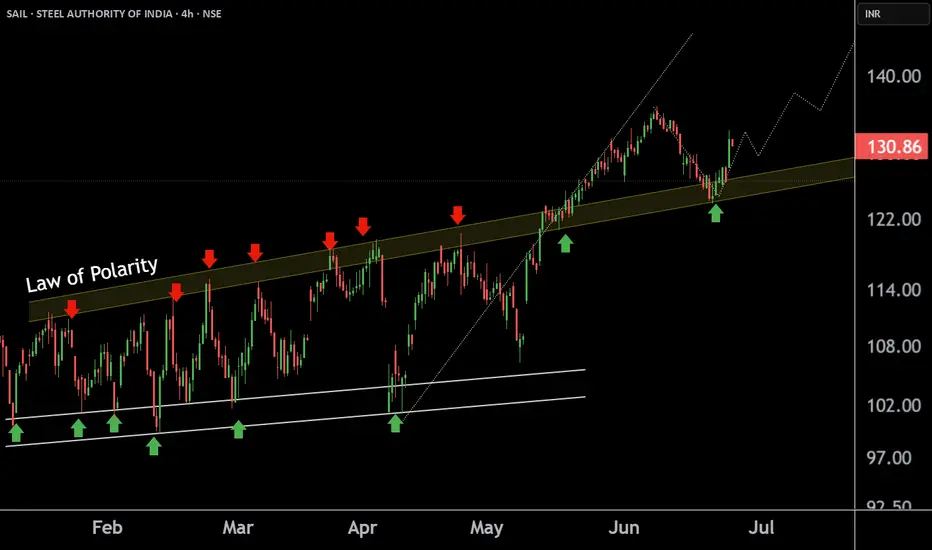
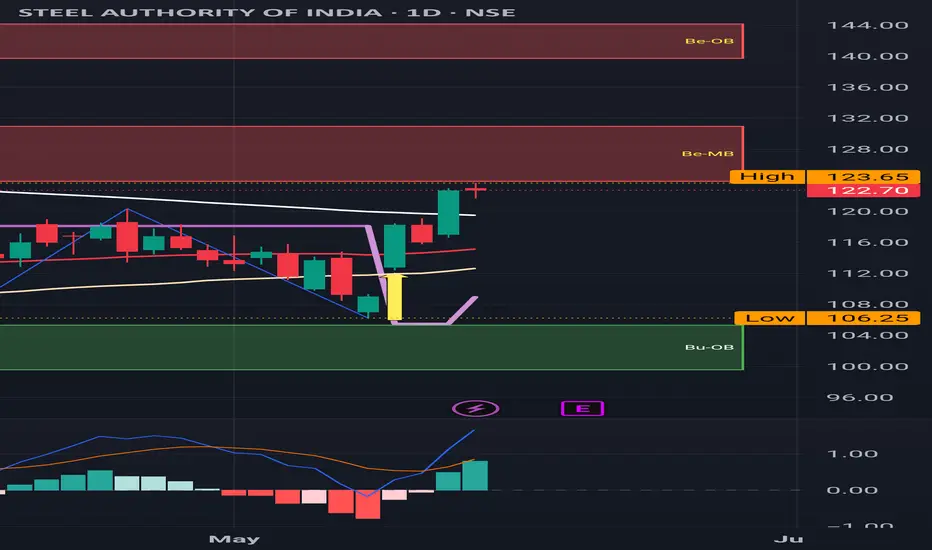
SAIL at Best Support !!This is the 4 hour Chart of STEEL AUTHORITY OF INDIA .
SAIL having a good law of polarity at 125 range .
SAIL has formed a broadening pattern indicating the uptrend.
if this level is sustain then we may see higher prices in SAIL.
Thank You !!
0.20 USD
280.53 M USD
12.12 B USD
About STEEL AUTHORITY OF INDIA
Sector
Industry
Website
Headquarters
New Delhi
Founded
1954
FIGI
BBG000GB2442
Steel Authority of India Ltd. engages in the manufacture and sale of steel and steel products. It offers flat products such as hot rolled coils, hot rolled plates, cold rolled coils, pipes, and electrical sheets, and long products such as thermo mechanical bars and wire rods. The firm operates through the following segments: BSP, DSP, RSP, BSL, ISP, ASP, SSP, VISL, and Others. The company was founded on January 19, 1954 and is headquartered in New Delhi, India.
Related stocks
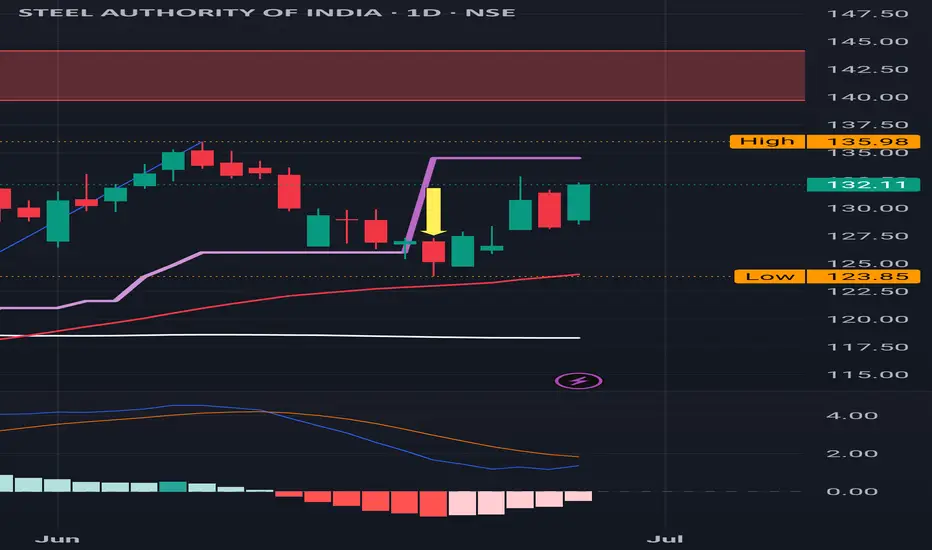
Sail : Approaching Near Resistance Sail : Approaching near Resistance
136 is the first resistance level to be watched out for and than major Red Band Resistance as displayed on the Chart
( Not a Buy / Sell Recommendation
Do your own due diligence ,Market is subject to risks, This is my own view and for learning only .)
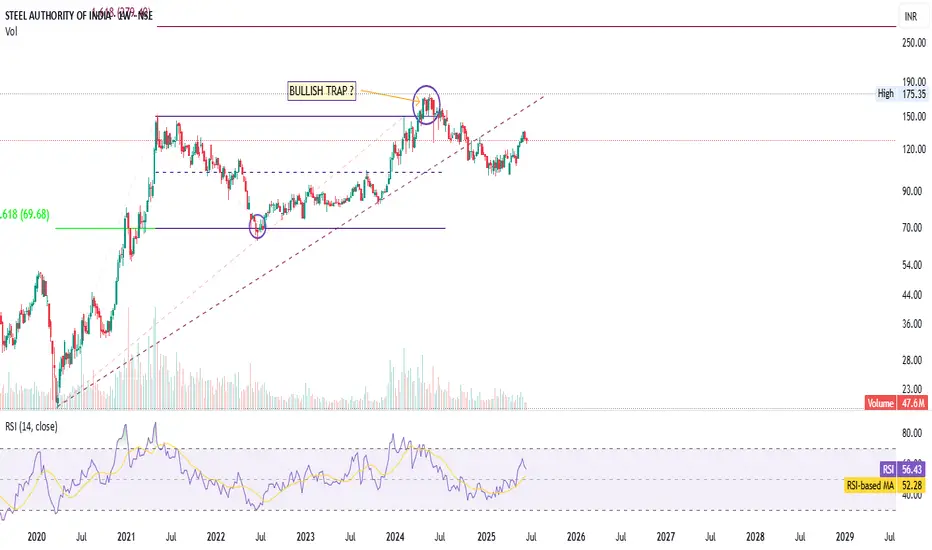
SAIL-Post-Bull Trap Recovery, New base forming!High at ₹175.35 marked — confirmed historical resistance.
Fibonacci 0.618 retracement level at ₹69.68 — acted as a key support in the past.
Important demand zone retest (marked in purple) was successful and led to the current uptrend.
2. Bullish Trap Highlighted:
The marked "Bullish Trap?" zone s
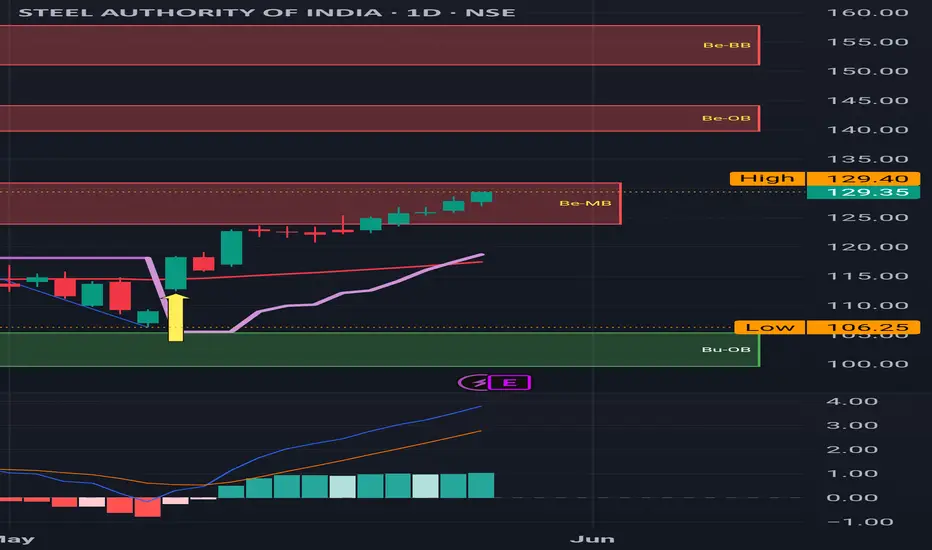
Sail BullishAfter a long consolidation at the bottom Sail has formed a Bullish engulfing candle at the bottom and giving a breakout of the resistance level.
Entry- 111-112
Support- 107.5-107
Target- 120, 125
Disclaimer- This is just for educational purpose please take advice from your financial advisor before
Sail : Fantastic rally after a Buy Signal ,sitting at a first reSail : Fantastic rally after a Buy Signal , sitting at a first resistsnce as seen on the Chart.
( Not a Buy / Sell Recommendation
Do your own due diligence ,Market is subject to risks, This is my own view and for learning only .)
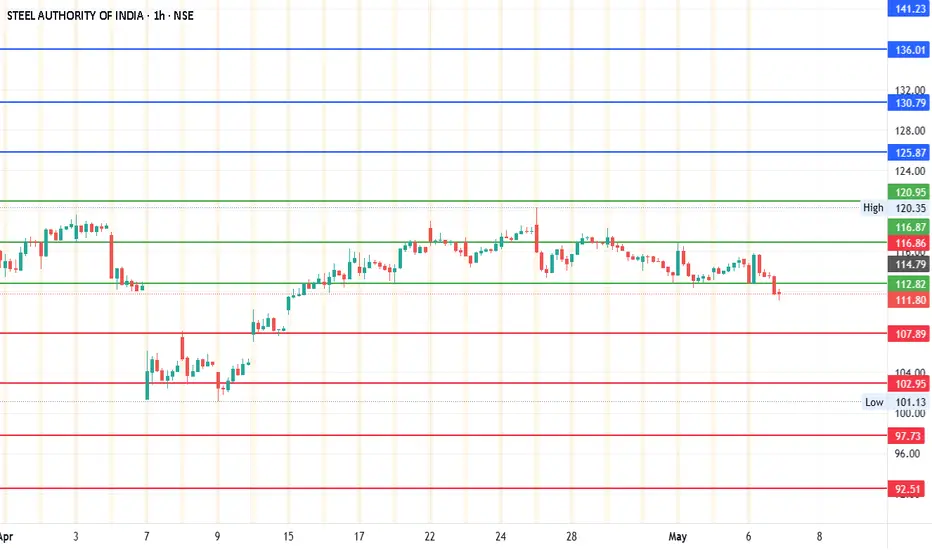
SailCurrent Price: 111.57
Upside: 125.87, 130.79, 136.01 and 141.23
Downside: 107.89, 102.95, 97.73 and 92.51
#Sail
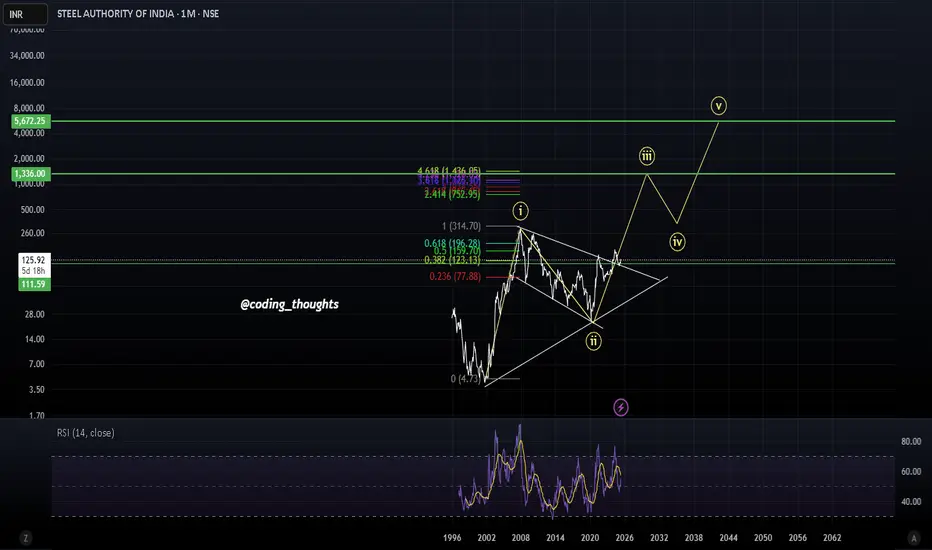
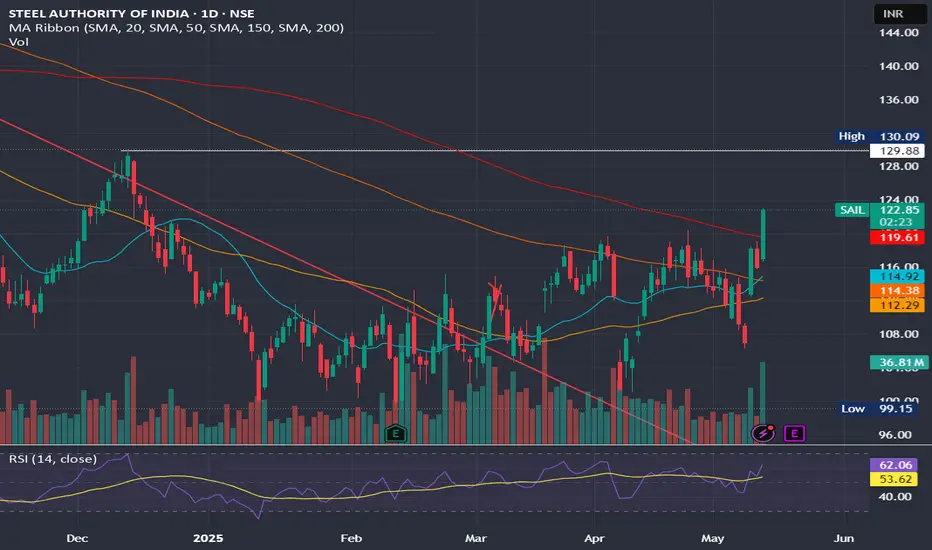
SAILSAIL looks bullish, breaking out from a multi-year range. In Elliott Wave 3, it could see strong upside, supported at recent lows, with resistance at prior highs. Expect robust momentum.
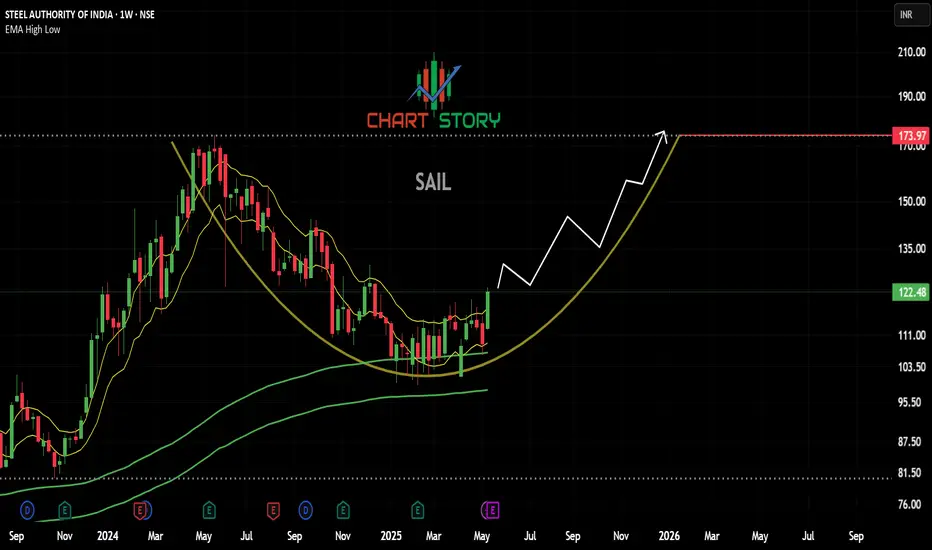
SAIL - LONGNSE:SAIL Weekly rounding bottom formation possible with buyers active near buying location. Macd also shows some momentum intact on chart.
SAIL : After a fantastic Buy Signal ,sitting at a Red band SAIL : After a fantastic Buy Signal ,sitting at a Red band resistance as displayed in the Chart
Closed above 200 SMA with a nice green Candle .
( Not a Buy / Sell Recommendation
Do your own due diligence ,Market is subject to risks, This is my own view and for learning only .)
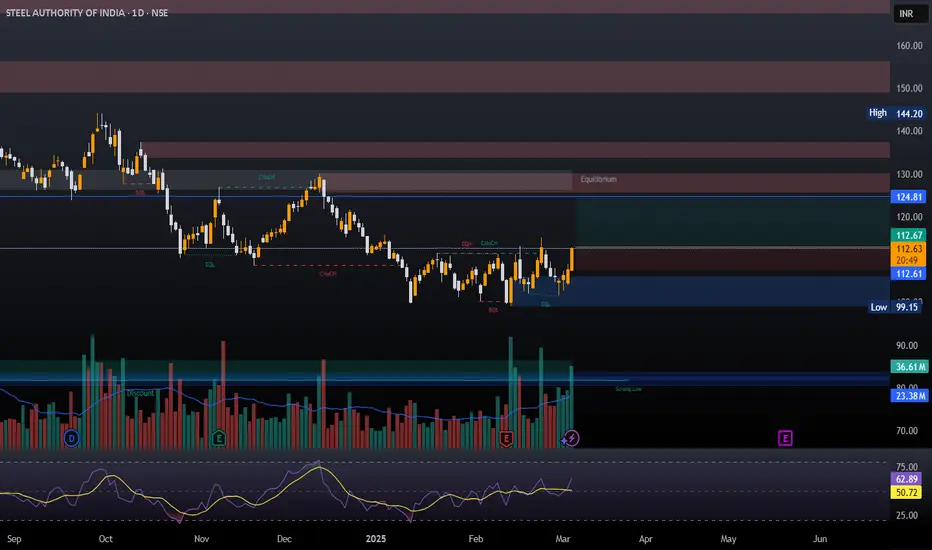
Sail is sailing higher Here's a quick analysis of SAIL (Steel Authority of India Ltd.) stock:
Technical Overview
- Current Price: ₹122.61 INR
- Market Cap: ₹479.14 billion
- P/E Ratio: 22.56 (Moderate valuation)
- Dividend Yield: 1.72% (Stable returns)
- 52-Week Range: ₹99.15 - ₹175.35
Recent Trends
- The stock has been i
See all ideas
Summarizing what the indicators are suggesting.
Oscillators
Neutral
SellBuy
Strong sellStrong buy
Strong sellSellNeutralBuyStrong buy
Oscillators
Neutral
SellBuy
Strong sellStrong buy
Strong sellSellNeutralBuyStrong buy
Summary
Neutral
SellBuy
Strong sellStrong buy
Strong sellSellNeutralBuyStrong buy
Summary
Neutral
SellBuy
Strong sellStrong buy
Strong sellSellNeutralBuyStrong buy
Summary
Neutral
SellBuy
Strong sellStrong buy
Strong sellSellNeutralBuyStrong buy
Moving Averages
Neutral
SellBuy
Strong sellStrong buy
Strong sellSellNeutralBuyStrong buy
Moving Averages
Neutral
SellBuy
Strong sellStrong buy
Strong sellSellNeutralBuyStrong buy
Displays a symbol's price movements over previous years to identify recurring trends.
Curated watchlists where SAUD is featured.

Indian stocks: Racing ahead
46 No. of Symbols
See all sparks