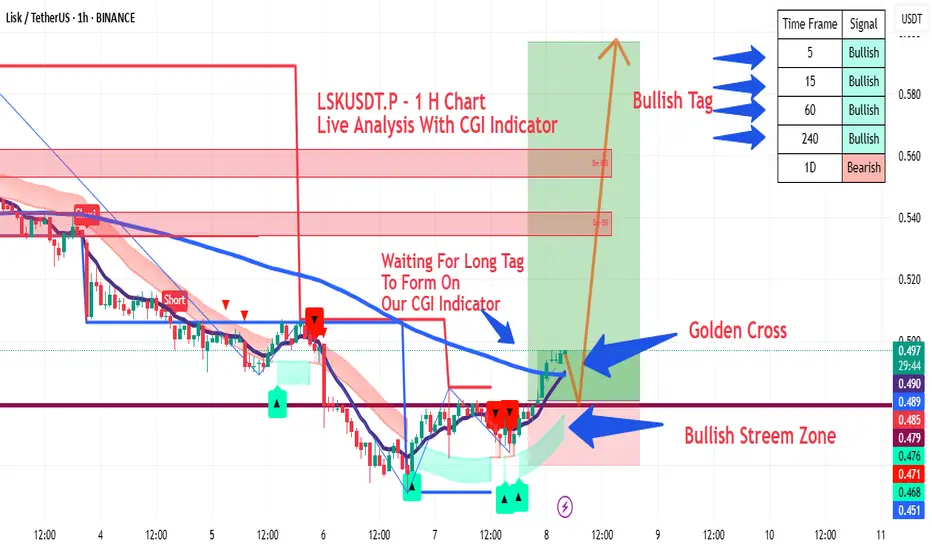
LSKUSDT.P - 1 H Chart Live Analysis With CGI IndicatorLSKUSDT.P - 1 H Chart Live Analysis With CGI Indicator
Waiting For Long Tag To Form On Our CGI Indicator
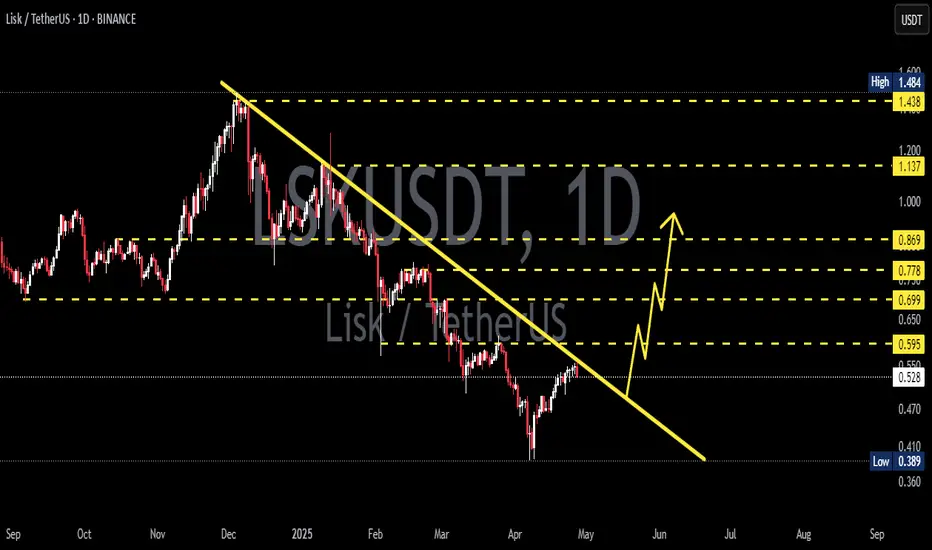
LSKUSDT 1D AnalysisLSK ~ 1D Analysis
#LSK Buy after successfully penetrating this resistant line with a short -term target of at least 10%+ from here.
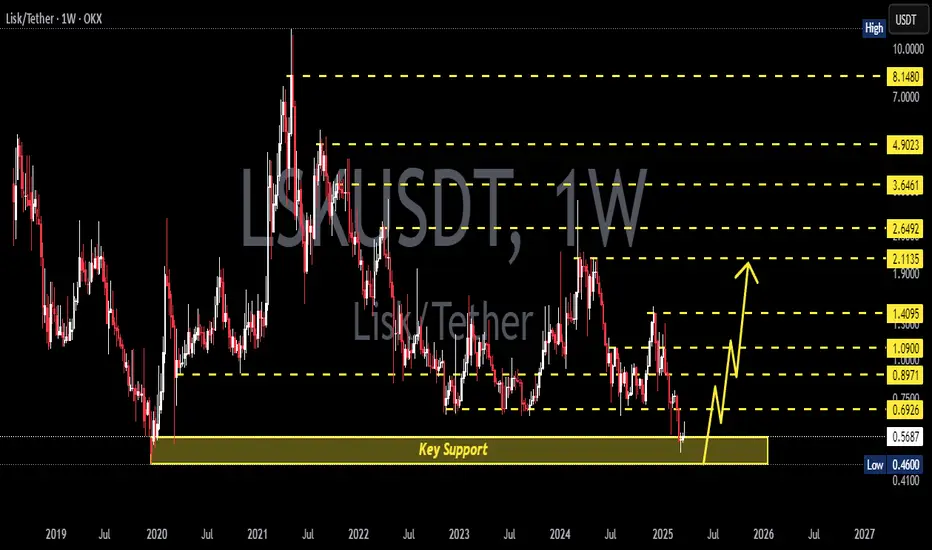
LSKUSDT 1WLSK ~ 1W Analysis
#LSK Buy gradually from here with a short -term target of at least 20%+. This is the lowest support for now.
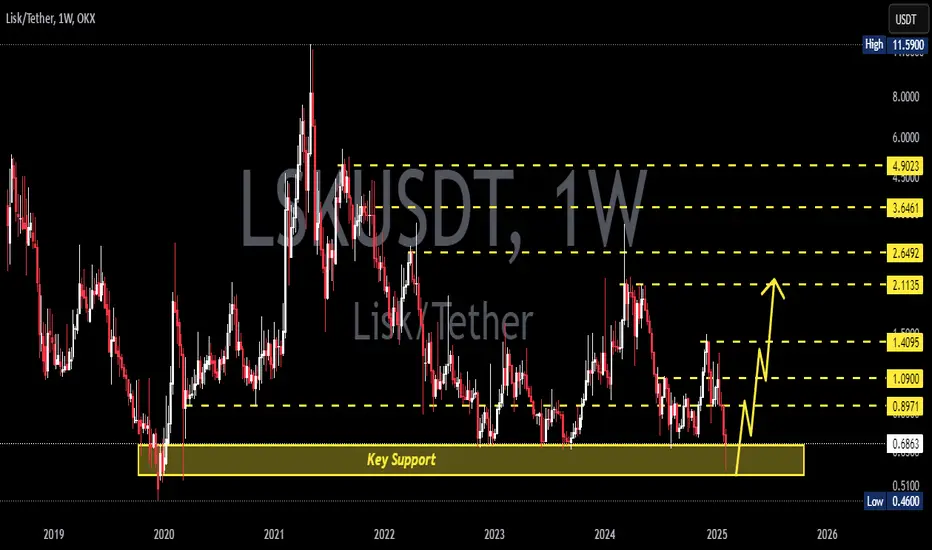
LSKUSDT 1WLSK ~ 1W Analysis
#LSK Buy gradually from here if you still have a Conviction on this Coin with a minimum target of 20%++
Long-Term Consolidation & Bullish-Run —1695% Potential (LSKUSDT)Bottom prices. Can you see it?
Easy to see. Bottom prices.
No opportunities have been missed.
When one door closes, a new door opens.
Everything has its advantage and disadvantage.
We live in a world of duality.
Night and day. This defines everything.
Up and down.
Joy and pain.
Profits and profi

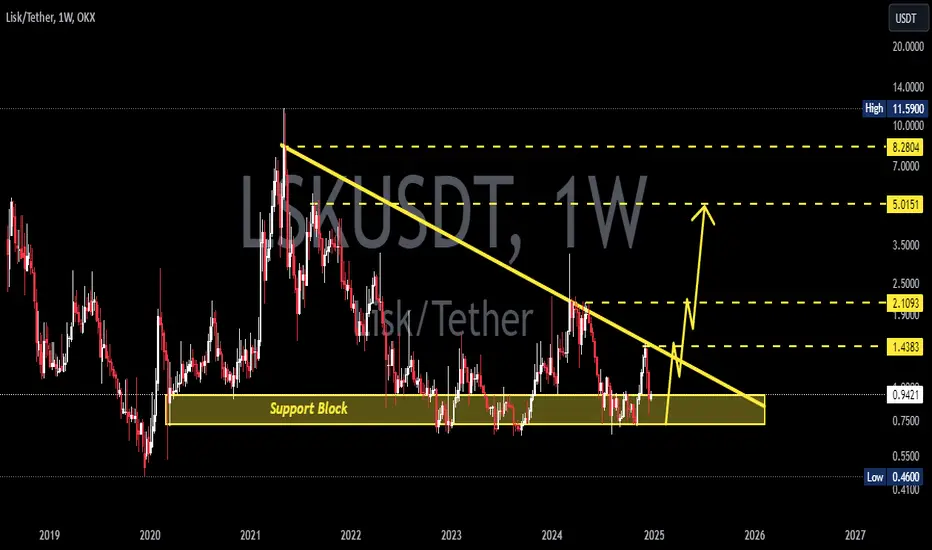
LSKUSDT 1WLSK ~ 1W
#LSK So far it continues to maintain this support block,. If you want to buy this coin back,. This support block is a good buying place for now.
LSKUSDT.1DAs I analyze the LSK/USDT daily chart, the price is currently trading at 1.090, showing a gradual recovery after a prolonged consolidation period. The chart displays a breakout from a range-bound structure, signaling growing bullish momentum. Key levels are highlighted to better understand the price

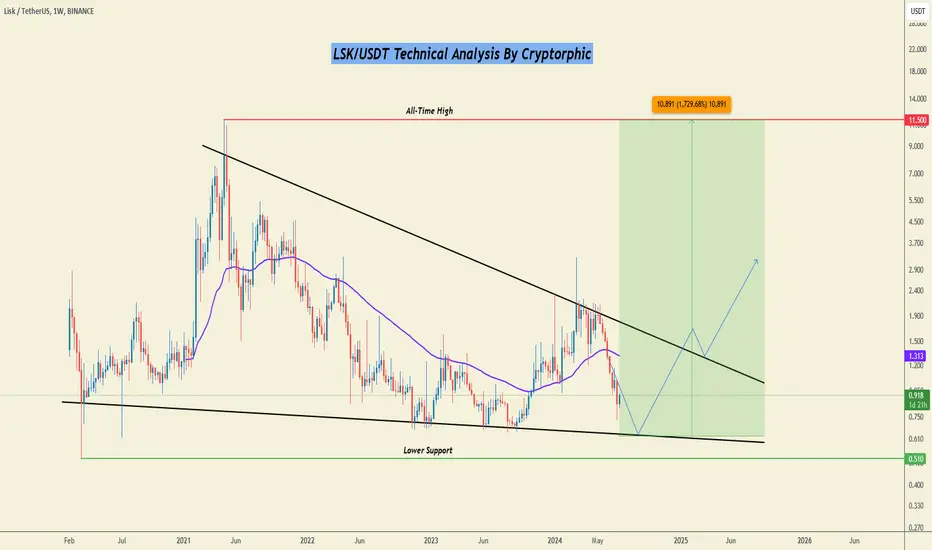
LSK Technical Analysis in Weekly TimeframeHello everyone, I’m Cryptorphic.
For the past seven years, I’ve been sharing insightful charts and analysis.
Follow me for:
~ Unbiased analyses on trending altcoins.
~ Identifying altcoins with 10x-50x potential.
~ Futures trade setups.
~ Daily updates on Bitcoin and Ethereum.
~ High time frame (H
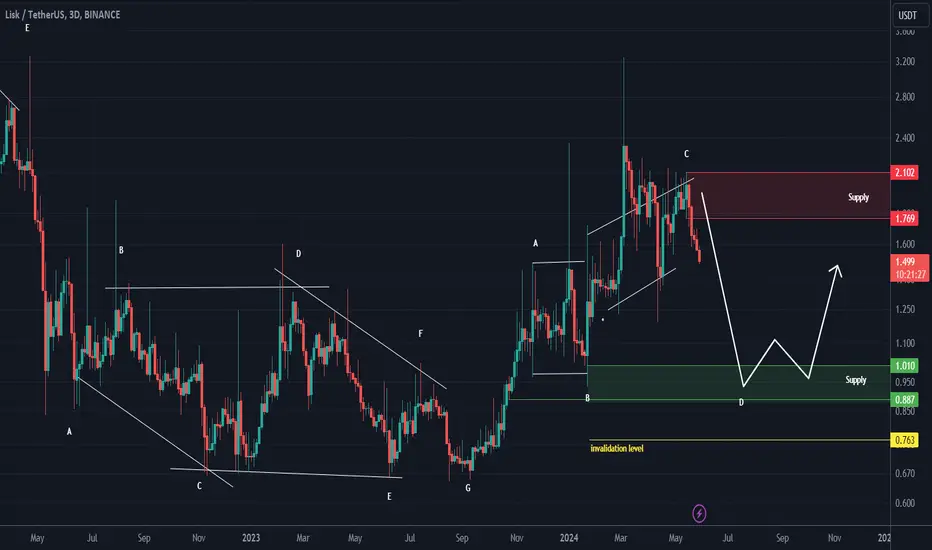
LSK looks bearishIt looks like a bullish ABC is over and now price has entered a new pattern or wave D.
The supply range and the demand range have been determined.
The target of this drop box is green.
Closing a daily candle below the invalidation level will violate the bullish movement
For risk management, plea
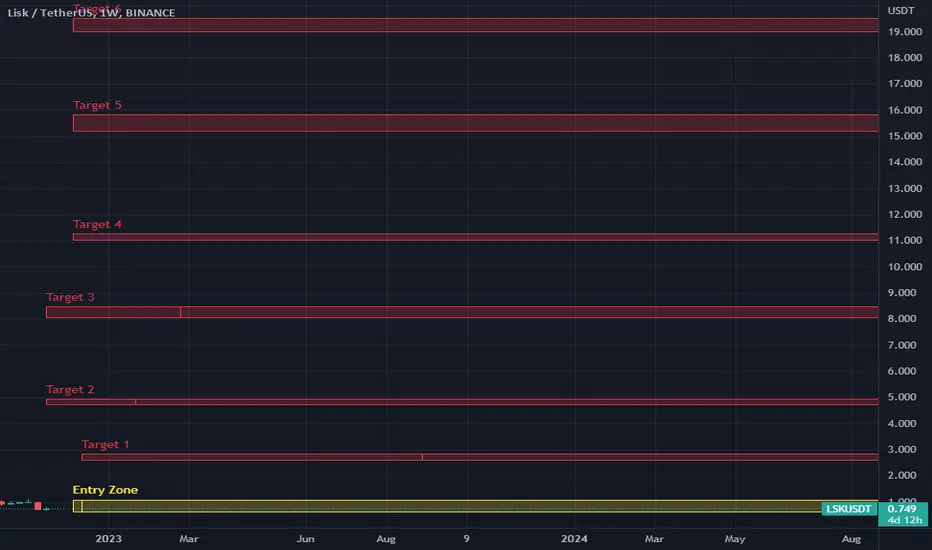
Good opportunity to buy LSK.Lisk (LSK) is in good entry zone now. This is trade (investment) setup on larger timeframe. I am not looking to reach targets 2,3,4,5 and 6 very soon, that could be year(s). I will sell most of my capital on targets 3,4 and 5. Small portion will be sold on targets 1,2 and 6.
Entry Zone: 0.60 – 1.07
See all ideas
Summarizing what the indicators are suggesting.
Oscillators
Neutral
SellBuy
Strong sellStrong buy
Strong sellSellNeutralBuyStrong buy
Oscillators
Neutral
SellBuy
Strong sellStrong buy
Strong sellSellNeutralBuyStrong buy
Summary
Neutral
SellBuy
Strong sellStrong buy
Strong sellSellNeutralBuyStrong buy
Summary
Neutral
SellBuy
Strong sellStrong buy
Strong sellSellNeutralBuyStrong buy
Summary
Neutral
SellBuy
Strong sellStrong buy
Strong sellSellNeutralBuyStrong buy
Moving Averages
Neutral
SellBuy
Strong sellStrong buy
Strong sellSellNeutralBuyStrong buy
Moving Averages
Neutral
SellBuy
Strong sellStrong buy
Strong sellSellNeutralBuyStrong buy
Displays a symbol's price movements over previous years to identify recurring trends.