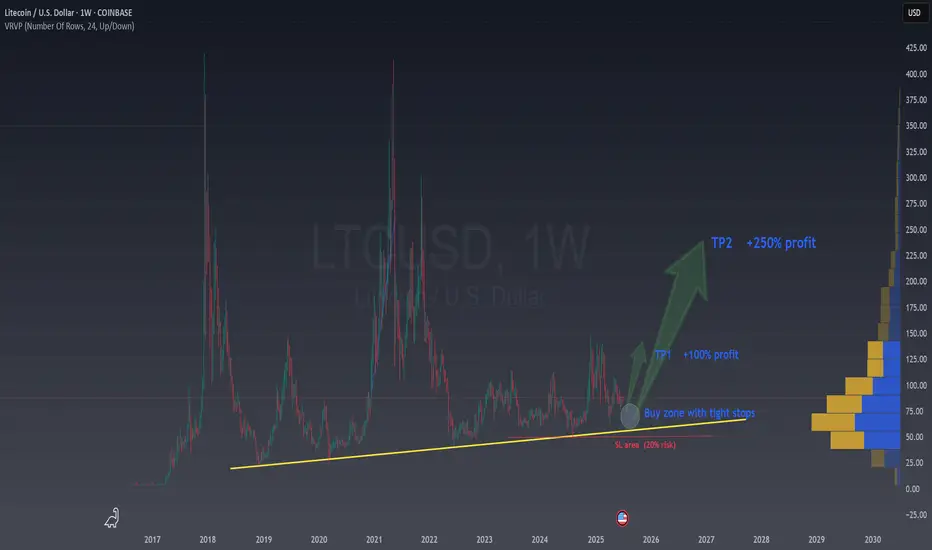
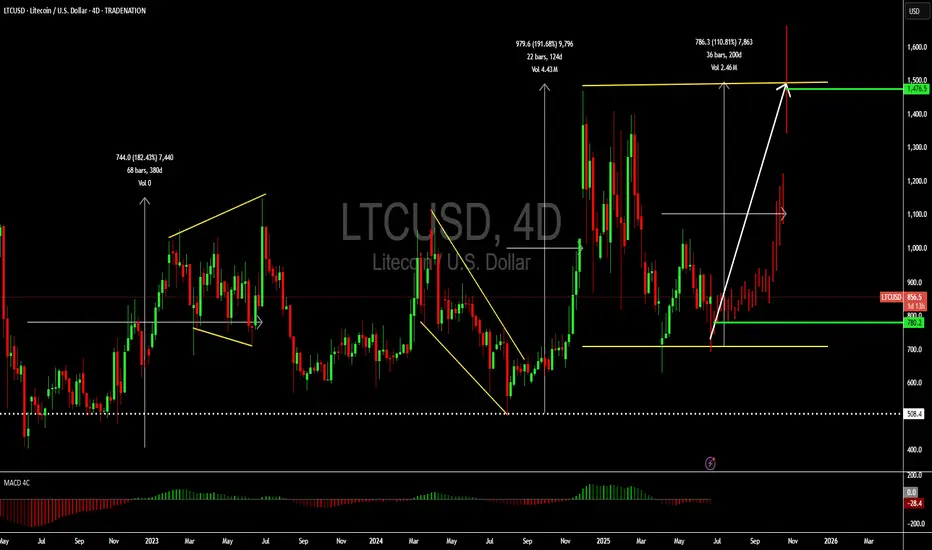
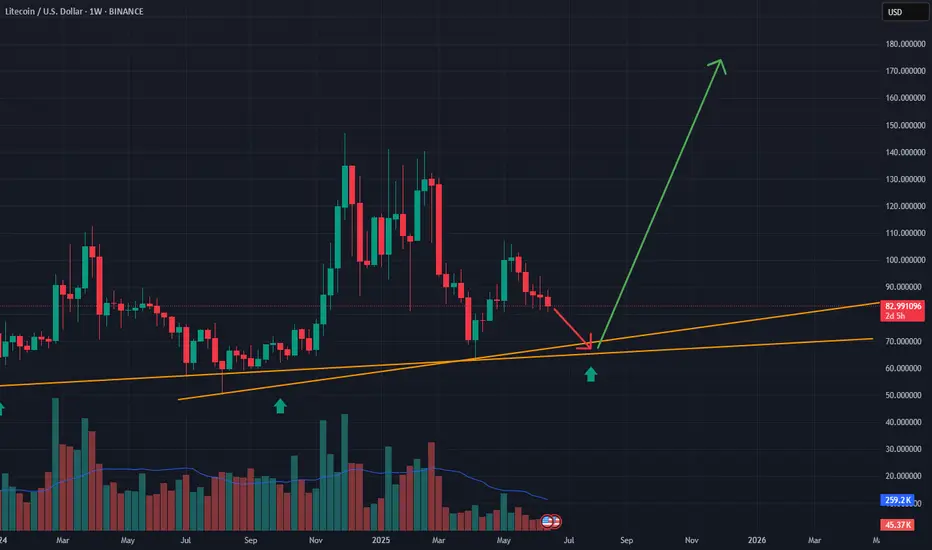
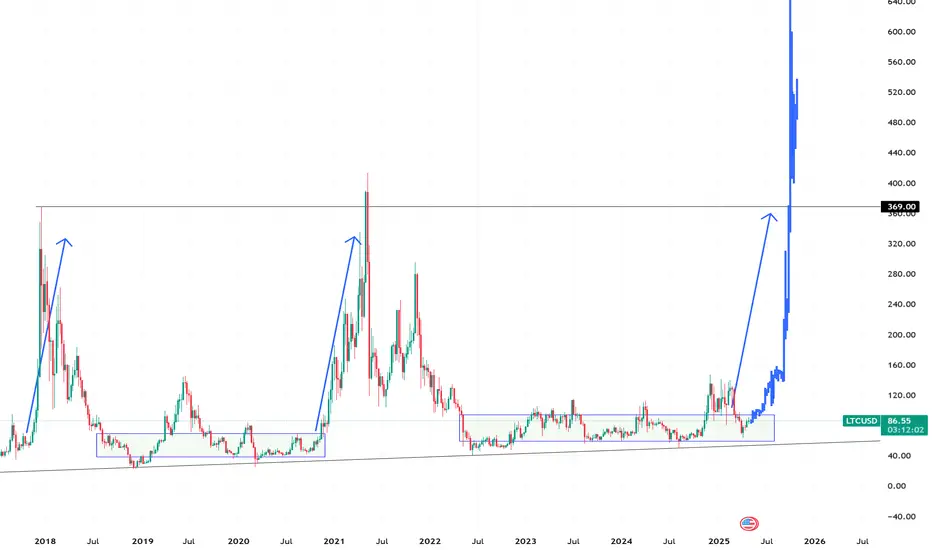
LTC is ready to jump one more timeEven though there isn’t a usual pattern like the ones I normally trade, we can see that the price is very close to LTC’s historical trend line.
Every time the price has reached this line before, it has gone up by at least 100% in a short time.
There is a risk that the line could break, but we would only risk about 20% or less. So, with a risk-to-reward ratio of at least 1 to 5, it’s worth taking the opportunity and watching for possible long entries in LTC.
LTCUSD trade ideas
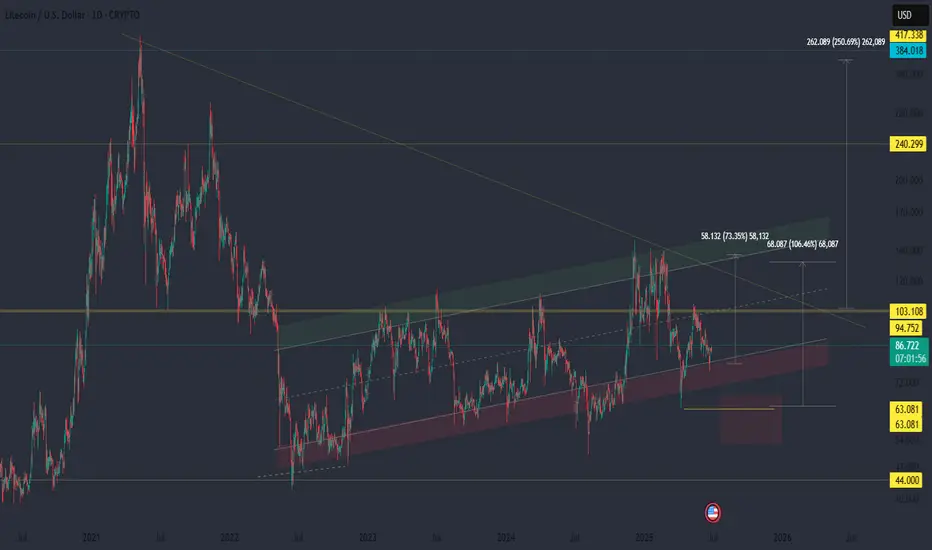
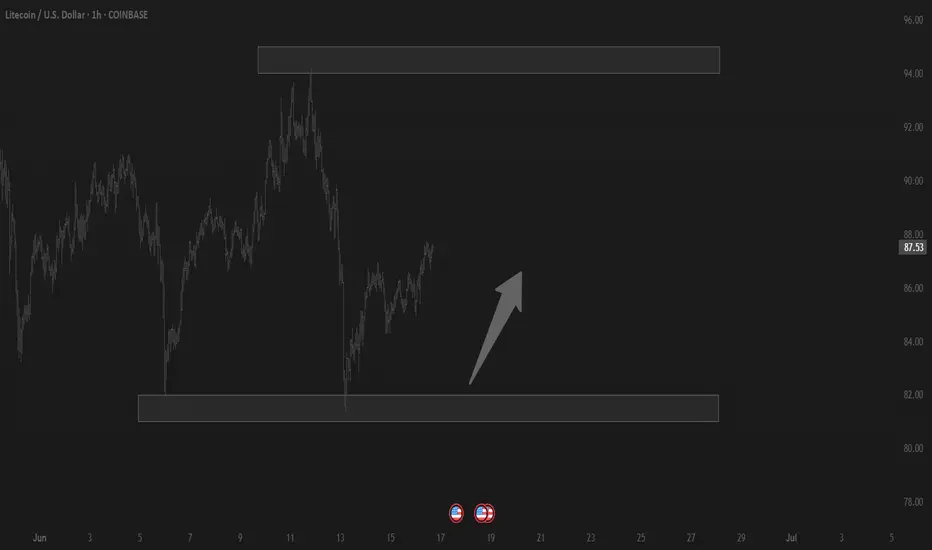
LTC/USDT — Accumulation Before Breakout?📊 Technical Overview:
Litecoin is forming a potential reversal structure near a key long-term support zone. Historically, this area acted as an accumulation range before significant upward moves.
The price is still holding within a broad ascending channel, and current consolidation may represent the final stage before a breakout.
🔻 Below lies a potential liquidity trap zone — a fakeout could occur, triggering weak hands before continuation. For us, that’s a spot to add, not to exit.
📈 Trade Plan:
-Partial entry is already possible at the current zone
-Additional entries planned if price drops lower
-No stop-loss — risk is managed strictly via position sizing
-Take-profits aligned with major resistance zones where selling pressure occurred in the past
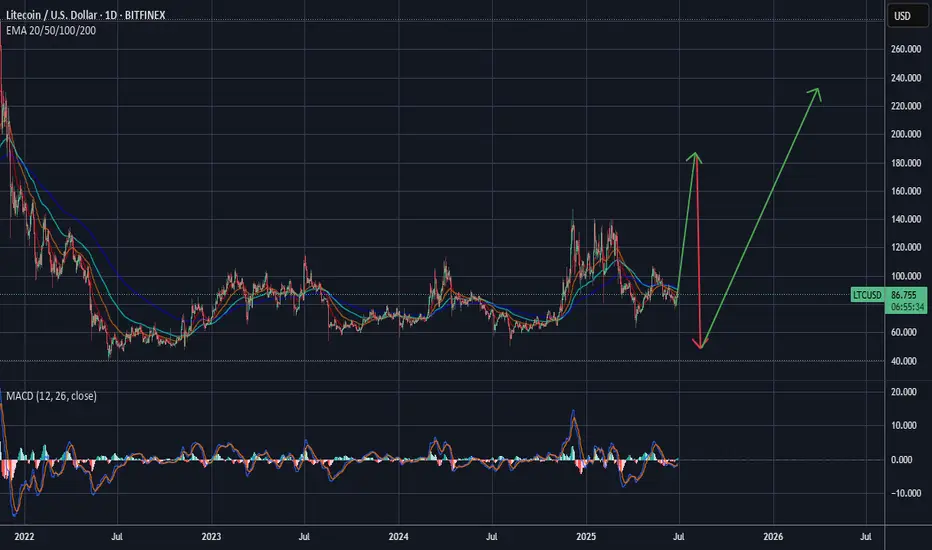
LTC/USDExpecting something like this on most alts.
I've been waiting patiently for a real correction in everything, but my timing was drastically off. Looks like FOMO is still in charge. My guess, stock market to ATH after ATH for a while and a final wave of FOMO for crypto will enter the air.
I believe the majority are expecting a COVID-like rebound, followed by rally continuation, but the majority tends to be wrong.
What I can tell you is the true crypto bull run will not begin on optimism, as it has been...
It will begin on pessimism.
Litecoin: A good coin to add to your holdingsHello,
There is an opportunity to buy Litecoin at the current price with a short-term potential of an over 100% gain. The coin is currently trading close to the bottom of a corrective pattern. We see the current price as a great opportunity for buyers to take advantage of.
The MACD indicator is showing signs of a bullish crossover further reinforcing our bullish view. We see $1476 as a feasible target in the near term.
Disclosure: I am part of Trade Nation's Influencer program and receive a monthly fee for using their TradingView charts in my analysis.
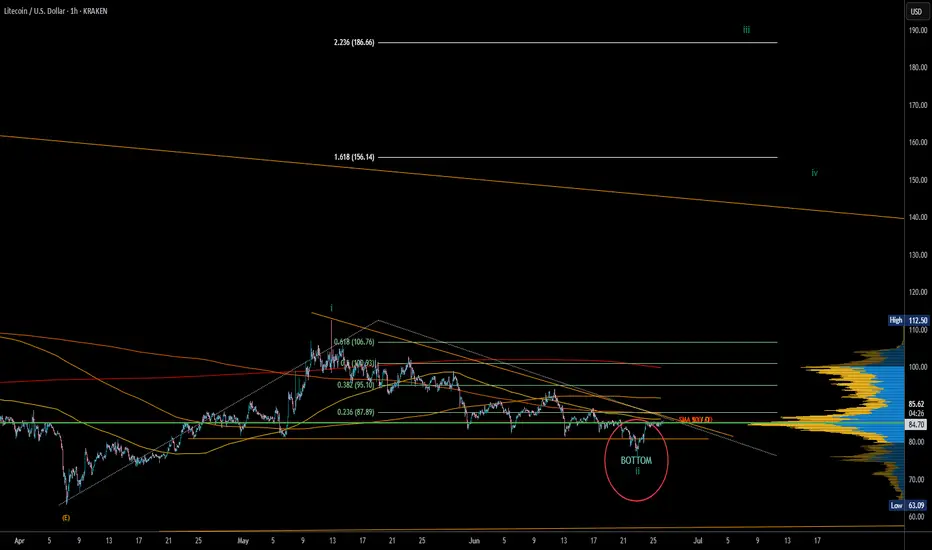
LTCUSD - Bottom in, starting wave 3In green we see the levels to be taken out as a corrective wave, but the structure is very much impulsive, so we aim fot the impulsive fib targets of 1.6 and 2.3.
Let's go!!
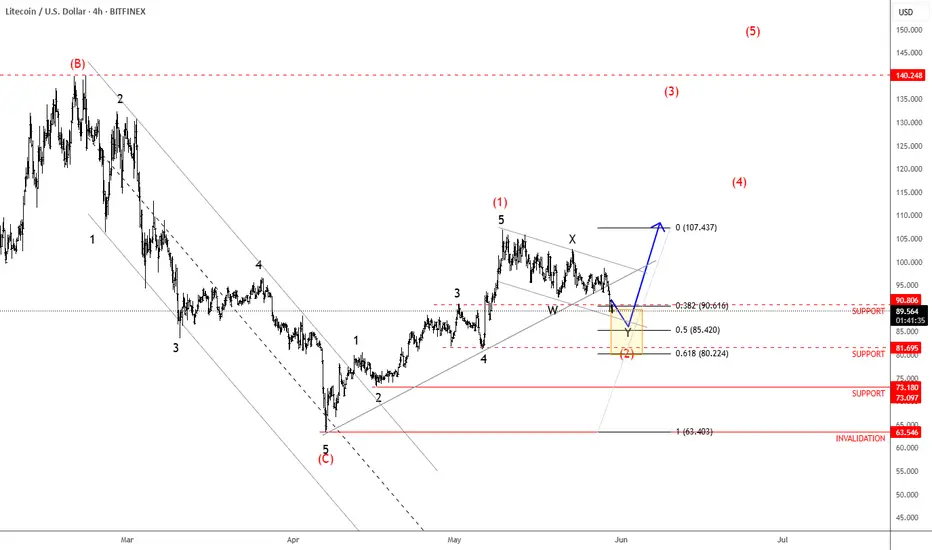
Litecoin Is Forming A Bullish PatternLitecoin with ticker LTCUSD made nice and clean five-wave recovery back to 100 area in the 4-hour chart, which confirms support in place and bullish reversal, so it can be a higher degree wave (1), thus more upside is expected for a higher degree wave (3) after current complex W-X-Y correction in wave (2) that can be in final stages. First support is here around 90-85 area, while second deeper one would be at 80 area.
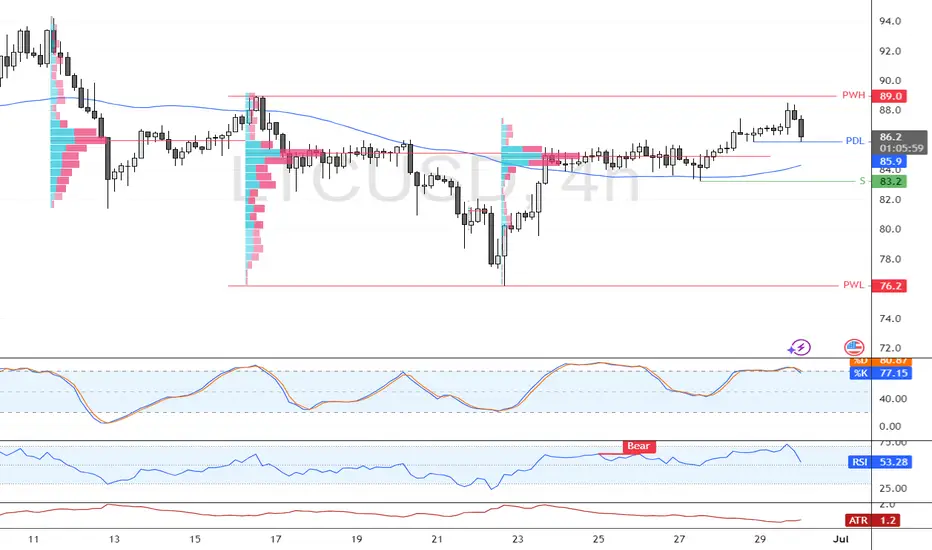
LTC Approaches Support Zone with Breakout PotentialFenzoFx—Litecoin dropped 1.92% after approaching the $89.0 resistance. It now trades near $86.4, a zone aligned with a high-volume node and previous daily low.
Support ranges from $85.9 to $83.2. If LTC stays above $83.2, a bullish breakout above $89.0 may follow. A close below $83.2 invalidates this outlook.
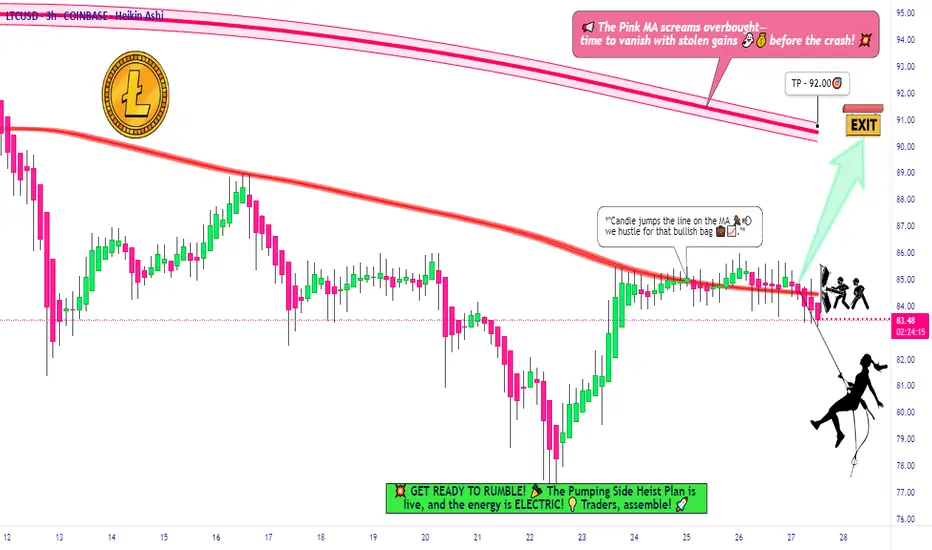
Is This the Perfect Moment to Rob the LTC/USD Vault?🏴☠️ LTC/USD Heist Mode: The Moving Average Break-In Plan 💰📈
🌟Hi! Hola! Ola! Bonjour! Hallo! Marhaba!🌟
Calling all Market Bandits, Crypto Hustlers & Chart Raiders! 🤑💰🚀
🚨Mission Briefing
We’re eyeing a bullish breakout hit job on the LTC/USD chart — all based on the elite 🔥Thief Trading Style🔥 with a touch of candle science, moving average vault-cracking, and some solid day/swing setups. This ain’t your grandma’s trade plan — this is high-level lootin’ with precision.
🕵️♂️ 🎯 ENTRY PLAN — Unlock the Vault at $86.00
Wait for the MA breakout + candle close above that sneaky Moving Average line.
➡️ Execute Buy Stop orders above MA
➡️ OR place Buy Limit during a pullback to swing low/high zones in 15m–30m timeframe.
📌 Pro tip: Set an alert – catch the breakout live, don’t chase it later.
🛑 STOP LOSS — Your Getaway Route
Place your Thief SL near the recent swing low (82.00 using 3H chart).
🎤“If you’re entering like a pro, stop loss goes where it should – not where fear lives. But hey, it's your ride or die. Choose wisely.” 🔥
💡Adjust SL based on lot size, risk %, & how deep your robbery goes.
🏴☠️ TARGET ZONE — Exit the Scene at $92.00
Get your bags packed, profits stacked, and be ready to escape before the market catches on.
💸 Grab the loot and bounce before the reversal gangs arrive!
📈 Why the Heist?
The LTC/USD crypto market is showing bullish momentum, backed by key analysis angles:
🔍 Fundamentals
📊 COT Report
💥 On-Chain Metrics
🧠 Sentimental Heat
🌍 Intermarket Structure
👉 Check your intel. React. Don’t sleep. 🔗🔗
⚠️ News Alert & Risk Tip
🗞️ Stay clear of trades during volatile news releases
🔐 Use trailing stops to lock in gains
🚫 Protect your positions – don't let profits slip through cracks.
📌Disclaimer:
This ain’t financial advice — it’s just a shared plan for market raiders. Trade at your own risk, and don’t forget to bring your own map. Market shifts faster than a getaway car — so adapt & react smartly. 🧠💡
💖 BOOST the Plan 💥
Hit that Boost Button if you're vibin’ with the robbery crew. It powers up the strategy and supports the movement. Together, we trade to take — The Thief Trading Way. 💸💪🎉
🚀 Catch you on the next breakout. Stay sneaky, stay sharp. 🐱👤🤑
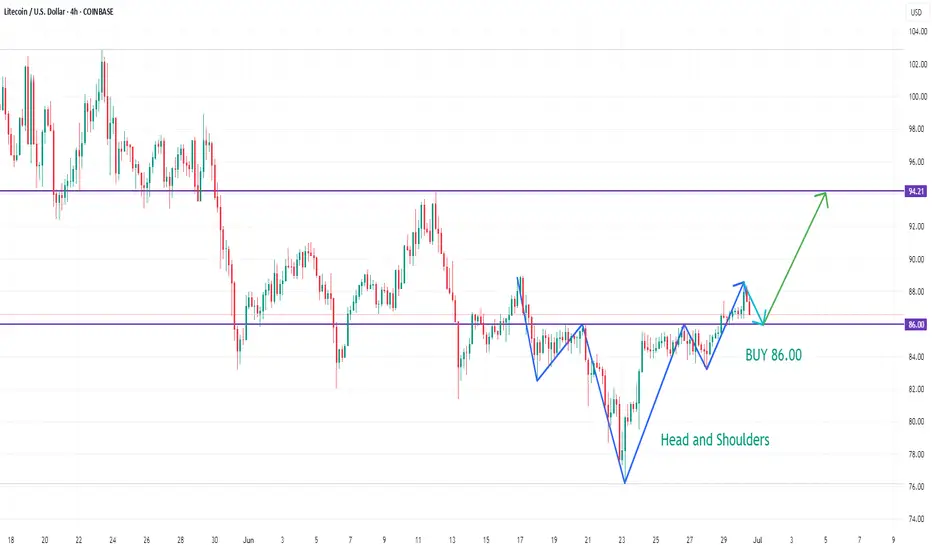
LTCUSD BUY 86.00On the 4-hour chart, LTCUSD has formed a head and shoulders bottom pattern. Currently, we can pay attention to the support near 86.00. If it falls back and stabilizes, we can consider buying. The upper resistance is around 94.20.
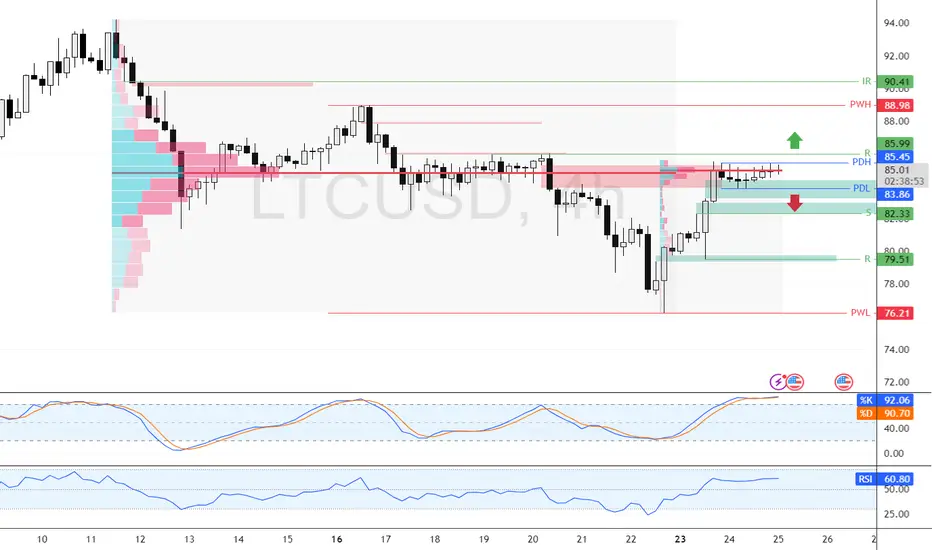
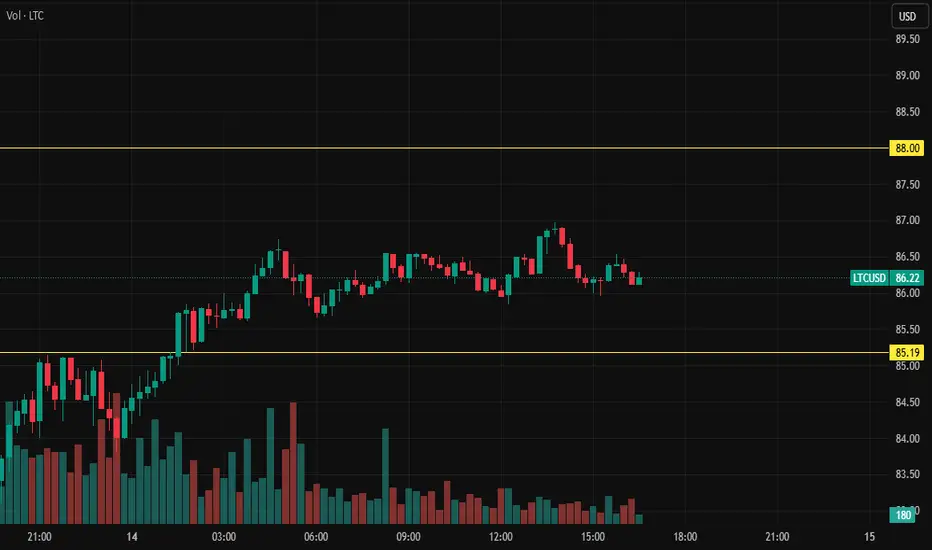
Overbought LTC Faces Pressure at $85.0 BarrierLitecoin is building liquidity near $85.0, a strong resistance backed by volume, with Stochastic at 92.0 indicating short-term overbought conditions.
If LTC dips below $83.86, a bearish wave may follow toward $82.33 and $79.51. Conversely, a close above $87.99 could resume the uptrend toward $88.98.
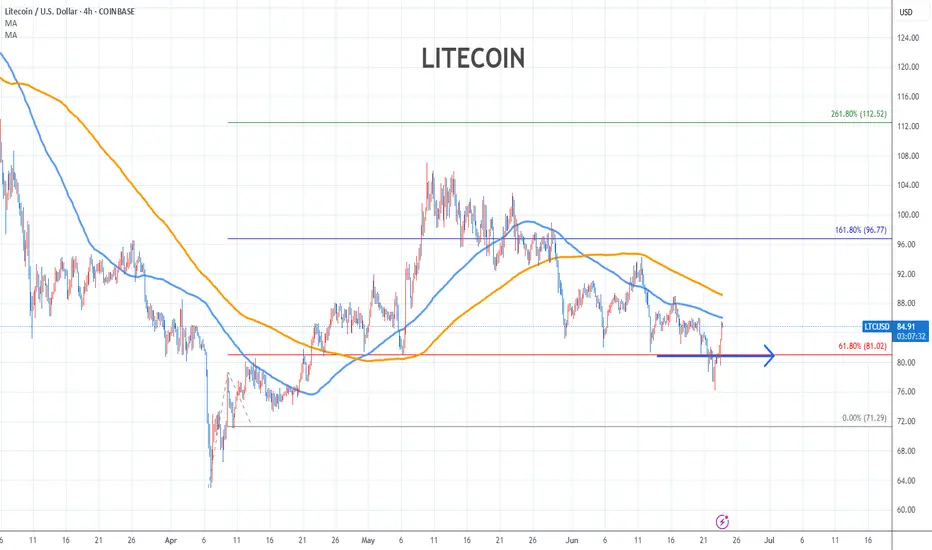
LTC coming into MAJOR Support
As you can see in the second photo, LTC has been holding this trendline as support for almost a decade, as far back as 2017. LTC still has a few weeks left to fall but once in comes down in between these 2 major weekly trendlines I have drawn, I think that's as far down as it will go, and we should see a major bounce.
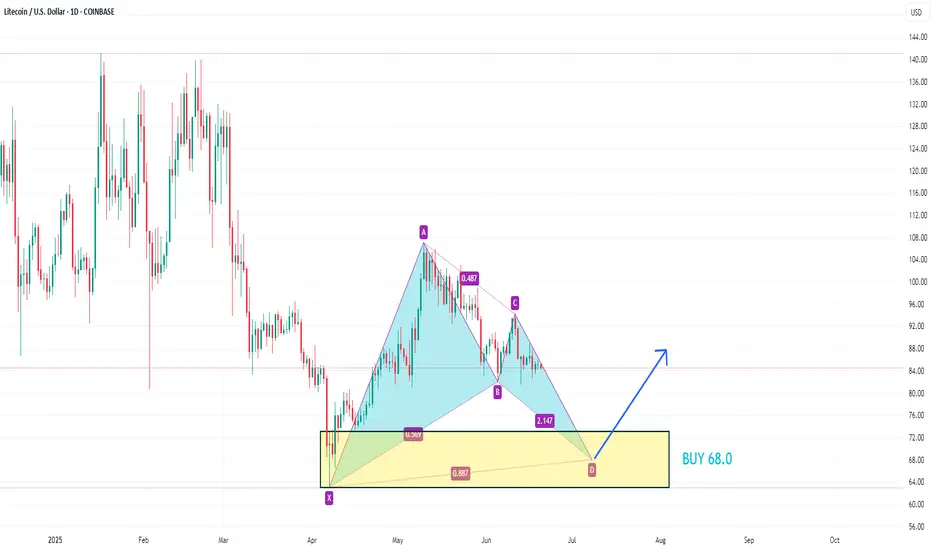
LTCUSD Potential Bat PatternOn the daily chart, LTCUSD fluctuated downward, and the bears had the upper hand. The current support below can be seen around 68.0, which is also in the previous demand area.
Litecoin Stock Chart Fibonacci Analysis 062325Trading Idea
1) Find a FIBO slingshot
2) Check FIBO 61.80% level
3) Entry Point > 81/61.80%
Chart time frame:C
A) 15 min(1W-3M)
B) 1 hr(3M-6M)
C) 4 hr(6M-1year)
D) 1 day(1-3years)
Stock progress:A
A) Keep rising over 61.80% resistance
B) 61.80% resistance
C) 61.80% support
D) Hit the bottom
E) Hit the top
Stocks rise as they rise from support and fall from resistance. Our goal is to find a low support point and enter. It can be referred to as buying at the pullback point. The pullback point can be found with a Fibonacci extension of 61.80%. This is a step to find entry level. 1) Find a triangle (Fibonacci Speed Fan Line) that connects the high (resistance) and low (support) points of the stock in progress, where it is continuously expressed as a Slingshot, 2) and create a Fibonacci extension level for the first rising wave from the start point of slingshot pattern.
When the current price goes over 61.80% level , that can be a good entry point, especially if the SMA 100 and 200 curves are gathered together at 61.80%, it is a very good entry point.
As a great help, tradingview provides these Fibonacci speed fan lines and extension levels with ease. So if you use the Fibonacci fan line, the extension level, and the SMA 100/200 curve well, you can find an entry point for the stock market. At least you have to enter at this low point to avoid trading failure, and if you are skilled at entering this low point, with fibonacci6180 technique, your reading skill to chart will be greatly improved.
If you want to do day trading, please set the time frame to 5 minutes or 15 minutes, and you will see many of the low point of rising stocks.
If want to prefer long term range trading, you can set the time frame to 1 hr or 1 day.
Litecoin Confronts $86.0 Resistance as Overbought Signals EmergeFenzoFx—Litecoin is testing $58.99, which aligns with a 4-hour bearish Fair Value Gap. Stochastic reads 84.0, suggesting overbought conditions.
If $85.99 resistance holds, a bearish move toward $84.19 and possibly $81.01 could follow.

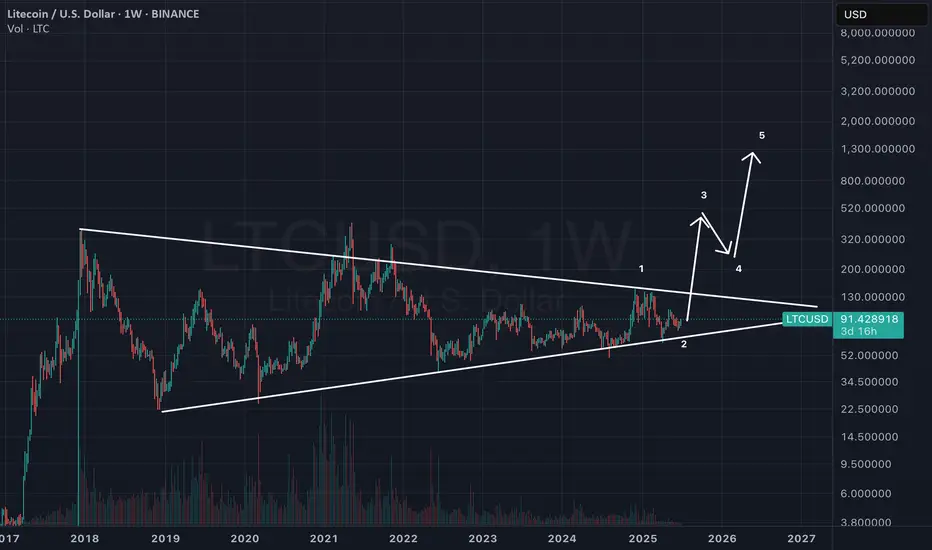
Litecoin is approaching a critical breakout point.
LTC has been consolidating within this symmetrical triangle for an extended period, showing decreasing volatility and tighter price action. The structure suggests that a significant move is imminent.
🎯 Target 1: $400
🎯 Target 2: $1,000
If the breakout occurs in the coming weeks, we could see Litecoin reaching the $400 level within the next 2 to 3 months, with potential to hit $1,000 over the next 12 months — especially if bullish momentum picks up across the crypto market.
Watch closely — the move could be explosive.
Best of luck to everyone! 🚀
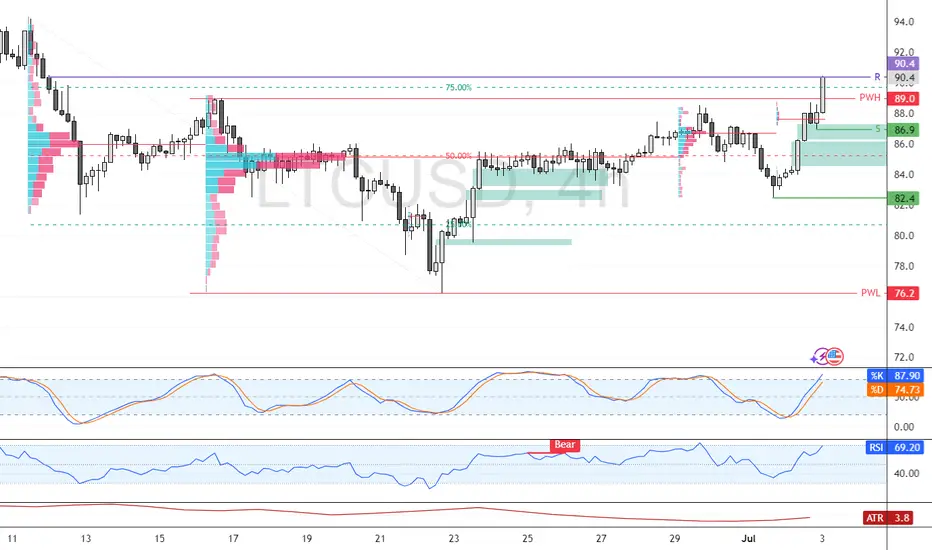
Litecoin Encounters Resistance After Sharp RallyLitecoin climbed from $82.4 and is testing the bearish fair value gap at $90.4. With Stochastic showing short-term overbought conditions at 87.0, consolidation is expected.
LTC may retest $89.0 and then dip toward support at $86.9, which aligns with a volume point of interest. The bullish view holds above $82.4; below it, the outlook weakens.
LTC/USD Consolidates—Key Levels to Watch FenzoFx—Litecoin consolidates near $85.0, with key support at $81.0, aligning with last week's low. If support holds, LTC/USD could target $90.4. A drop below $81.0 invalidates the bullish outlook.

LTC last point of support'' Decisive test of the remaining supply, allowing the “smart money” operators to ascertain whether is ready to be marked up... what should follow is the consistent dominance of demand over supply. This is evidenced by a pattern of advances ''
Failure to get back up above the trading range will result in lower lows, be careful.
Trading balanceTrading balance The price of the asset has rebounded from the balance zone. With the prospect of growth into the resistance zone.
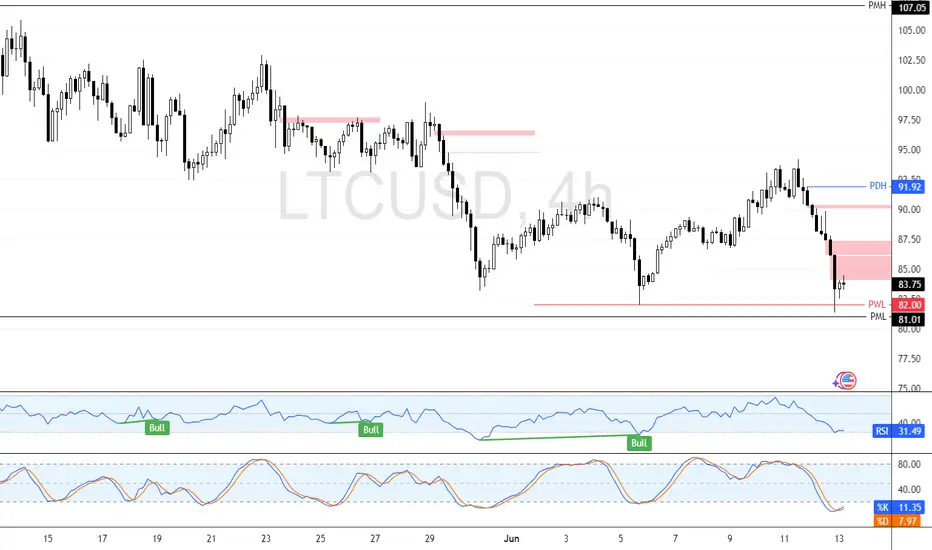
Litecoin is Oversold—Is a Rebound Coming? FenzoFx—Litecoin swept liquidity below the previous week's low, aligning with the monthly low at $81.01, a strong support zone.
LTC trades near $83.70 with weak bullish sentiment. Stochastic at 11.00 signals an oversold market, suggesting potential consolidation or a rebound.
A bullish wave may emerge if LTC holds above $81.01, targeting $91.92. Closing below this level invalidates the bullish outlook.
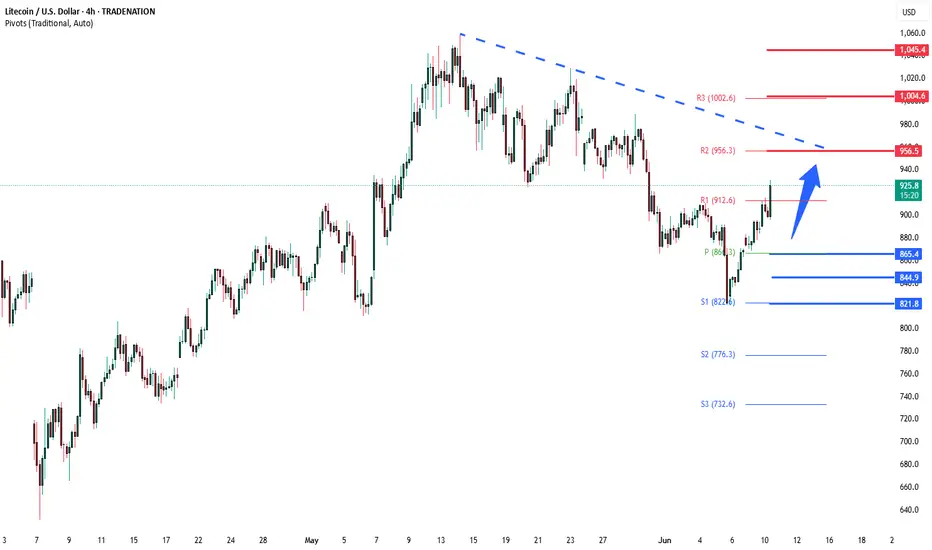
LTCUSD INTRADAY oversold bounceback supported at 865Trend Overview:
LTC/USD remains in a bullish trend, characterized by higher highs and higher lows. The recent intraday price action is forming a continuation consolidation pattern, suggesting a potential pause before a renewed move higher.
Key Technical Levels:
Support: 865 (primary pivot), followed by 845 and 820
Resistance: 956 (initial), then 1000 and 1045
Technical Outlook:
A pullback to the 865 level, which aligns with the previous consolidation zone, could act as a platform for renewed buying interest. A confirmed bounce from this support may trigger a continuation toward the next resistance levels at 956, 1000, and ultimately 1045.
Conversely, a daily close below 865 would suggest weakening bullish momentum. This scenario would shift the bias to bearish in the short term, potentially targeting 845 and 820 as downside levels.
Conclusion:
LTC/USD maintains a bullish structure while trading above the 865 support. A bounce from this level would validate the consolidation as a continuation pattern, with upside potential toward the 956 area. A breakdown below 865, however, would invalidate this view and suggest deeper corrective risk.
This communication is for informational purposes only and should not be viewed as any form of recommendation as to a particular course of action or as investment advice. It is not intended as an offer or solicitation for the purchase or sale of any financial instrument or as an official confirmation of any transaction. Opinions, estimates and assumptions expressed herein are made as of the date of this communication and are subject to change without notice. This communication has been prepared based upon information, including market prices, data and other information, believed to be reliable; however, Trade Nation does not warrant its completeness or accuracy. All market prices and market data contained in or attached to this communication are indicative and subject to change without notice.
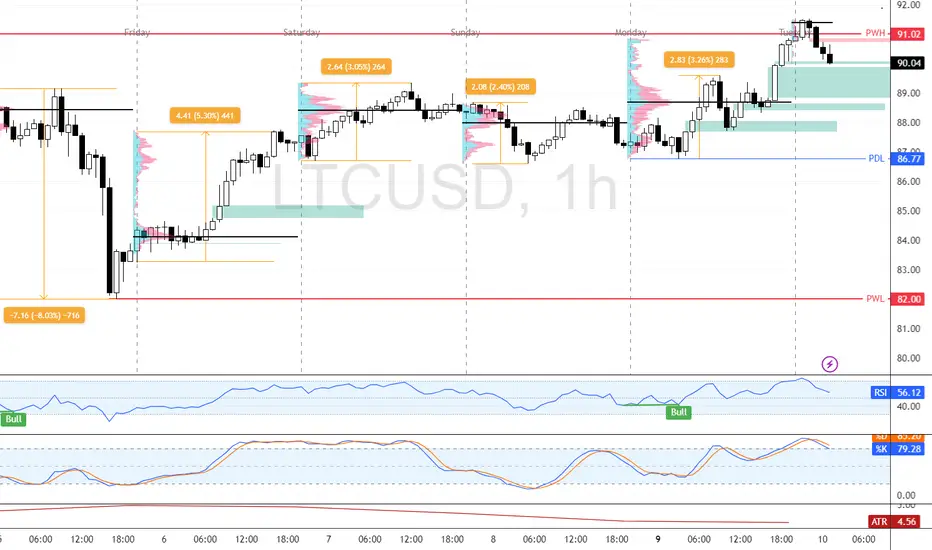
Litecoin Hits Key ResistanceFenzoFx—Litecoin took buy-side liquidity at the $91.02 resistance, aligning with monthly highs. A bearish FVG emerged, signaling selling pressure in Tokyo's session. The Stochastic Oscillator at 81.0 suggests a potential bearish wave.
A bearish trend may form if LTC stabilizes below $91.02, targeting $86.77. However, if Litecoin breaks above this level with a bullish engulfing candlestick, the bearish outlook is invalidated.