Whats a FakeOut in Technical Analysis.A fake out, in technical analysis, refers to a deceptive market move that initially appears to signal a significant shift in price direction but ultimately proves to be false. It occurs when a price breakout or breakdown occurs, luring traders into believing that a new trend is emerging, only for the price to quickly reverse and move in the opposite direction.
For example, let's consider a stock that has been trading within a tight range between $50 and $60 for several weeks. Traders closely watch this range, waiting for a breakout or breakdown. Suddenly, the stock price surges above $60, triggering a breakout signal. Many traders interpret this as a bullish sign and start buying the stock, expecting further upward movement. However, instead of continuing the upward trend, the stock quickly reverses, dropping back below $60 and potentially even below the previous range. This sudden reversal traps the bullish traders, leading to losses and frustration.
Fake outs can occur due to market manipulation, false signals from technical indicators, or unexpected news events. They can cause confusion and result in traders making incorrect trading decisions based on the false breakout. Therefore, it is essential for traders to exercise caution, verify breakout signals with additional confirmation, and use risk management strategies to minimize potential losses caused by fake outs.
Can You See The FakeOut On This 4 Hr Chart
LTCUSD trade ideas


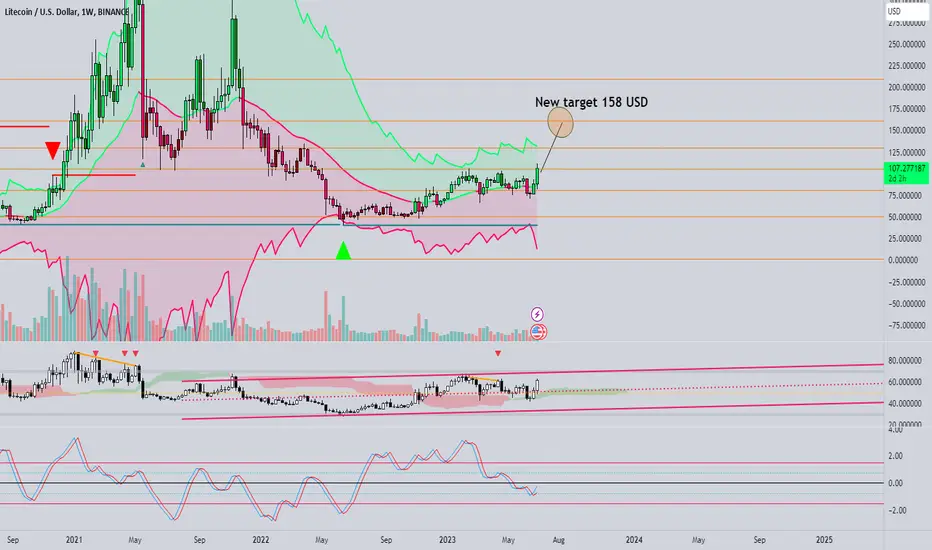
LTCUSDT next target 158 USDAfter today's massive push up, my next target will be 158 usd. It has huge potantial. Even if it hits 158 I have no intention to sell.
LTC Intraday ChartHi
It seems that LTC has ended wave (1) intermediate and for now is making waves (ABC) intermediate to complete wave (2).
This corrections should be only and only watched till correction ended.
Just See and make a good Plan.
Bye

ltcLitecoin is a decentralized peer-to-peer cryptocurrency and open-source software project released under the MIT/X11 license. Inspired by Bitcoin, Litecoin was among the earliest altcoins, starting in October 2011. In technical details, the Litecoin main chain shares a slightly modified Bitcoin codebase.
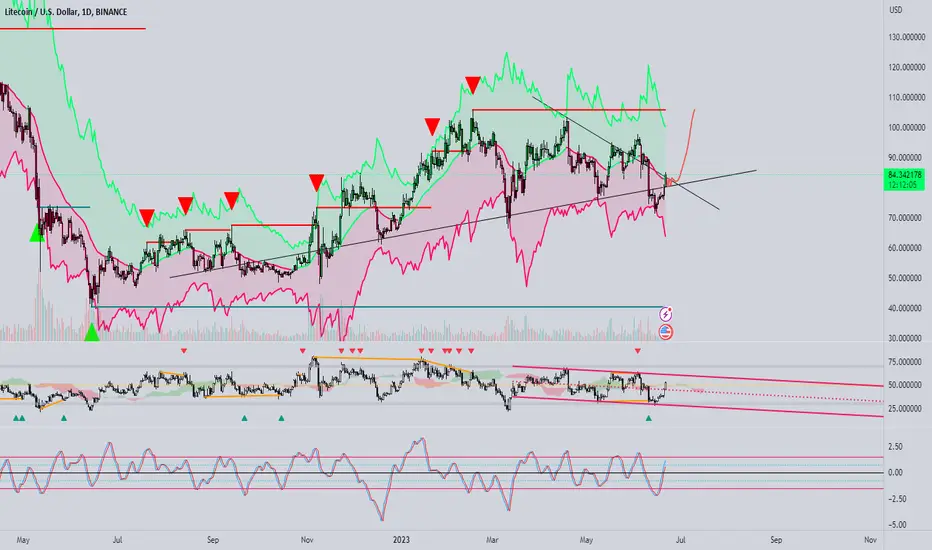
LTCUSD is attempting a bullish break out. Massive pump if it breLitecoin / LTCUSD is finally showing signs of bullish momentum, moving towards Resistance A (105.500).
If broken, buy and target the 1.786 Fibonacci extension (as on the November break out) at 132.000.
If not, wait for the price to pull back to the 1day MA50 before buying.
The RSI patterns between now and September-October are very similar.
Follow us, like the idea and leave a comment below!!

LTCUSD. Target 105USDI see opportunity to buy here. LTC haling is coming.
My strategy about crypto currencies: Always buy never sell.
What is a Litecoin block halving event?
Block halving event happens every 4 years on Litecoin blockchain. Litecoin's initial block reward was 50 LTC. The block reward splits every 4 years. This lowers the rate at which Litecoins are generated. The halving is periodical and is programmed into Litecoin's code. Current Litecoin block reward is 12.5 LTC, after the halving, the block reward will be 6.25 LTC. Halving will end approximately by the year 2142.
Buckle your seatbelts, Litecoin is backThe claim that Litecoin is inefficient because bitcoin has the lightning network and lower fees is no longer valid. Prioritizing Litecoin over both Ethereum and Bitcoin is no longer absurd in my opinion. Let me explain
Transactions, transaction fees, and transaction times are all areas now dominated by Litecoin. With Solana losing a great deal of the community's trust, other altcoins not being widely adopted, and the enormous fees of Bitcoin and Ethereum, the second-oldest cryptocurrency resurrects and becomes the best option for transactions.
Litecoin's target price of $130 could be reached within the span of 1-2 months. Around 45 days prior to the Litecoin halvening. This partly hinges on Bitcoin breaking $30k, but in my opinion, the upside potential of Litecoin is larger than that of Bitcoin and I do think we will ultimately continue up.
Litecoin Storm Warning 🌩️ : Imminent Correction Ahead The weather is tropical 🌴 – translating into imminent correction likely ahead – for Litecoin today.
On the other hand, the global crypto summer ☀️ continues with sunny weather in the coming hours and week ahead for the global crypto market as yet another major asset manager filed a spot Bitcoin ETF and on today’s options expiry.
This signals a slightly bullish market with upside potential. 📈
Follow us for more crypto weather reports!

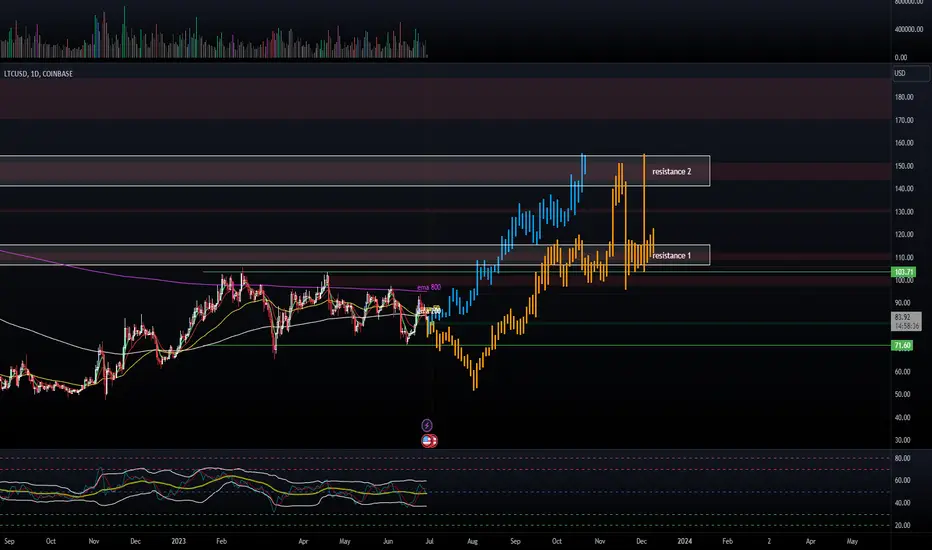
LTCUSD | Will halving get us through the resistance?Good morning,
One month to go until Litecoin Halving.
Since the beginning of the year, we have been constantly moving between the daily EMA 200 (white) and the EMA 800 (purple).
At the time of this idea, we are back below the EMA 200 and all of our EMAs have flattened out.
With such news events, existing resistances and old liquidity zones can usually be worked off well.
I am therefore preparing for two scenarios.
Scenario 1 (blue)
We come in July again significantly above the EMA200 and our short EMAS, 5+13 pull along.
In this I would use 50% of the capital that I want to use for this idea.
The other 50% when breaking above the EMA800.
Scenario 2 (orange)
We get a stop hunt of our range.
Everything from $71.60 would be a top price and would lead to 50% accumulation.
The other 50% would come into play should we get back into the range after such a stop hunt.
Price Targets :
Around $110 and between $140 and $150.
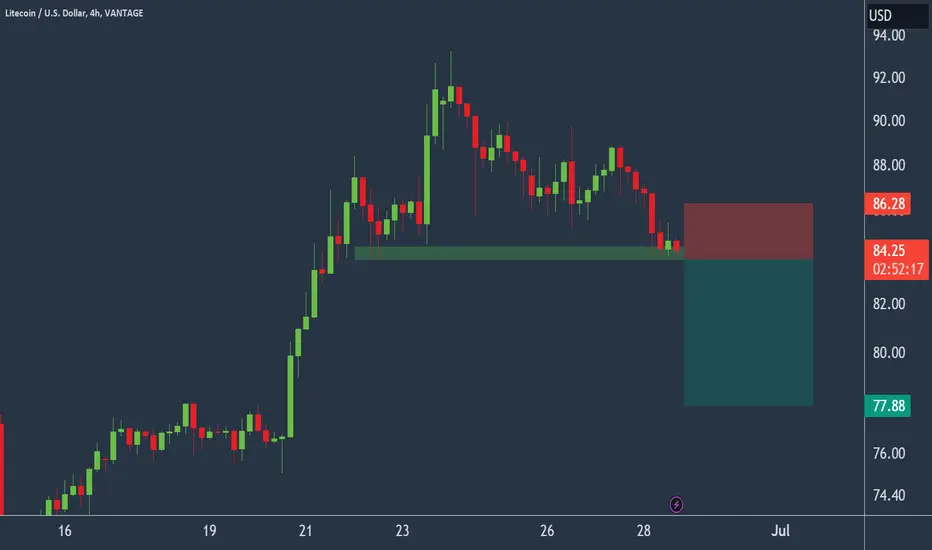
Litecoin to breakdown?Litecoin - 24h expiry - We look to Sell a break of 83.88 (stop at 86.28)
Short term momentum is bearish. The trend of higher intraday lows has also been broken.
A break of the recent low at 84.18 should result in a further move lower.
We look for losses to be extended today.
Expect trading to remain mixed and volatile.
Our profit targets will be 77.88 and 76.88
Resistance: 87.00 / 88.50 / 90.00
Support: 84.18 / 83.00 / 80.00
Please be advised that the information presented on TradingView is provided to Vantage (‘Vantage Global Limited’, ‘we’) by a third-party provider (‘Everest Fortune Group’). Please be reminded that you are solely responsible for the trading decisions on your account. There is a very high degree of risk involved in trading. Any information and/or content is intended entirely for research, educational and informational purposes only and does not constitute investment or consultation advice or investment strategy. The information is not tailored to the investment needs of any specific person and therefore does not involve a consideration of any of the investment objectives, financial situation or needs of any viewer that may receive it. Kindly also note that past performance is not a reliable indicator of future results. Actual results may differ materially from those anticipated in forward-looking or past performance statements. We assume no liability as to the accuracy or completeness of any of the information and/or content provided herein and the Company cannot be held responsible for any omission, mistake nor for any loss or damage including without limitation to any loss of profit which may arise from reliance on any information supplied by Everest Fortune Group.
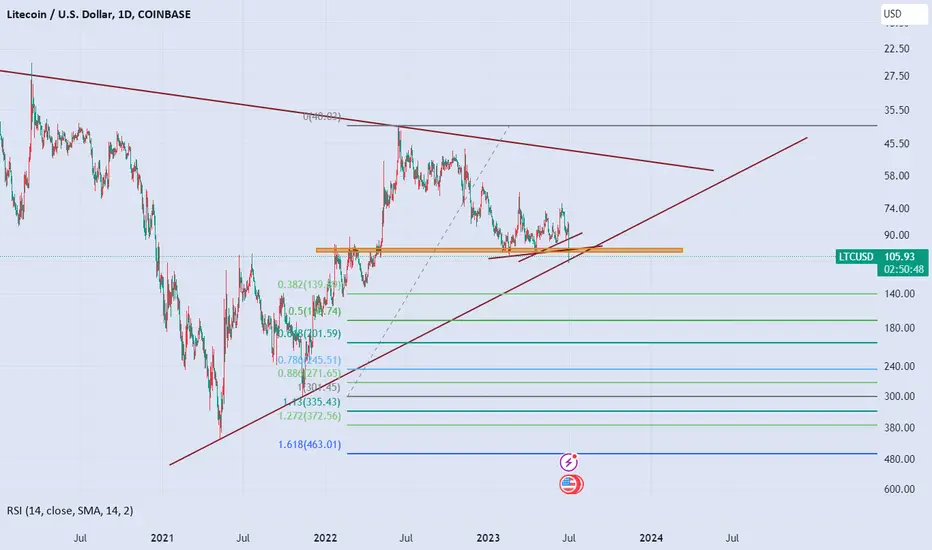
Litecoin Ready for $600 as per "W" Pattern ?Litecoin Technical Analysis
#Litecoin is currently trading at $85.
As per the chart, I am expecting some upward movement before the #LTC halving, followed by a further downside move.
The maximum upward movement could be $130, while the downside move could reach $50.
A price of $50 would be a great buying opportunity for the long run or the next bull market.
The 3-week chart is showing a "W" pattern, and if this pattern repeats, we could see CRYPTOCAP:LTC reach a high of $500-$600 in the next bull run.
Support Levels:- $50
Resistance Levels:- $100/$130/$214/$275

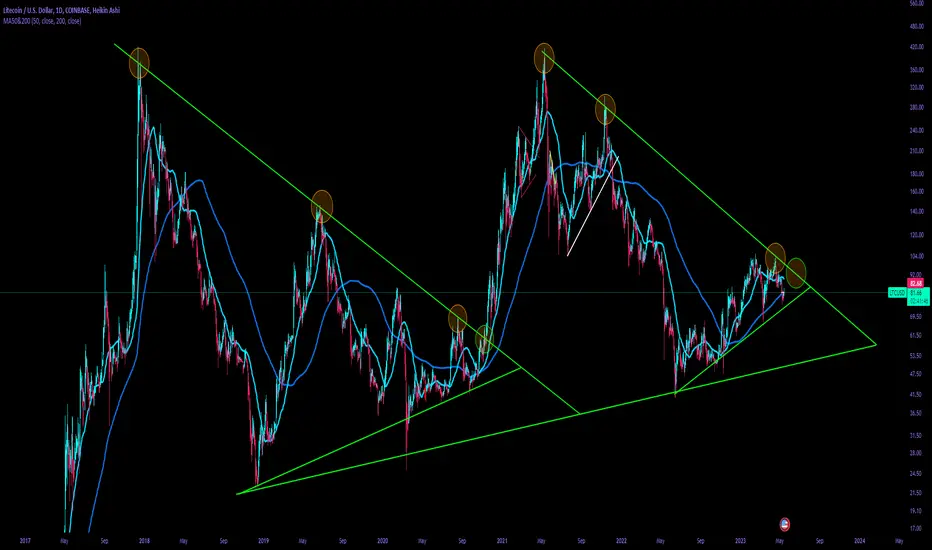
LTCUSD is in for a grinding SummerIf we lay the prior breakout to ATH for LTCUSD we can see it's been in a consolidation phase before and might have some more grinding to get through before the pressure lets off and we see potential upswing back into $100+ pricing.

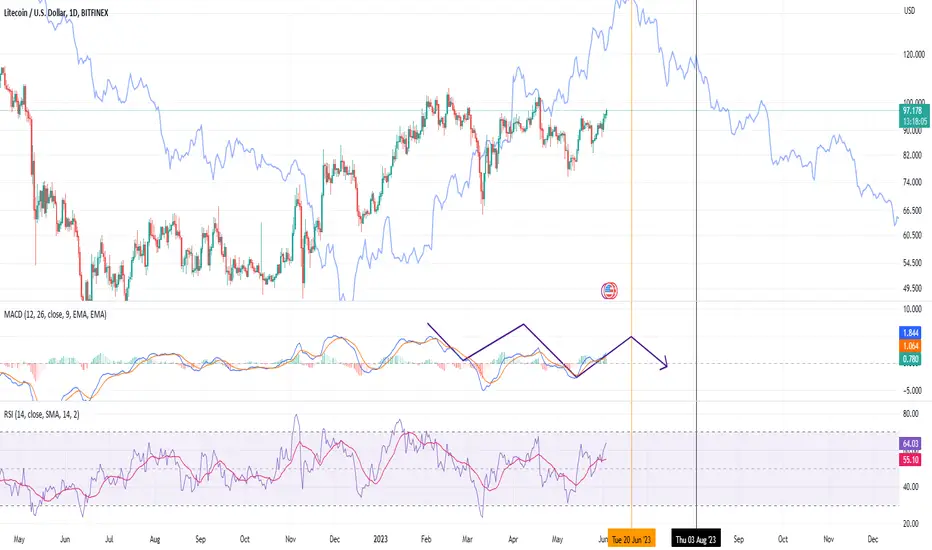
2023/6: Surfing LTC - Entry now, Exit eta 16-20 Jun 2023
LTC: $97.54
Technicals:
1. Fractals point to peak 44 days before next LTC halving
Fundamentals:
1. Halving on 30 July - 2nd Aug (thereabouts)
Analysis:
1. Entry now, searching for exit 16-20 Jun via MACD
LTC play ideas If you find this information inspiring/helpful, please consider a boost and follow!
Any questions or comments, please leave a comment!
Also, check out the links in my signature to get to know me better!
Still working this video thing out. Going to be using TV as a rough draft. So uploads on other places will have the corrections and will be cleaned and scrubbed.
Looking for a potential short here, so looking for Ideal entries, here and always...
PA is already moving away but includes areas of interest for a possible turn as well.
