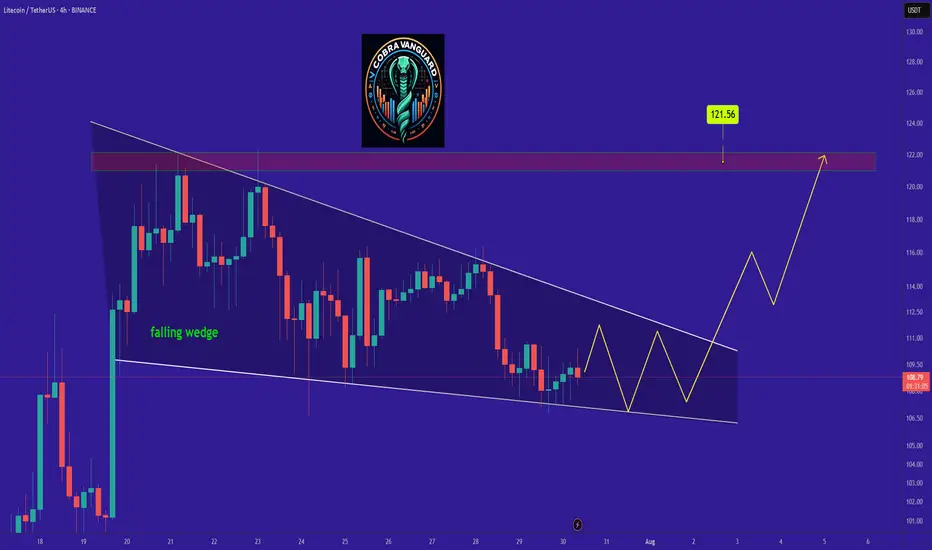
LTC is bullish now and many Traders don't see itSo if you pay attention to the LTC chart you can see that the price has formed a Ascending wedge which means it is expected to price move as equal as the measured price movement.( AB=CD )
NOTE: wait for break of the WEDGE .
Best regards CobraVanguard.💚
Related pairs
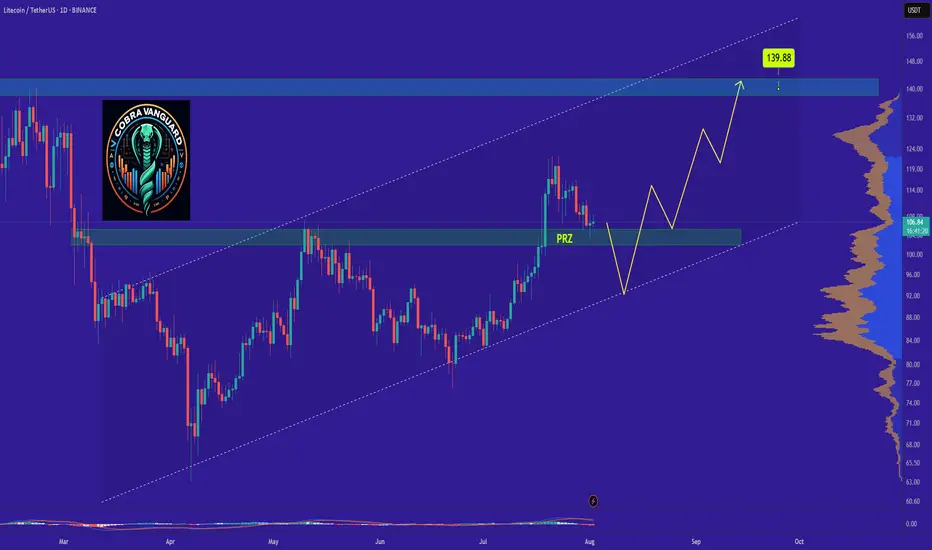
LTCs Situation (Daily) !!!If the price loses the PRZ range, it will drop to the bottom of the channel and then rise to the top of the ascending channel, which will take some time.
Best regards CobraVanguard.💚
Litecoin (LTC): Aiming For $145 Area Before Potential CorrectionLitecoin looks good for potential upside movement here, although trades are not the best to take but we definitely see a good shorting opportunity appening soon.
More in-depth info is in the video—enjoy!
Swallow Academy

Litecoin Hits a New High · Update · Highest Price in 5 MonthsToday Litecoin hit its highest price in more than five months, since March 2025. Soon Litecoin will break its December 2024 high and produce the highest prices since the last bull market, 2021. We are getting very close now.
A few weeks back the market was in a similar situation, doubt started to c

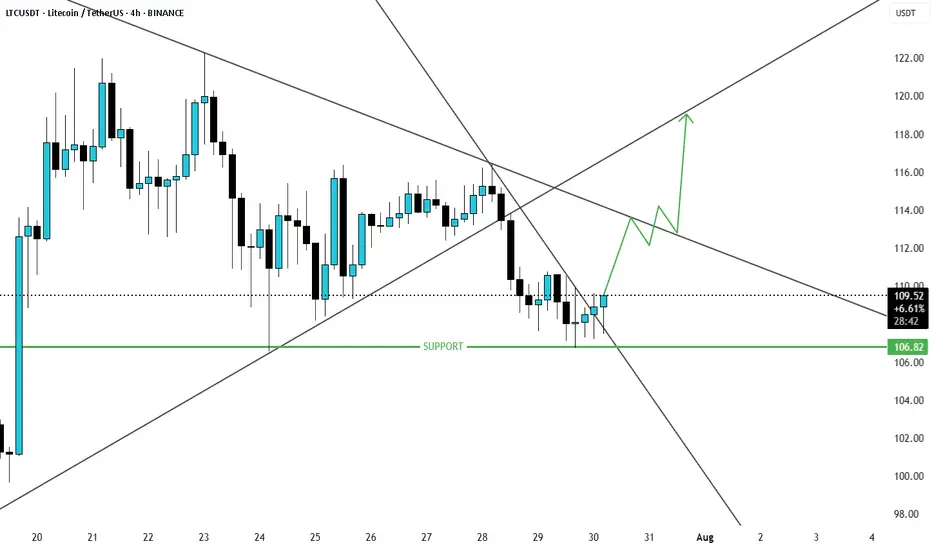
LTCUSD Possible Scenario breakout of trendline resistanceLTCUSD is at major support and has now broken the resistance and price will likely will move up.
LTC- LitCoin - This is how a Fake Break on Fib looks like This is how a Fake Break on Fib looks like using Weis Wave with Speed Index
Reading the Daily Cha rt
1. Fib Location - Sellers could enter here
2. Largest Up volume wave after a while - also sellers could be hidden in there.
3. Increasing PVR (progressing volume rate) = as we approve the top mo

Litecoin Looks Ready – Breakout or Fakeout!Hello Traders 🐺
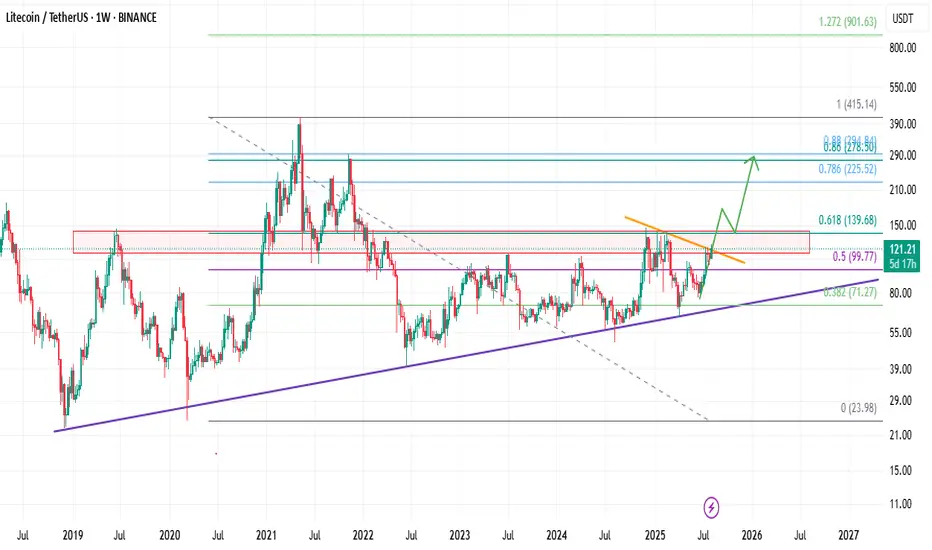
As you can see on the weekly chart, price is trying to break above the resistance line, which is in alignment with the red weekly resistance box and the 0.618 Fibonacci level.
Long story short:
If price manages to push above the 0.618 level — which is a very important resistance —
Litecoin’s Bearish Signal: LTC dropped nearly 10%.Litecoin’s Bearish Signal: LTC dropped nearly 10%.
Litecoin formed a bearish harmonic pattern on the daily chart, completing near 129.20. This setup hints at a potential deeper correction or bearish wave—though that still needs confirmation.
Right after the pattern completed, price showed a stron

LTCUSDT sleeping giantLTC was consolidating for a long period of time, and ready to blast off soon.
Targets are on chart.
DYOR
NFA

LTC/USDT 1H CHART BREAKDOWN.LTC/USDT 1H Chart Breakdown 🔍
Price swept major liquidity at the top and is now retracing.
We have 2 key POIs (Points of Interest) below:
📍 POI 1: Aggressive entry zone
📍 POI 2: More discounted price for safer long entries
⚡ Watch for bullish confirmation inside these zones for potential

See all ideas
Summarizing what the indicators are suggesting.
Oscillators
Neutral
SellBuy
Strong sellStrong buy
Strong sellSellNeutralBuyStrong buy
Oscillators
Neutral
SellBuy
Strong sellStrong buy
Strong sellSellNeutralBuyStrong buy
Summary
Neutral
SellBuy
Strong sellStrong buy
Strong sellSellNeutralBuyStrong buy
Summary
Neutral
SellBuy
Strong sellStrong buy
Strong sellSellNeutralBuyStrong buy
Summary
Neutral
SellBuy
Strong sellStrong buy
Strong sellSellNeutralBuyStrong buy
Moving Averages
Neutral
SellBuy
Strong sellStrong buy
Strong sellSellNeutralBuyStrong buy
Moving Averages
Neutral
SellBuy
Strong sellStrong buy
Strong sellSellNeutralBuyStrong buy
Displays a symbol's price movements over previous years to identify recurring trends.
Frequently Asked Questions
The current price of Litecoin / TetherUS (LTC) is 118.68 USDT — it has fallen −1.35% in the past 24 hours. Try placing this info into the context by checking out what coins are also gaining and losing at the moment and seeing LTC price chart.
Litecoin / TetherUS price has risen by 9.35% over the last week, its month performance shows a 35.86% increase, and as for the last year, Litecoin / TetherUS has increased by 111.59%. See more dynamics on LTC price chart.
Keep track of coins' changes with our Crypto Coins Heatmap.
Keep track of coins' changes with our Crypto Coins Heatmap.
Litecoin / TetherUS (LTC) reached its highest price on May 10, 2021 — it amounted to 413.49 USDT. Find more insights on the LTC price chart.
See the list of crypto gainers and choose what best fits your strategy.
See the list of crypto gainers and choose what best fits your strategy.
Litecoin / TetherUS (LTC) reached the lowest price of 22.32 USDT on Dec 7, 2018. View more Litecoin / TetherUS dynamics on the price chart.
See the list of crypto losers to find unexpected opportunities.
See the list of crypto losers to find unexpected opportunities.
The safest choice when buying LTC is to go to a well-known crypto exchange. Some of the popular names are Binance, Coinbase, Kraken. But you'll have to find a reliable broker and create an account first. You can trade LTC right from TradingView charts — just choose a broker and connect to your account.
Crypto markets are famous for their volatility, so one should study all the available stats before adding crypto assets to their portfolio. Very often it's technical analysis that comes in handy. We prepared technical ratings for Litecoin / TetherUS (LTC): today its technical analysis shows the buy signal, and according to the 1 week rating LTC shows the buy signal. And you'd better dig deeper and study 1 month rating too — it's strong buy. Find inspiration in Litecoin / TetherUS trading ideas and keep track of what's moving crypto markets with our crypto news feed.
Litecoin / TetherUS (LTC) is just as reliable as any other crypto asset — this corner of the world market is highly volatile. Today, for instance, Litecoin / TetherUS is estimated as 5.16% volatile. The only thing it means is that you must prepare and examine all available information before making a decision. And if you're not sure about Litecoin / TetherUS, you can find more inspiration in our curated watchlists.
You can discuss Litecoin / TetherUS (LTC) with other users in our public chats, Minds or in the comments to Ideas.