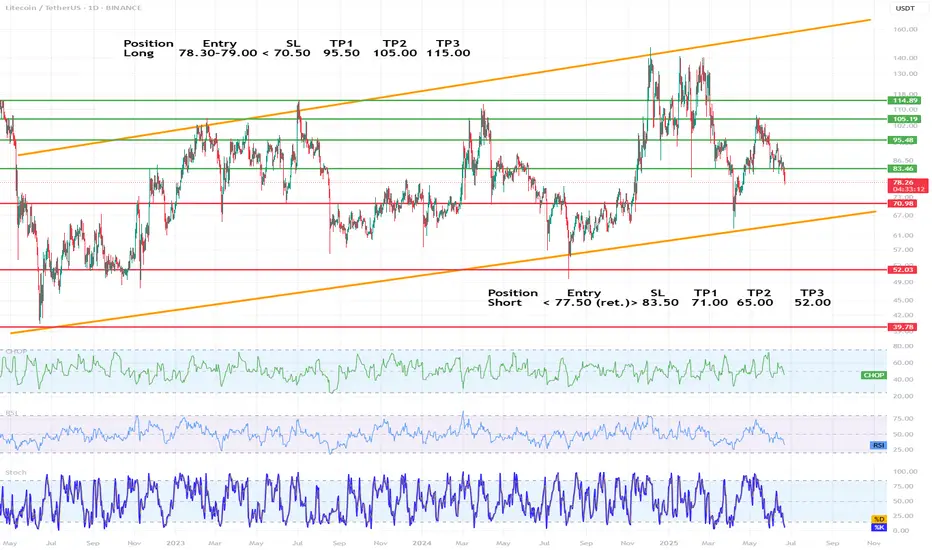
LTC/USDT chart technical analysis (1D)🔷 1. Trend and market structure
🔺 Main channels:
The chart is moving in an ascending channel (orange lines), the lower and upper limits of which have been respected since mid-2022.
The current price (around 78.3 USDT) is in the middle range of the channel, with a downward trend in recent weeks.
🔁
Related pairs
Litecoin LTC price analysisToday we will analyze the third candidate for ETF in the near future is CRYPTOCAP:LTC
An old coin, good fundamentals, 1:1 tokenomics like CRYPTOCAP:BTC but 4 times more coins, untapped potential, and the list goes on...
♎️ The main difference from the previous two candidates is the current mark
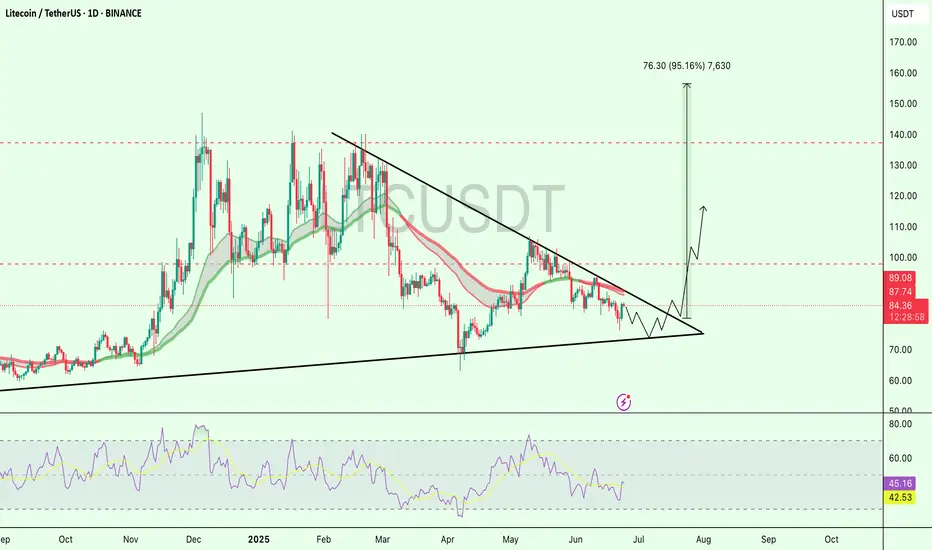
$LTC Coiling Up for a Massive Breakout – 95% Move Loading?NYSE:LTC is consolidating inside a symmetrical triangle and approaching the apex.
Currently holding around the $84 level, showing signs of compression as volatility drops.
If bulls manage to break out above the $89–$90 resistance zone,
we could trigger a strong move toward the $160 zone, that’s ne
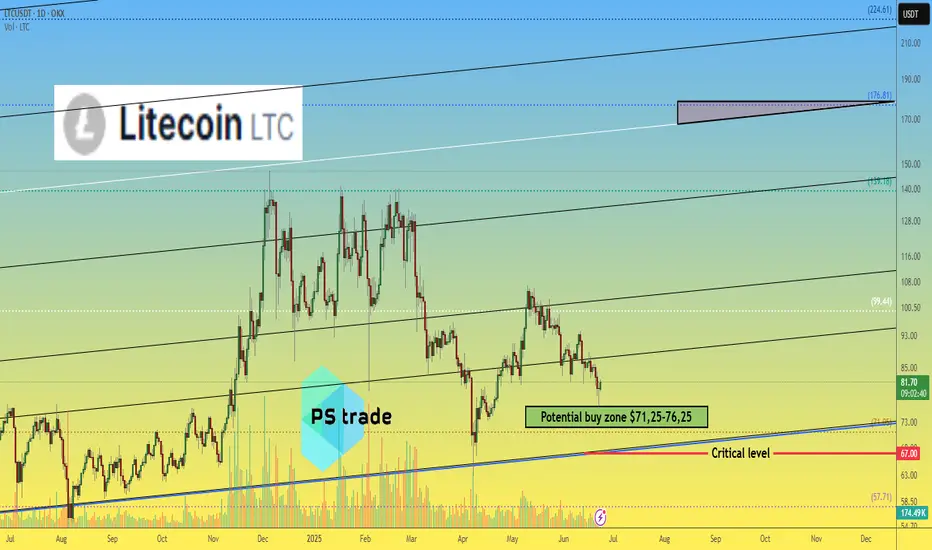
Litecoin:Is the main climb coming?hello friends👋
As you can see, the price, after falling in the support area specified by the buyers, has been supported and returned, forming an upward pattern.
Now we don't enter into a transaction with just one pattern, we also check the entry of buyers and the amount of currency and other facto
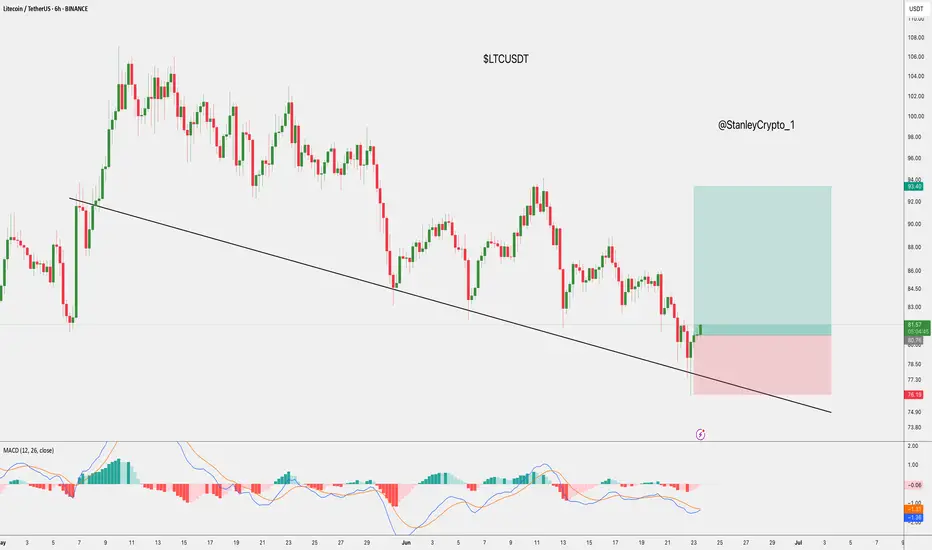
$LTC/USDT Trade Setup 6H Chart.$LTC/USDT Trade Setup 6H Chart.
- Entry: CMP
- Stop Loss: $76.20
Target:
TP 1:- $93.95
TP 2:- $85.65
LTC is bouncing off a long-term trendline support with an early MACD bullish crossover.
DYRO, NFA
Litecoin (LTC): Looking Bad Now, But Has Good Potential Litecoin is in bad shape, where sellers are showing pressure, which could lead to bigger downward movement.
Despite that, we are still above the local neckline area, so we are still bullish, for now!
More in-depth info is in the video—enjoy!
Swallow Academy

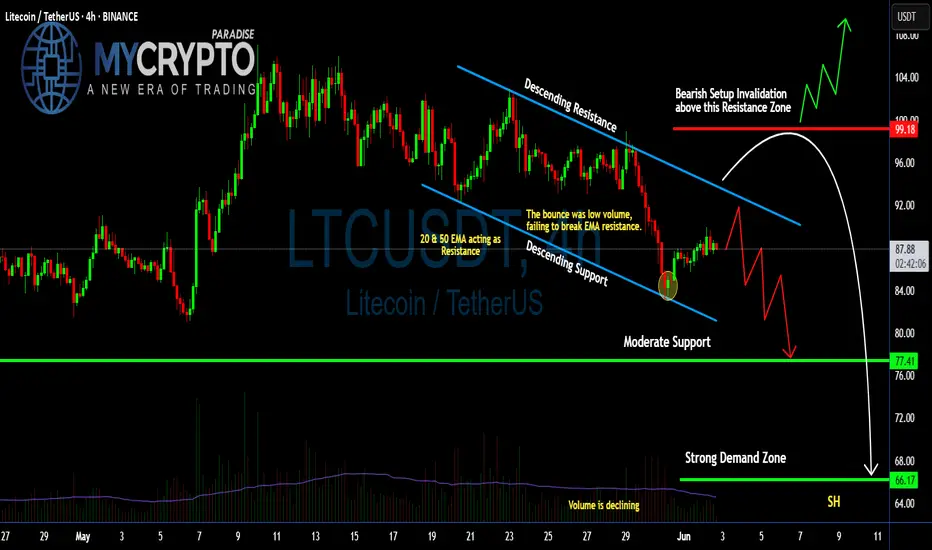
Can #LTC Bulls Make Recovery or Bears will Continue to Dominate?Yello Paradisers! Are you ready for the next wave of #LTC that can catch many traders off guard? Let's see the latest setup of #Litecoin and what can happen next:
💎#LTCUSDT is currently trapped inside a descending channel, signaling sustained bearish pressure. The most recent bounce came with decli
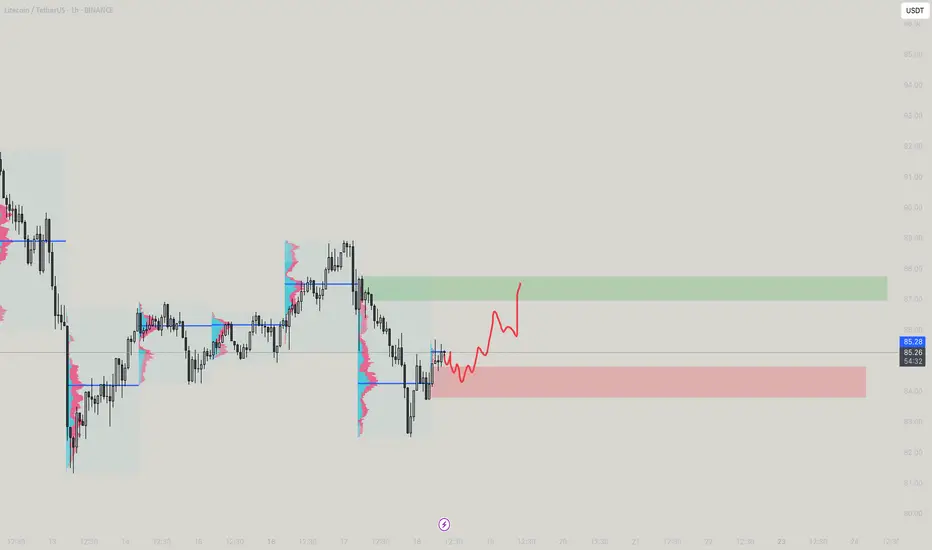
LTCUSDT - Movess?LTCUSDT have moves to be seen prior to anymoves to be taken in consideration! A small pull move down then to up!
LTC: Long 15/06/25BINANCE:LTCUSD.P
Trade Direction:
LTC Long
Risk Management:
- Risk halved as weekend
- Risk is 0.5%
- Stop loss placed below recent swing low / invalidation level
Reason for Entry:
- H1 bullish divergence teasing. Not yet confirmed but I received a alert for its potential formation
- Trendline

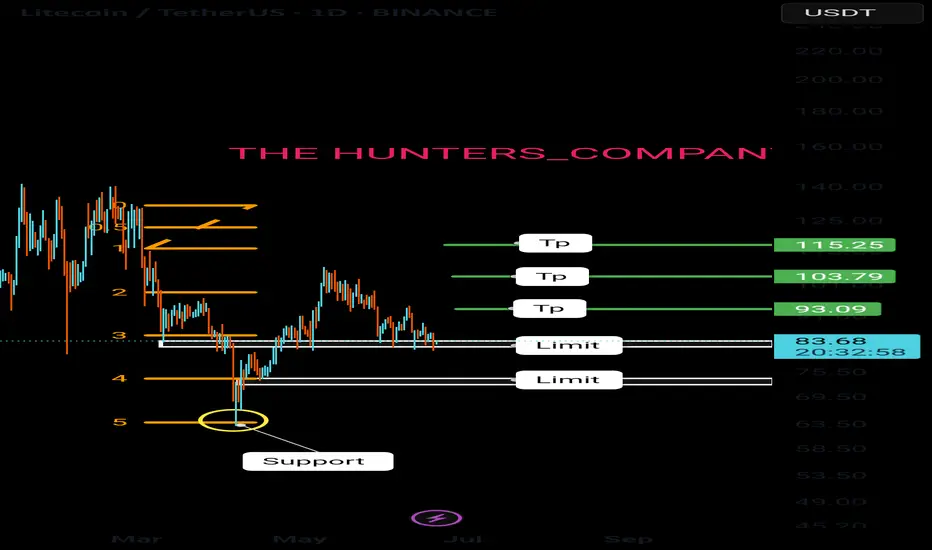
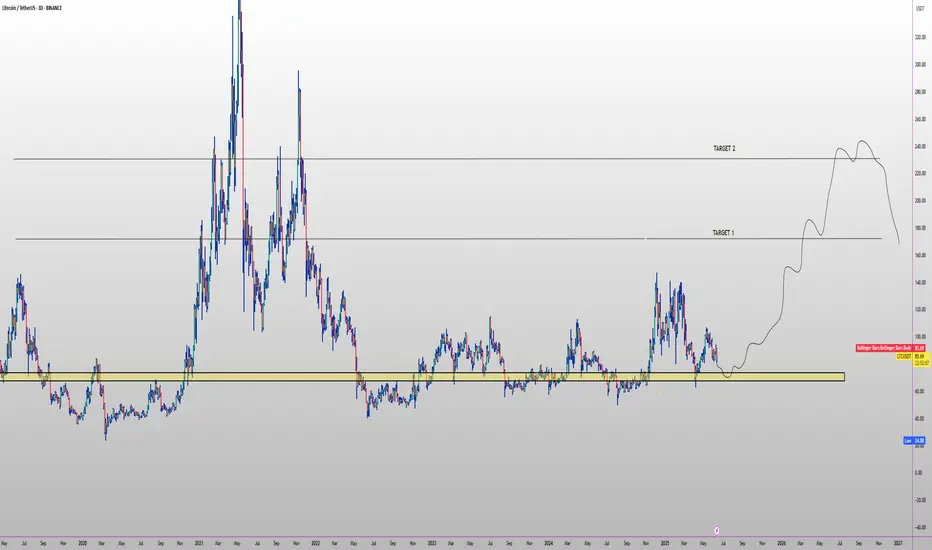
LTC TARGETS FOR Q3🔥 CRYPTOCAP:LTC swing setup (3D) 🚀
✅ Entry Zone: $70 – $77 (multi-year demand)
🎯 Targets
• TP-1: $180 (2021 breakdown line)
• TP-2: $240 (2020-21 pivot)
⛔ Stop-Loss
3-day close < $66
📊 Thesis
• #1 payment coin on BitPay in 2024-25 (201 K tx > BTC & ETH)
• Active addresses +28 % YoY; reco
See all ideas
Summarizing what the indicators are suggesting.
Oscillators
Neutral
SellBuy
Strong sellStrong buy
Strong sellSellNeutralBuyStrong buy
Oscillators
Neutral
SellBuy
Strong sellStrong buy
Strong sellSellNeutralBuyStrong buy
Summary
Neutral
SellBuy
Strong sellStrong buy
Strong sellSellNeutralBuyStrong buy
Summary
Neutral
SellBuy
Strong sellStrong buy
Strong sellSellNeutralBuyStrong buy
Summary
Neutral
SellBuy
Strong sellStrong buy
Strong sellSellNeutralBuyStrong buy
Moving Averages
Neutral
SellBuy
Strong sellStrong buy
Strong sellSellNeutralBuyStrong buy
Moving Averages
Neutral
SellBuy
Strong sellStrong buy
Strong sellSellNeutralBuyStrong buy
Displays a symbol's price movements over previous years to identify recurring trends.
Frequently Asked Questions
The current price of LTC 3x Long / Tether (LTC) is 0.2156 USDT — it has risen 1.02% in the past 24 hours. Try placing this info into the context by checking out what coins are also gaining and losing at the moment and seeing LTC price chart.
LTC 3x Long / Tether price has fallen by −0.73% over the last week, its month performance shows a −38.50% decrease, and as for the last year, LTC 3x Long / Tether has increased by 769.35 K%. See more dynamics on LTC price chart.
Keep track of coins' changes with our Crypto Coins Heatmap.
Keep track of coins' changes with our Crypto Coins Heatmap.
LTC 3x Long / Tether (LTC) reached its highest price on Jun 3, 2021 — it amounted to 11.1050 USDT. Find more insights on the LTC price chart.
See the list of crypto gainers and choose what best fits your strategy.
See the list of crypto gainers and choose what best fits your strategy.
LTC 3x Long / Tether (LTC) reached the lowest price of 0.00001379 USDT on Jul 5, 2024. View more LTC 3x Long / Tether dynamics on the price chart.
See the list of crypto losers to find unexpected opportunities.
See the list of crypto losers to find unexpected opportunities.
The safest choice when buying LTC is to go to a well-known crypto exchange. Some of the popular names are Binance, Coinbase, Kraken. But you'll have to find a reliable broker and create an account first. You can trade LTC right from TradingView charts — just choose a broker and connect to your account.
Crypto markets are famous for their volatility, so one should study all the available stats before adding crypto assets to their portfolio. Very often it's technical analysis that comes in handy. We prepared technical ratings for LTC 3x Long / Tether (LTC): today its technical analysis shows the sell signal, and according to the 1 week rating LTC shows the sell signal. And you'd better dig deeper and study 1 month rating too — it's sell. Find inspiration in LTC 3x Long / Tether trading ideas and keep track of what's moving crypto markets with our crypto news feed.
LTC 3x Long / Tether (LTC) is just as reliable as any other crypto asset — this corner of the world market is highly volatile. Today, for instance, LTC 3x Long / Tether is estimated as 2.41% volatile. The only thing it means is that you must prepare and examine all available information before making a decision. And if you're not sure about LTC 3x Long / Tether, you can find more inspiration in our curated watchlists.
You can discuss LTC 3x Long / Tether (LTC) with other users in our public chats, Minds or in the comments to Ideas.