Your Biggest Trading Enemy Isn’t the Market It’s YouWhy do traders get liquidated right at the peak of confidence?
Is capital safety defined by charts or by our inner world?
Let’s dig deeper. The real threat doesn’t come from the market. It comes from within.
Hello✌
Spend 3 minutes ⏰ reading this educational material.
🎯 Analytical Insight on Lite
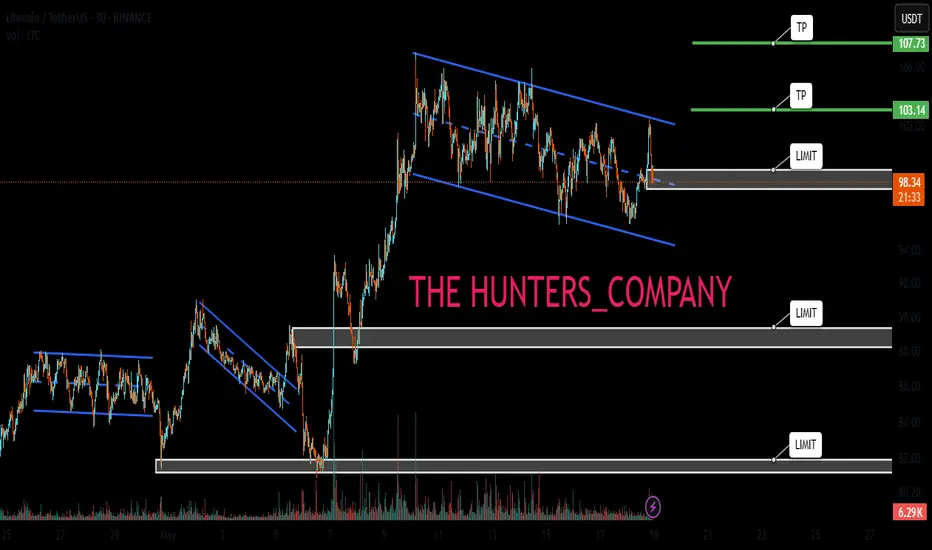
Litecoin (LTC): Seeing Strong Upside Potential | Bullish TradeLitecoin caught our attention with a nice breakout and buy-side volume dominance, where we are seeing 2 good trades that can be taken, both with a decent R:R ratio.
More in-depth info is in the video—enjoy!
Swallow Academy

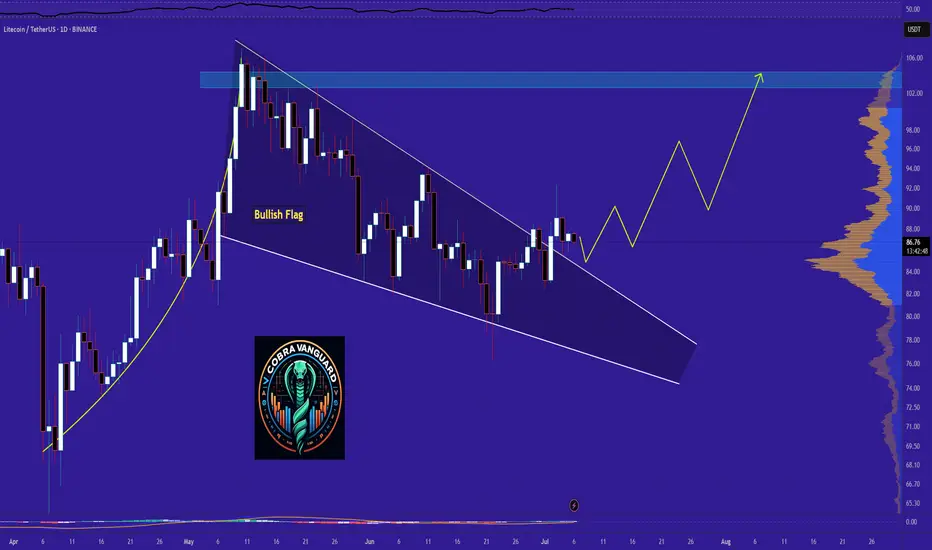
Litecoin (LTC): Really Good Buying Opportunity For July 2025 Litecoin has a really good chance to explode anytime now. We noticed a decent uptrend forming so what we are looking for is a break of that trend and full-scale upward movement!
More in-depth info is in the video—enjoy!
Swallow Academy

LTCLitecoin
An open source decentralised digital currency that enables fast and borderless transactions.
Everything is clear on the chart.
I wish everyone abundant profits.
Like and follow
for more.

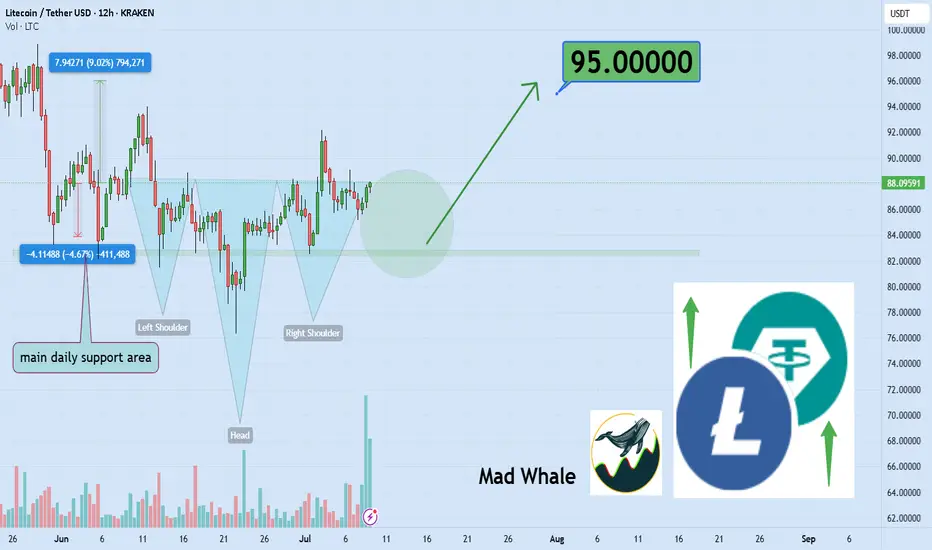
LTCUSDThe LTC/USDT pair currently trades at $74.77, positioning itself for notable bullish movements across various timeframes. In the near term, price targets are set around $90.00, reflecting immediate upside potential supported by strong technical signals and market dynamics.
Looking ahead to the medi

Litecoin: Major Expansion or Still Too Early?Price Action & Key Zones
Litecoin COINBASE:LTCUSD BINANCE:LTCUSDT continues to move within a multi-year consolidation range. The monthly chart clearly shows the range that has held since 2022. Key levels to watch:
Resistance at 145–150 USD — a key seller zone that has repeatedly acted

LITCOIN : So what is an ETF ?Hello friends
Be careful with the recent fluctuations of this coin because the movements of this coin have become unpredictable and we suggest that if you want to buy, buy in the specified support areas and in steps, of course with capital and risk management...
We have also specified targets for
LTC - Time to buy again! (Update)Finally, this pattern was broken and had a positive impact, leading to significant growth. Now, with a slight price correction, higher price levels can be reached.
PREVIOUS ANALYSIS
Best regards CobraVanguard.💚
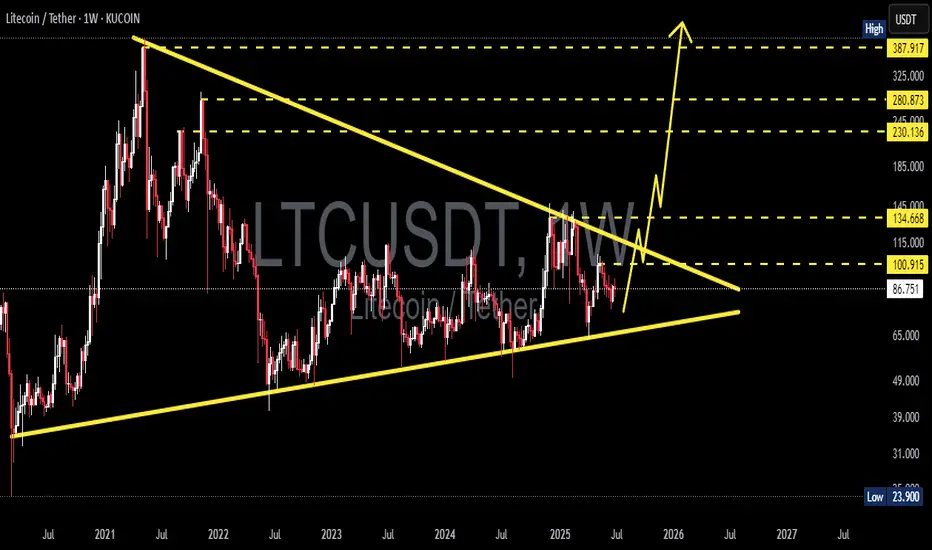
LTC/USDT Weekly – Massive Breakout Loading? 3-Year Triangle
📌 Litecoin is now standing at one of its most crucial technical levels since the 2021 bull run. After 3 years of compression inside a massive symmetrical triangle, price action is nearing a major breakout point. Will LTC finally explode upward, or are bears still in control? Let’s break it down!
🧠
LTC, he Hidden Strength Beneath the Retrace Ma dudes, we might just be witnessing something big and beautiful here. 🤌✨
Okay okay, I might sound like a total degen, but hear me out:
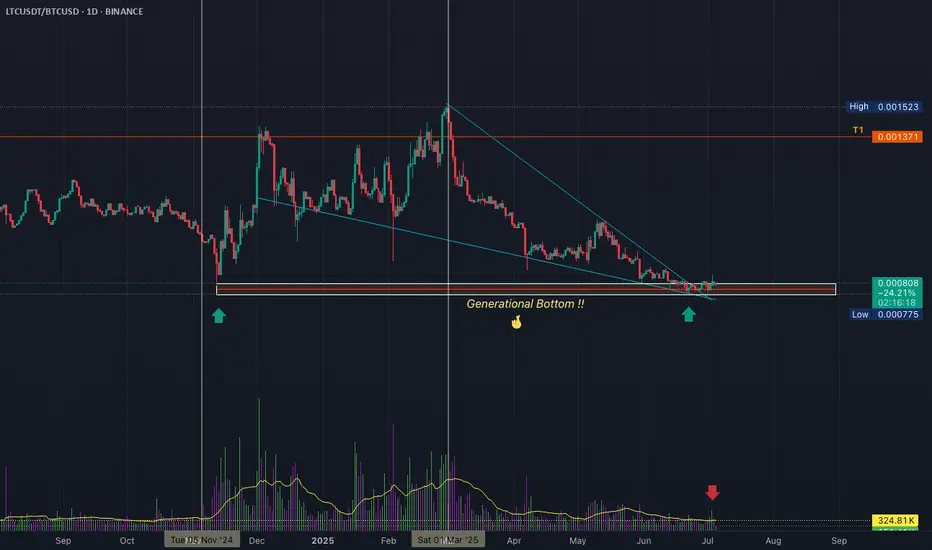
✅ Double bottom (check those two green arrows)
✅ Bullish divergence on the RSI
✅ MACD on the monthly just crossed bullish — for the first time ever on this pair!
See all ideas
Summarizing what the indicators are suggesting.
Oscillators
Neutral
SellBuy
Strong sellStrong buy
Strong sellSellNeutralBuyStrong buy
Oscillators
Neutral
SellBuy
Strong sellStrong buy
Strong sellSellNeutralBuyStrong buy
Summary
Neutral
SellBuy
Strong sellStrong buy
Strong sellSellNeutralBuyStrong buy
Summary
Neutral
SellBuy
Strong sellStrong buy
Strong sellSellNeutralBuyStrong buy
Summary
Neutral
SellBuy
Strong sellStrong buy
Strong sellSellNeutralBuyStrong buy
Moving Averages
Neutral
SellBuy
Strong sellStrong buy
Strong sellSellNeutralBuyStrong buy
Moving Averages
Neutral
SellBuy
Strong sellStrong buy
Strong sellSellNeutralBuyStrong buy
Displays a symbol's price movements over previous years to identify recurring trends.