✴️ Litecoin | Great EntryWe just experienced the strongest correction/bearish action since the bear market, before June 2022... This can be good.
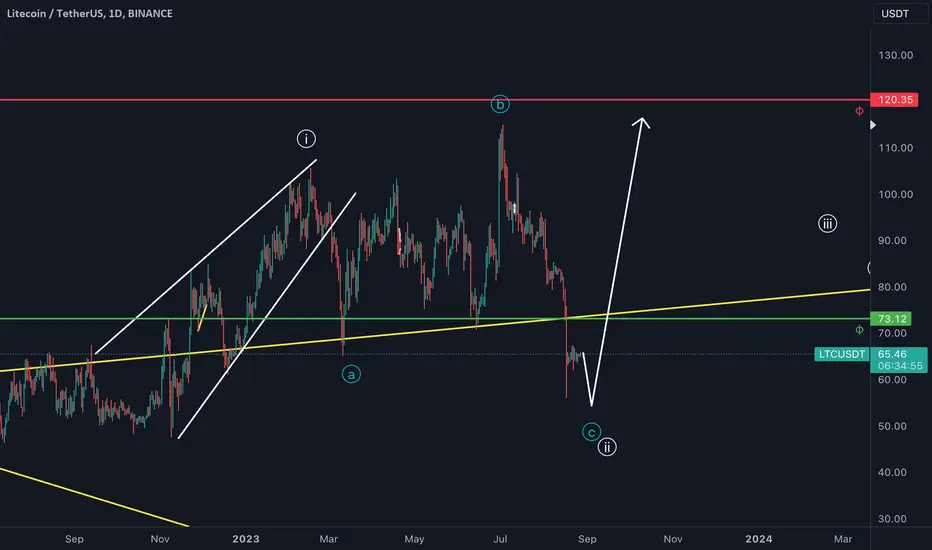
We are looking at Litecoin (LTCUSDT) on the weekly timeframe.
Bear-market bottom low June 2022.
A strong bullish wave, peaks July 2023, more than a year after the low.
Strongest correction in more than a year follows with 7 weeks dropping, the last week strong, full red.
The week that follows is a Doji and closes green.
This week is green again.
The drop stopped before hitting the 0.786 Fib. retracement level relative to the entire bullish wave (from June 2022 through present time).
And so, this can be a great entry.
I am no longer sharing the full numbers with leverage as I did earlier this year but I personally would go long here.
A major correction ending can lead to a change of trend.
Taking into consideration the halving, this change can be for the long-term.
A good entry now can into something really big, it can be great.
This is not financial advice.
Do your own research.
Be smart, be patient; Opportunities are endless... If you miss one, another one will come and take its place.
When one door closes, millions of new doors open.
Look at the stars.
Enjoy the sun and the full moon.
Thank you for reading.
Enough for today.
Namaste.
LTCUSDT.P trade ideas
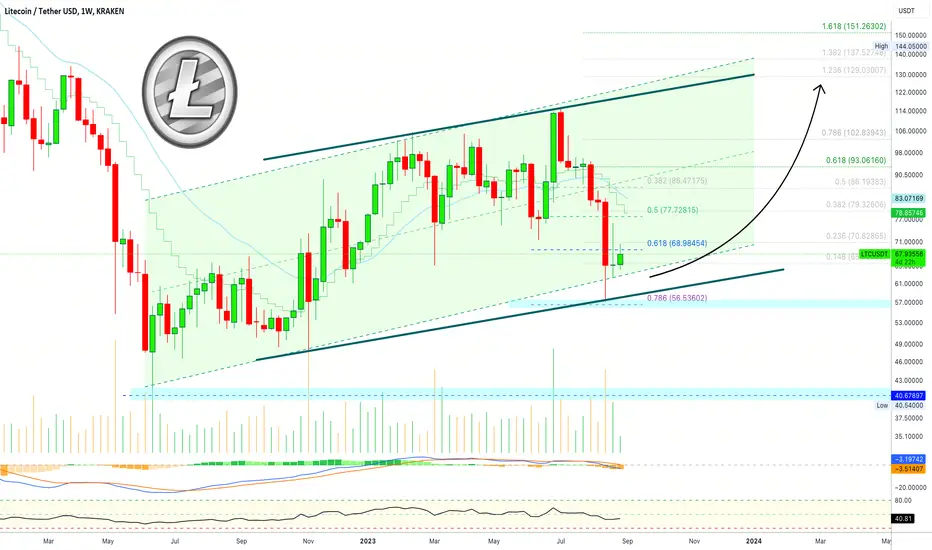
LTC USDT LONG BINANCELTC - NEXT MOVE ?
LTC stoped on fib. I think this point good for long position !
Target:
100 ;
140 ;
Litecoin shortLitecoin bounced off the upper boundary of horizontal channel. Bearish movement to support level 64.35 is expected to happen.

long position opened in LTCtime to make some green candles for LTC and i am gonn scalp it at 20x leverage with aims on 10% first target, 20% second target and 30% around 83 usdt, for educational pourposes only, good luck
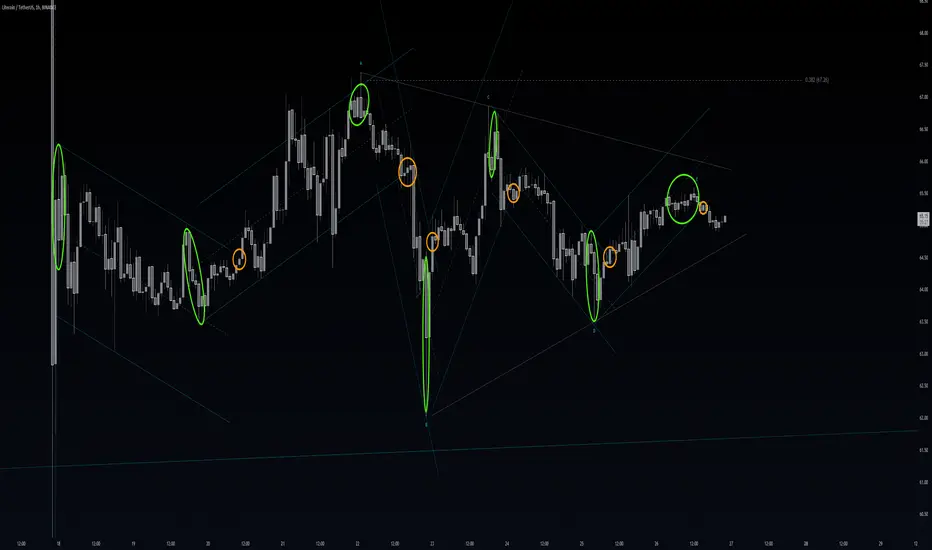
LTCUSDT 1H Binancelet me know in the comment, where the price is about to move next.
theres always a spring after winter.
all what you need is in front of you.
PS. this maybe the last publishing from my side for free.
hit a boost if you smart enough.
peace!
LTCUSDT ANALYSIS 26TH AUGUST 2023Lctusdt has form a support and according to my prediction is likely to move up and going for long is needed on 1 hour timeframe.

#LTC when to Short?LTC dumped pretty much after Halving.
Currently its in the range.
We may expect some bounce from current price level. But will it reach the resistance levels (red lines) that I mentioned on the chart - big question.
Anyways here are possible scenarios:
1. LTC bounces until 73$ where it faces W FVG where we may expect bear reaction. In this case possibility to 46$ support level increases
2. LTC breaks through 73$ resistance and comes to another resistance at 82 - 86$ and eather we see bears reaction is can be bearish divergence on LTF or bearish candles. And in this case coin may go lower back to 73$ which will stand as support.
3. LTC breaks below 73$ support and it may lead the coin back to 50 - 60$
4. LTC breaks above 86$ resistance, would be nice to see retest of that level and in this case the coin may go higher.

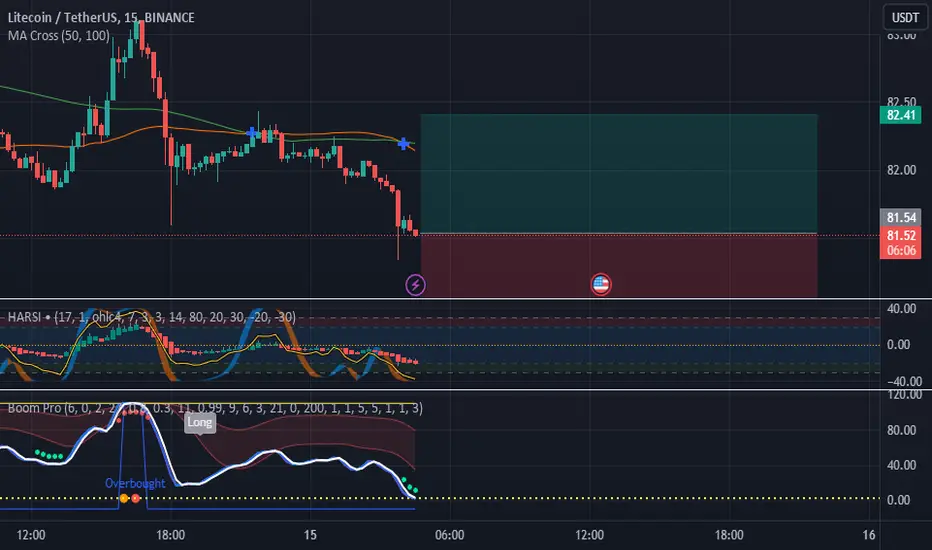
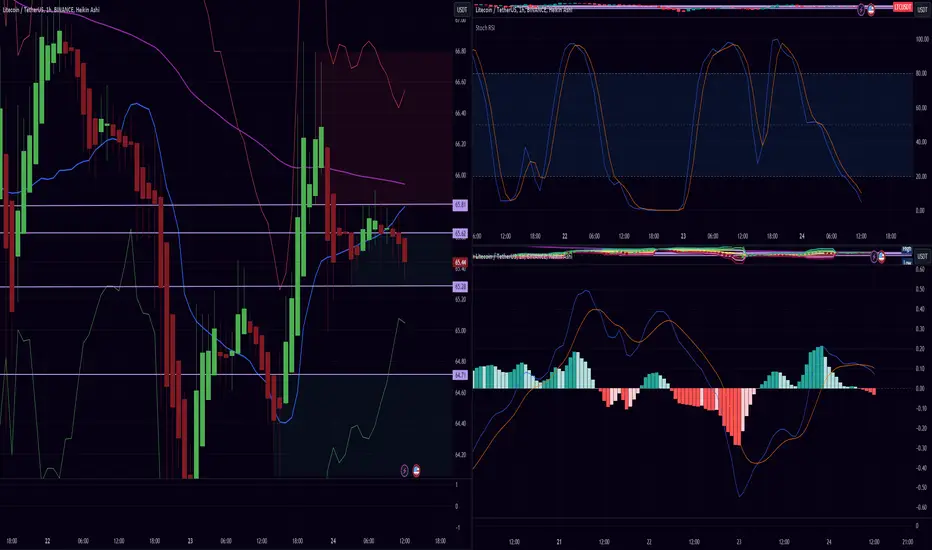
LTC/USDT Technical Analysis 1HThe LTC/USDT pair, based on the provided indicators, appears to be in a moment of indecision with a slight bearish slope. However, the price above the 50-period SMA and the RSI indicate that there is still no clear long-term direction.
The price is currently at 65.45 USDT with a trading volume of 47.56 LTC. At first glance, this volume appears to be relatively low, which could indicate a period of consolidation or a lack of clear decision by traders.
RSI(14): The RSI is at 49.15, almost in the middle of the 0 to 100 range. This indicates that the market is clearly not in an overbought or oversold zone and shows neutrality at the moment. periods indicates a medium-term upward trend.
Supports and resistances follow
Main support levels : 65.28 / 64.21
Main Resistance Levels: 65.62 / 65.81
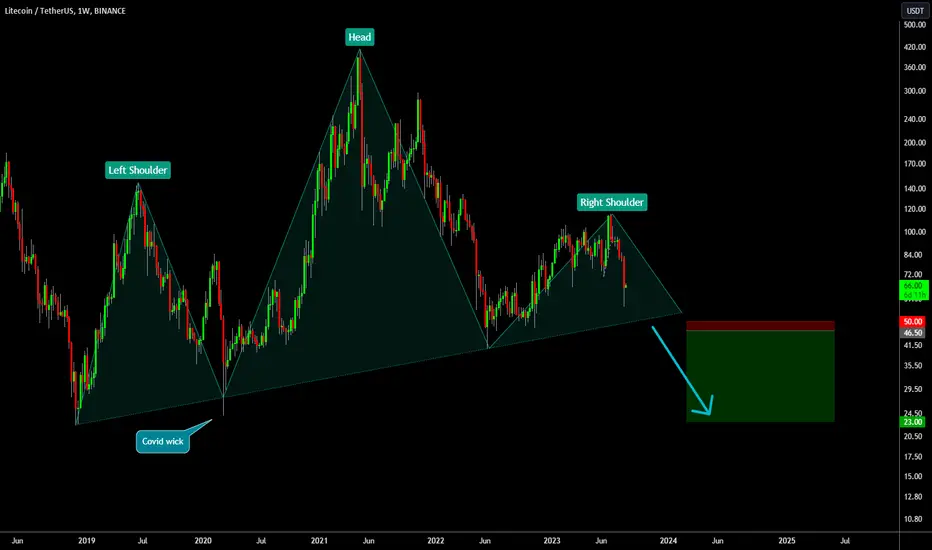
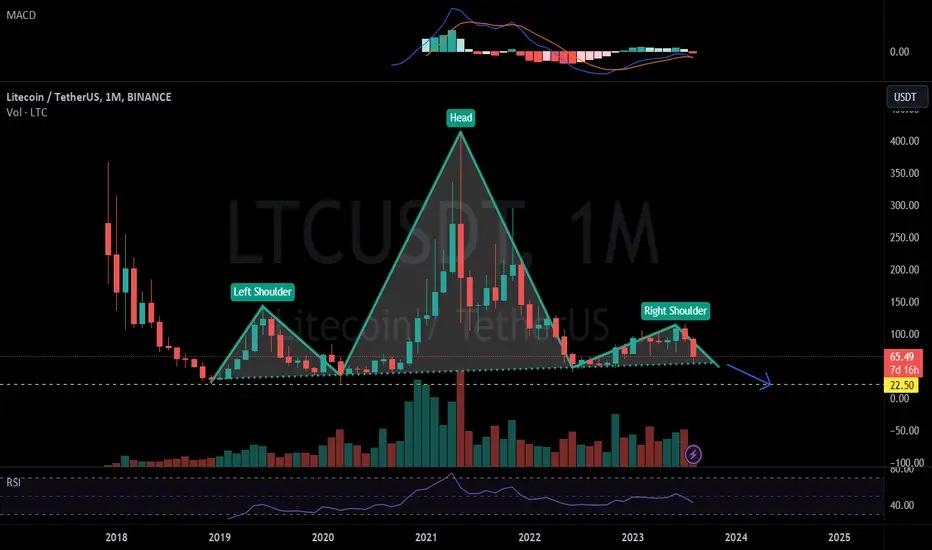
LTCUSDT 1MDid you see that? Yes massive Head & Shoulder pattern on weekly and monthly chart! Waiting for breaking the neckline to confirm the pattern. After then target would be $22.50 which means Dec 2018 low
Ltc sideways #ltc will stay in black line for next days. It will consolidate in 60-75 range. A retest to upper black trendline is pending.
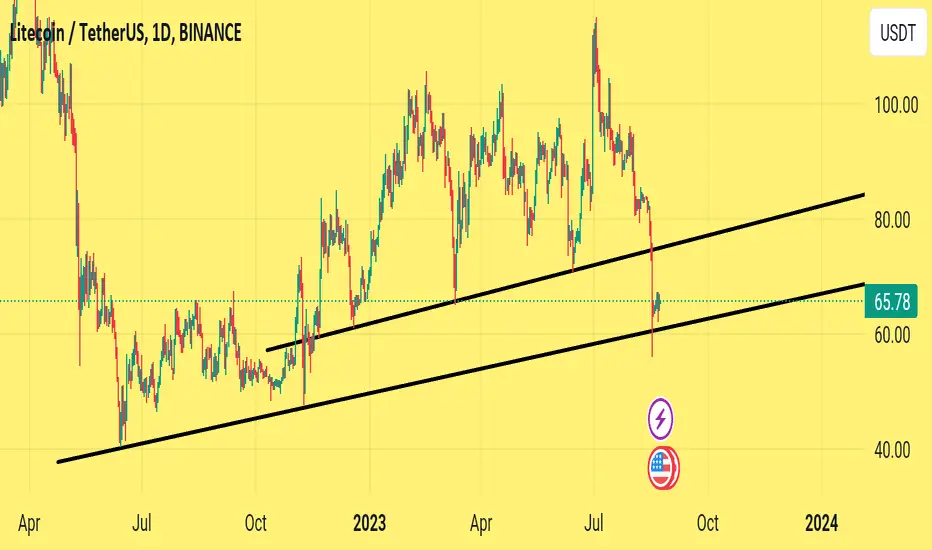
✴️ Litecoin | One Final Crash Post Halving? Doom!Have You Gone Bearish? Not So Fast...
Here we can clearly see the rising trendline/ascending channel being broken and now the possibilities are for one last major surprise before anything is clear, and clear for us mean the bullish trend being well defined again.
Now, will this event crash prices below the long-term, June 2022 bottom low?
It is hard to say and it will depend on how much fear spreads across the market.
As I explained in another trade idea, the surprise event can be positive or negative, because things don't necessarily need to be bad.
But if it is negative, something like new Covid restrictions or a nuclear bomb going off, then the shakeout can be really, really strong.
If it is positive, something like the SEC being told to drop one of its lawsuits, a war coming to an end; this is what will decide how the market will react in just 5 days.
Market your calendars for 28-August (late August).
While Litecoin went through the halving, it would be natural to see a major flush before years of sustained growth.
All the longs gets liquidated, weak hands remove and then the market grows... This is just speculation of course, but thats just how the market works.
I am staying out in a wait and see mode.
Better to be safe than sorry, money saved is money won.
Namaste.

#LTCUSDT #LQR #TOBTC #LaqiraProtocolThe price is making a decision after a fall. In certain Levels. you can open a trade after confirming and matching the bitcoin levels. This analysis is not an offer to buy or sell


LTC/USDT 4H Interval ReviewHello everyone, I invite you to review the LTC chart on the four-hour interval. As we can see, the price is moving below the main downtrend line, while locally we can see that the price is moving sideways from the local downtrend line.
Let's start by marking the price support points and we see that we first have strong support at $53.39, but if the price goes lower then we have another support at $44.74 and then a strong support zone from $37 to $31 $.
Looking the other way, we can similarly determine the places of resistance that the price has to face. And here we see that the price is currently fighting resistance at $66.59. There is still resistance at $72.97, once price breaks it it will move towards resistance at $78.28, and then it has to break through the strong resistance zone from $83 to $91.
The CHOP index indicates that there is a lot of energy for the upcoming move, on the RSI we see an increase towards the middle of the range despite very little price movement, while the STOCH indicator is moving in the upper part of the range, which may affect the price drop in the coming hours.

🔥 Litecoin Huge 5-Year Head & Shoulders: Prepare For Dump 🚨Recently I've made some analyses on LTC and its halving. In every analysis I compared LTC's post-halving price action in history and came to the conclusion that the LTC halving is a sell the news event, see below. For the foreseeable future I'm quite bearish on LTC, but even more bearish on the LTC/BTC pair - it will lose value against BTC.
I'm waiting for LTC to break below the neck-line of the H&S pattern. Target at the 2018 lows, stop around 50$. Be patient for the break out.