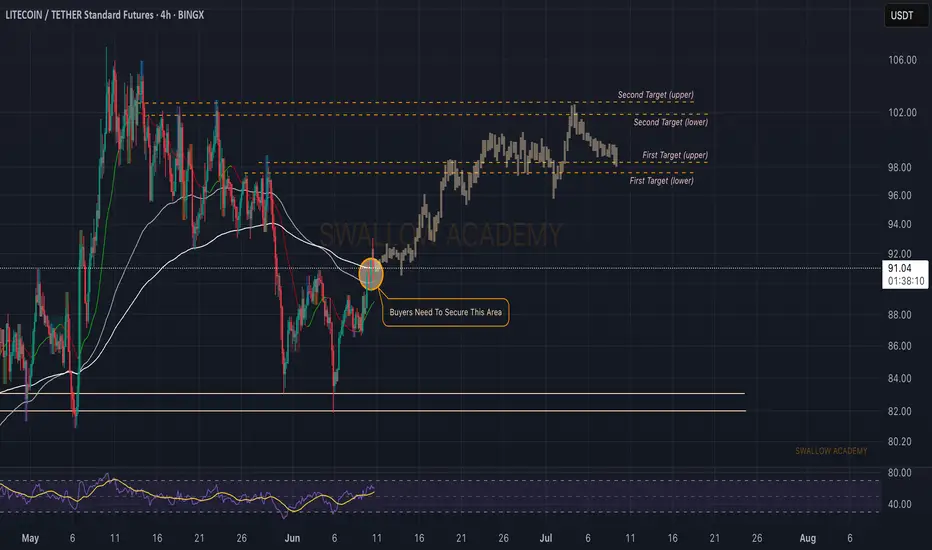
Litecoin (LTC): Looking for Breakout + Targets to be ReachedLitecoin has done very well recently, where the current price is testing the branch of EMAs, where we are expecting to see a breakout, after which we will be looking for upward movement toward our first and second targets.
Swallowa Acaademy
LTC: Long 15/06/25BINANCE:LTCUSD.P
Trade Direction:
LTC Long
Risk Management:
- Risk halved as weekend
- Risk is 0.5%
- Stop loss placed below recent swing low / invalidation level
Reason for Entry:
- H1 bullish divergence teasing. Not yet confirmed but I received a alert for its potential formation
- Trendline

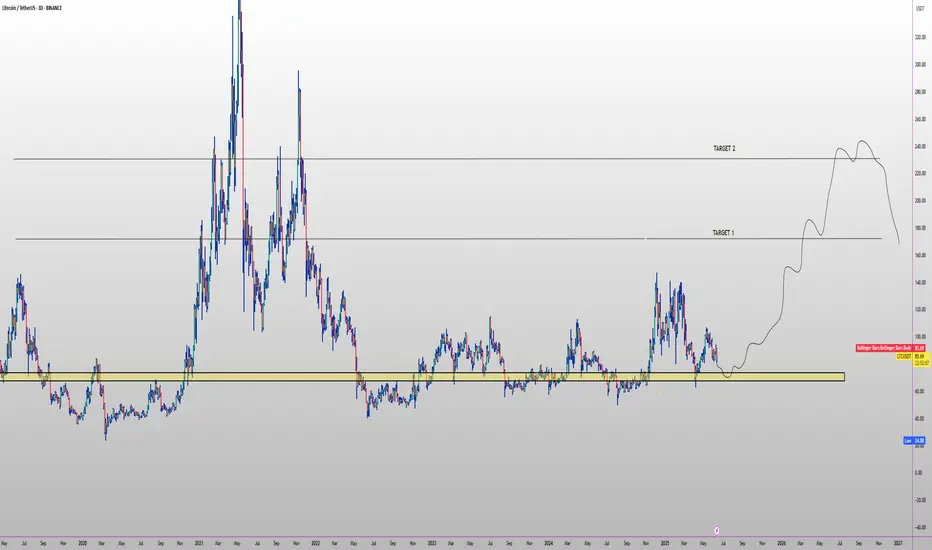
LTC TARGETS FOR Q3🔥 CRYPTOCAP:LTC swing setup (3D) 🚀
✅ Entry Zone: $70 – $77 (multi-year demand)
🎯 Targets
• TP-1: $180 (2021 breakdown line)
• TP-2: $240 (2020-21 pivot)
⛔ Stop-Loss
3-day close < $66
📊 Thesis
• #1 payment coin on BitPay in 2024-25 (201 K tx > BTC & ETH)
• Active addresses +28 % YoY; reco
Litecoin —It's All In Your Mind, Time To DecideTruly the longest consolidation phase has been experienced, since June 2022 until June 2025. This consolidation produced a broad channel for Litecoin but, make no mistake, this is a trading range.
The difference between a rising channel where consolidation is happening and a very strong bull market

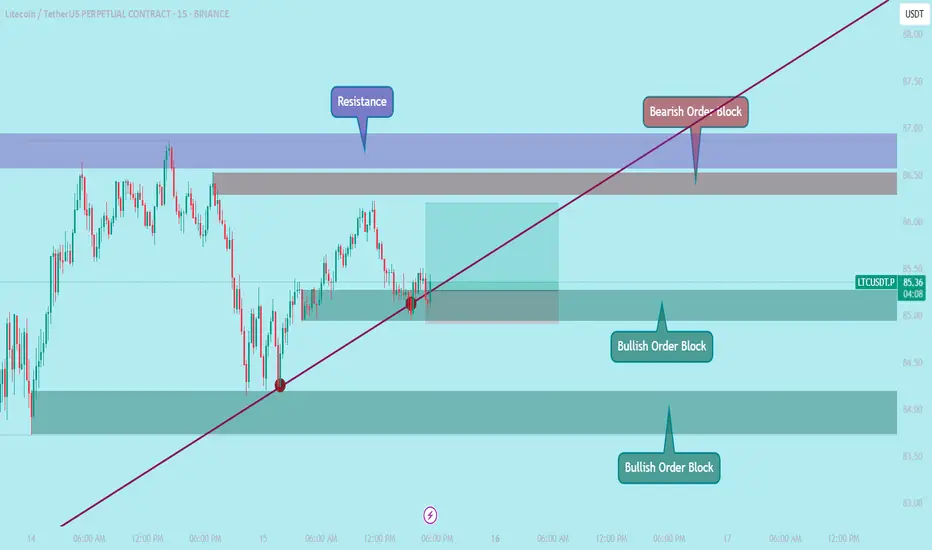
LTCUSDT / 15M / BUY🔹 Entry: 85.28 (Market Execution)
🎯 Target (TP): 86.20
🛑 Stop Loss (SL): 84.91
📊 Risk-Reward Ratio (RRR): ~1:2.49
Took this trade based on a clean confluence of Smart Money Concepts (SMC) and Price Action.
Price respected the bullish order block and trendline support on the 15M chart — signs of st
Litecoin (LTC): Looking Bad Now, But Has Good Potential Litecoin is in bad shape, where sellers are showing pressure, which could lead to bigger downward movement.
Despite that, we are still above the local neckline area, so we are still bullish, for now!
More in-depth info is in the video—enjoy!
Swallow Academy

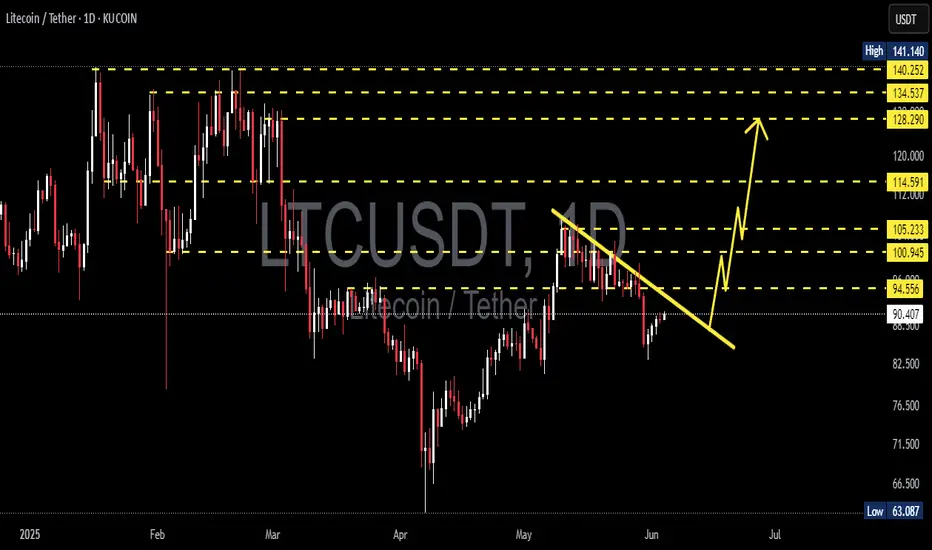
LTCUSDT 1D AnalysisLTC ~ 1D Analysis
#LTC Buy after successfully breaking this resistance line with a short term target of at least 10%+ from here.
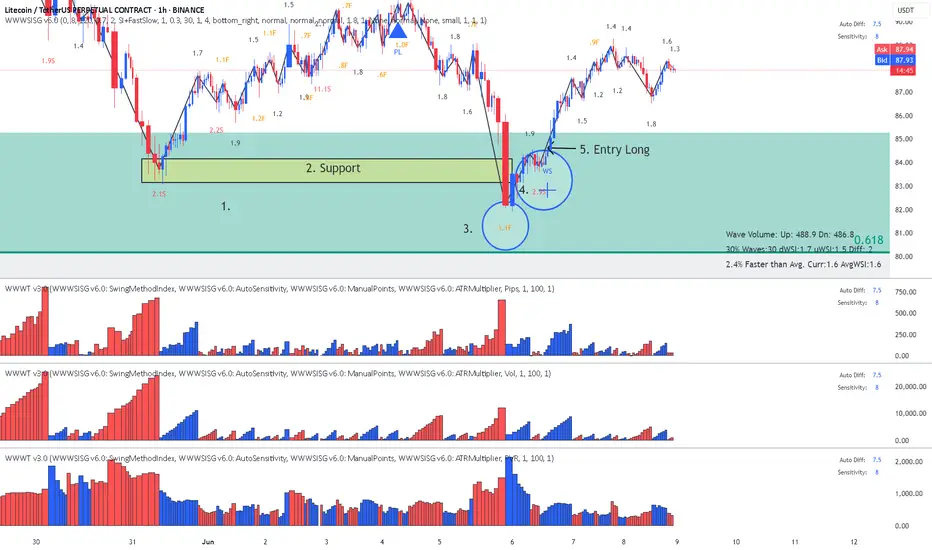
LTC - This is how a Wyckoff Spring look like when reading SI Reading the chart: Location, Structure, Speed Index and Plutus signals
Annotations in sync with the chart.
1. Major Fib
2. Support
3. Breaking Support with a false break - Fast wave = low Speed Index 1.1
4. Down wave, price has a hard time to move down = high Speed Index 2.9 (buyers absorbing sell
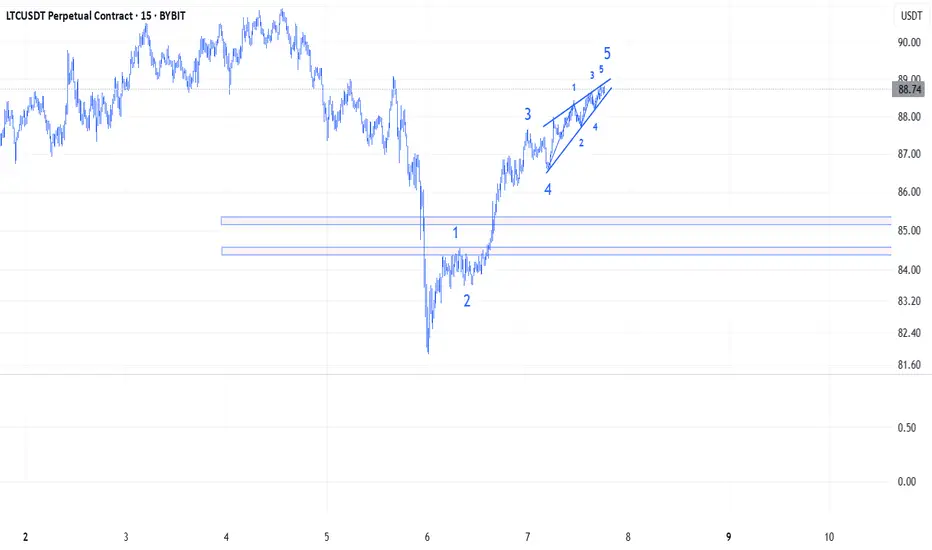
LTC/USDT Elliott WavesTrade will be activated if price breakes through wave 4 of the ending diagonal(88.19) with 1st target 85.33 and 2nd target 84.55.Until then,just waiting.
LTC/USDT Heist Alert: Bullish Loot Before the Trap! 🚨 LTC/USDT HEIST ALERT: Quick Bullish Raid Before the Trap! (Thief Trading Plan) 🚨
🌟 Greetings, Market Robbers! 🌟
Hola! Ola! Bonjour! Hallo! Marhaba! 🤑💰💸
🔥 Thief Trading Analysis signals a bullish LTC/USDT heist opportunity! Our plan? Enter long, escape near high-risk zones before bears ambush weak

See all ideas
Summarizing what the indicators are suggesting.
Oscillators
Neutral
SellBuy
Strong sellStrong buy
Strong sellSellNeutralBuyStrong buy
Oscillators
Neutral
SellBuy
Strong sellStrong buy
Strong sellSellNeutralBuyStrong buy
Summary
Neutral
SellBuy
Strong sellStrong buy
Strong sellSellNeutralBuyStrong buy
Summary
Neutral
SellBuy
Strong sellStrong buy
Strong sellSellNeutralBuyStrong buy
Summary
Neutral
SellBuy
Strong sellStrong buy
Strong sellSellNeutralBuyStrong buy
Moving Averages
Neutral
SellBuy
Strong sellStrong buy
Strong sellSellNeutralBuyStrong buy
Moving Averages
Neutral
SellBuy
Strong sellStrong buy
Strong sellSellNeutralBuyStrong buy
Displays a symbol's price movements over previous years to identify recurring trends.