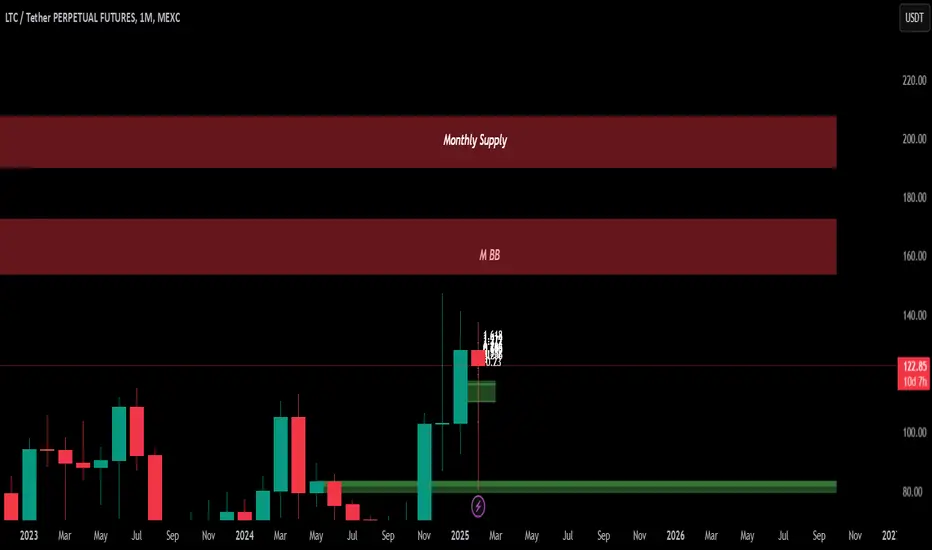
LTC short short ltc at 154 as there is a monthly BB, and stop loss is just above the BB at 174 $ if the price closes abvove it then wait for a pull back into that area to look for long opportunities
LTCUSDT trade ideas
LTC h chart analysis breakout guys LTC has almost finish his correction can lead to back previous top
targets are clear in chart long term target are much mush higher
enjoy the trade support my idea like and comment to reach more community
cheers
LTC about to Jump the CreekShown here is LTC on the 12 hour time frame. It is in a symmetrical triangle pattern, which typiclaly is an indecisive pattern. However, the recent dip and strong bounce up is indicative of the Wycoff Spring Setup. Instead of a Range Break Fake-Out to the downside, the Wyckoff Spring is a more like a Range Break Fake-Out to the Upisde.
The very high volume that took place on 4 February 2025, means that a 2nd minor dip is likely to occur, and I predict that the little dip taking place today on 18 Feb 0700 UTC, is that 2nd dip, or retest.
I expect some sideways movement for the next half day to day and then a major breakout to the upside after the price action decivivley breaks through the resistance level of the symmetrical triangle. This decive break above resitance is often referred to as "Jump the Creek".

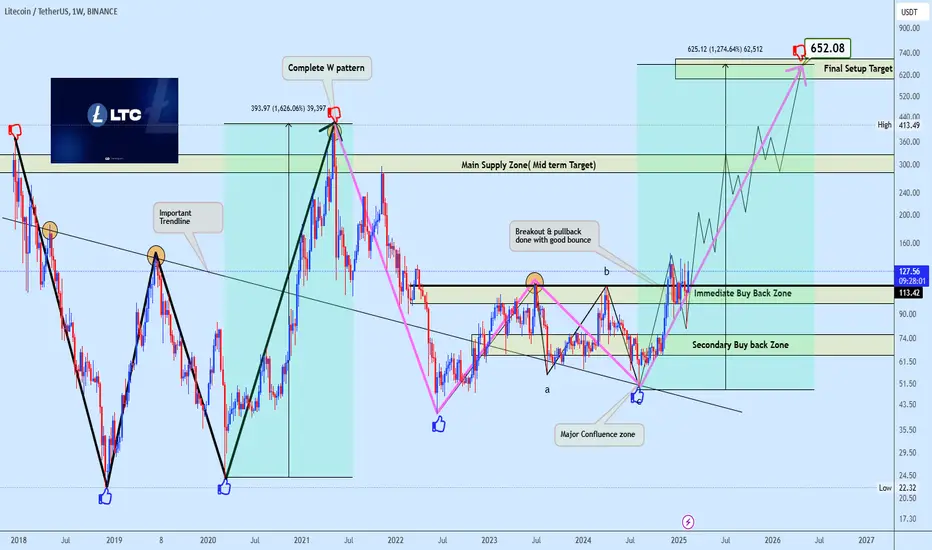
LTCUSDT buy opportunityLTC/USDT has been forming a macro reversal structure, completing a well-defined W-pattern, signaling a shift in momentum. Price successfully broke through the long-standing trendline resistance, followed by a strong retest and a bullish continuation, confirming market strength.
The immediate buy-back zone serves as a key accumulation area, aligning with structural confluence and previous demand zones, ensuring a solid base for continuation with secondary buy back been provided if the earlier zone fail to hold.
The breakout from the corrective structure wave abc reinforces the bullish outlook, with price exhibiting impulsive characteristics that align with an Wave structure, suggesting a sustained move toward higher levels.
Liquidity absorption within key supply zones has fueled a breakout, targeting the $652.08 level. The mid-term supply area remains a key reaction point, where temporary pullbacks may occur.
However, sustained momentum above this zone supports further price discovery. The combination of liquidity flow, structural confirmation, and the overall bullish trend increases the likelihood of an extended rally following the projected path.
LTC BUY Trade BTC | TRUMP | XRPBuy area around 115 if BTC dont dump more
stoploss below 109
no leverage trade
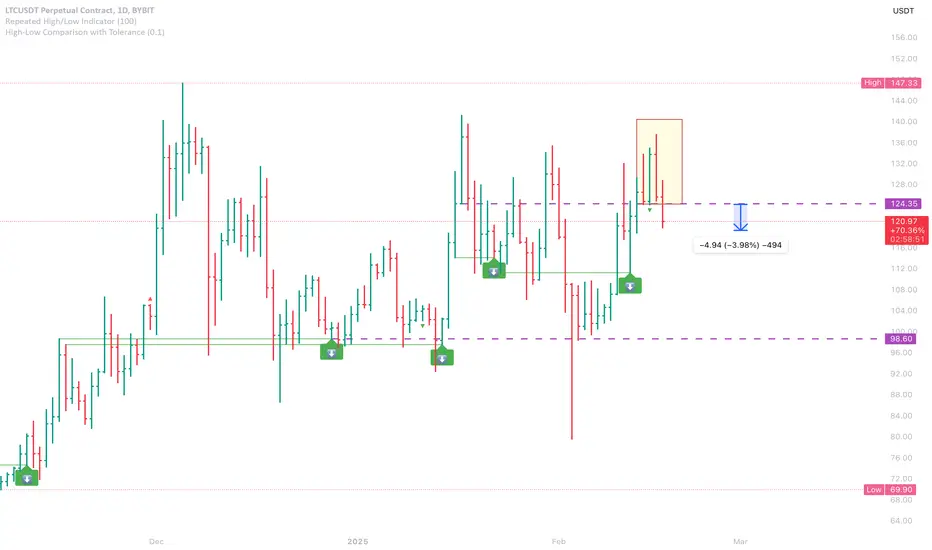
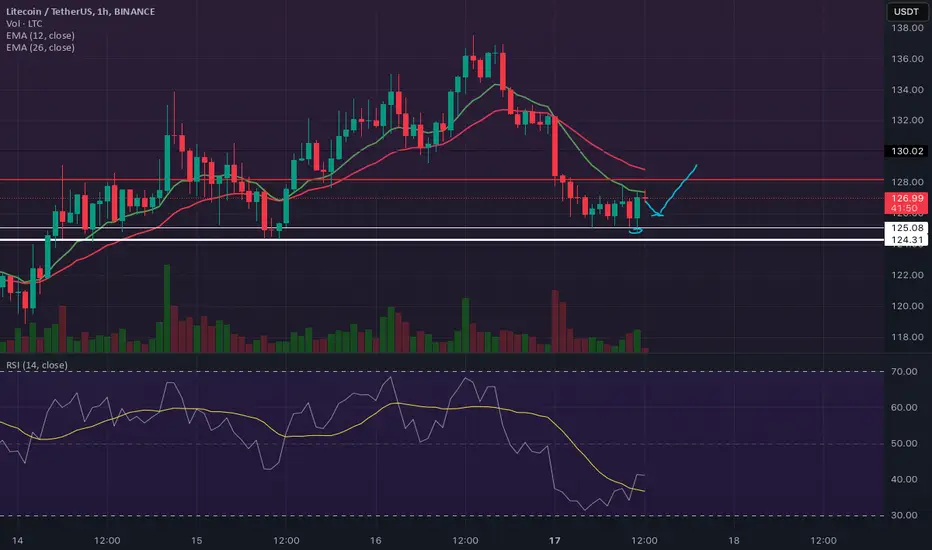
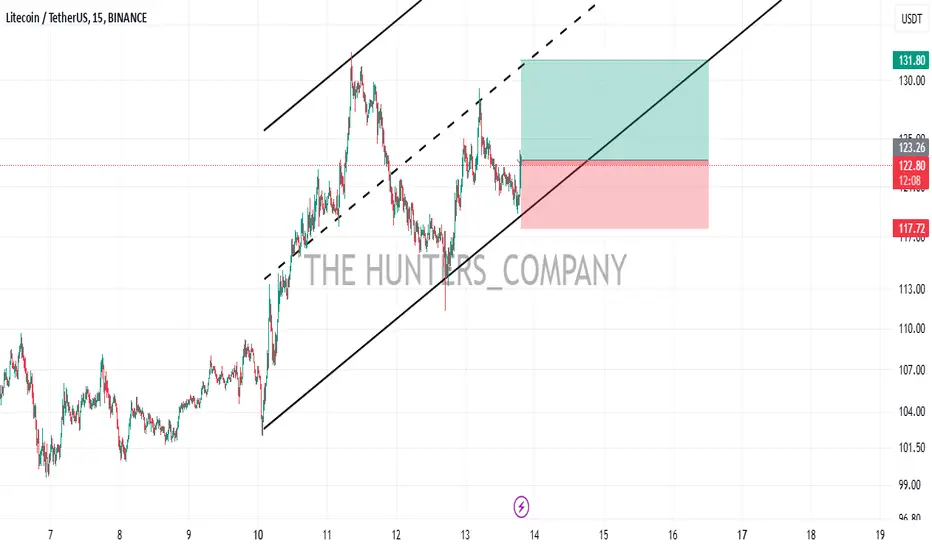
LTCUSDT 12 Hour Higher Low. Great risk:reward setupLTC is still holding it's bullish structure, forming a possible 12 hour higher low compared to the last 12 hour low at $124.3 (thick white line). Price also recently took out the previous hourly lows (thin white line) as outlined by the circle. I'm waiting for price to pullback as shown toward $125 - 126 and hopefully starts to bounce from there for some continuation. Very low risk trade as my stop will go under $124.5, and if the 12 hour higher low forms, you can get plenty of upside. LTCBTC also had its first bullish cross between the 12 and 26 eta's in almost 2.5 years. Could be a precursor signal for LTC to bounce strong in the upcoming weeks.
LTC Choch 2.16.25bullish retest complete at the 1.618 trend line. Bull divs up to 6m. orange ball at 15m incoming.
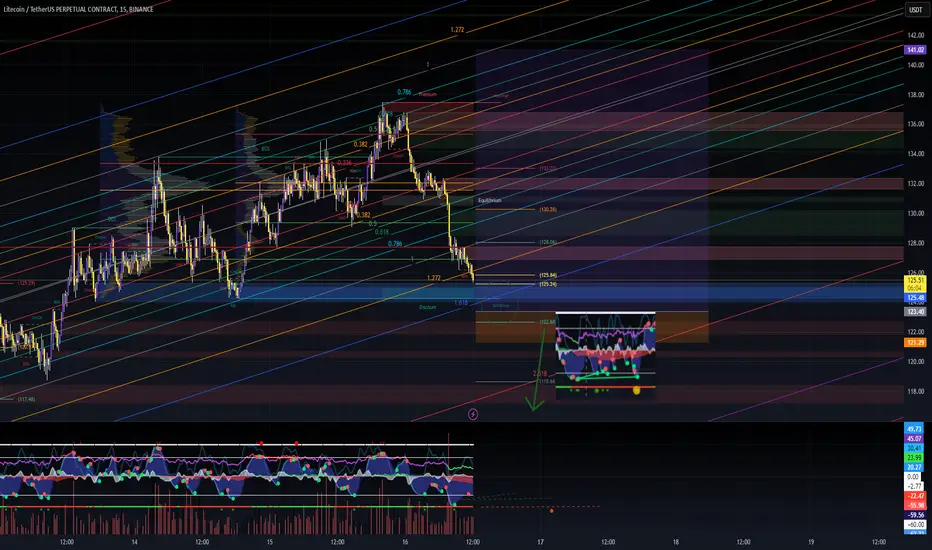
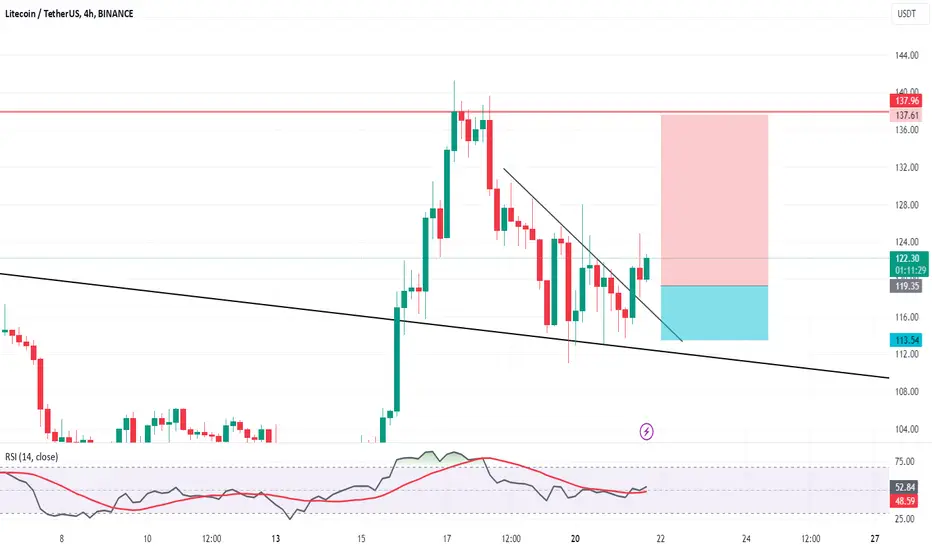
LTCBeraish divergence going on on the RSI
therefore we can plot 2 high probbale scenarios, a huge dunmp or conitinue correction phase
thats all I can take from LTC,nothing much going on here
SL please
good luck
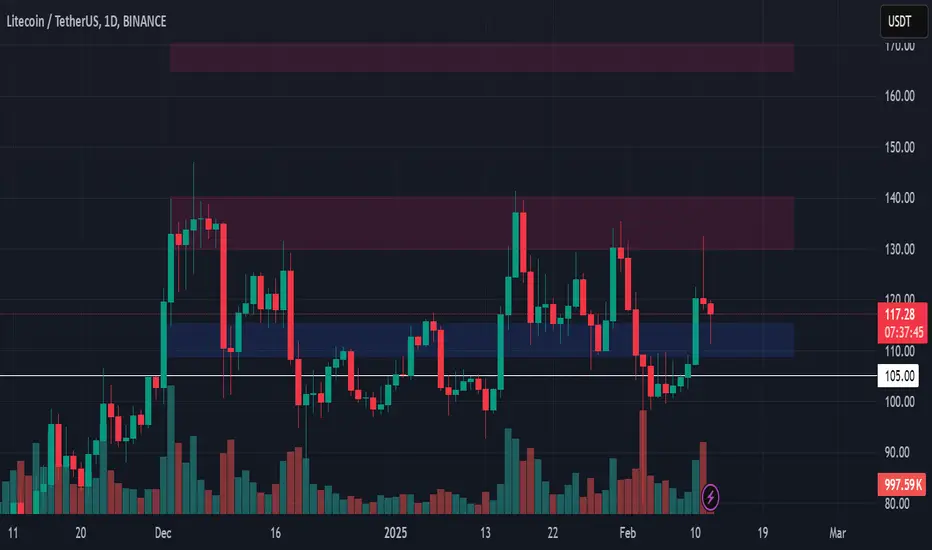
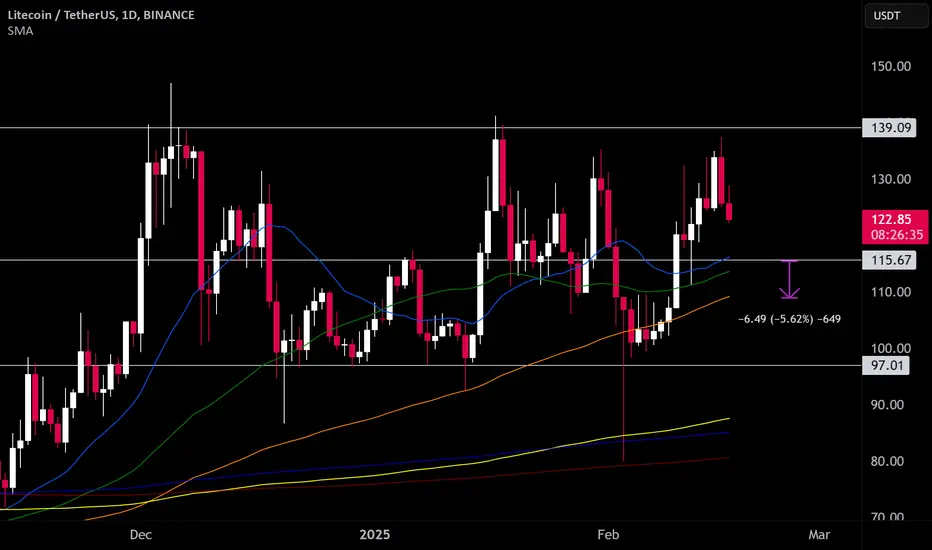
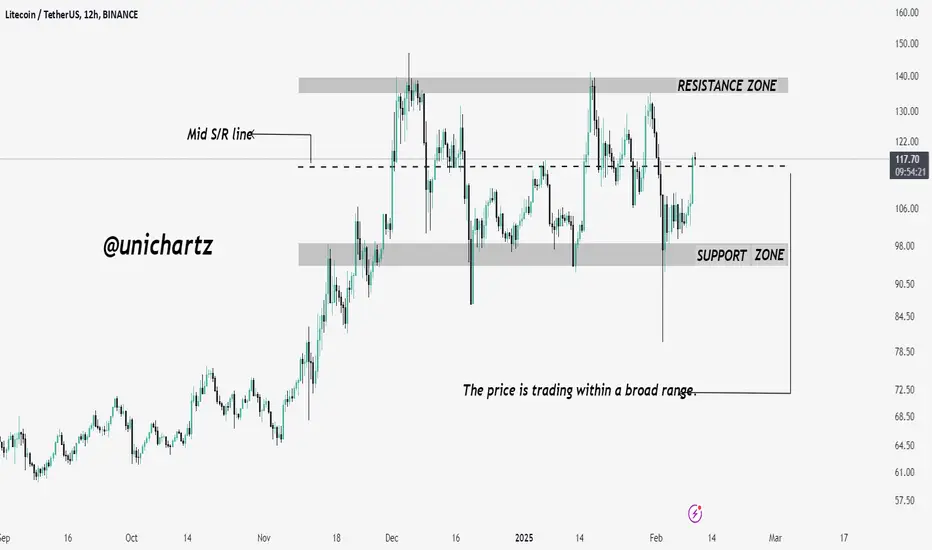
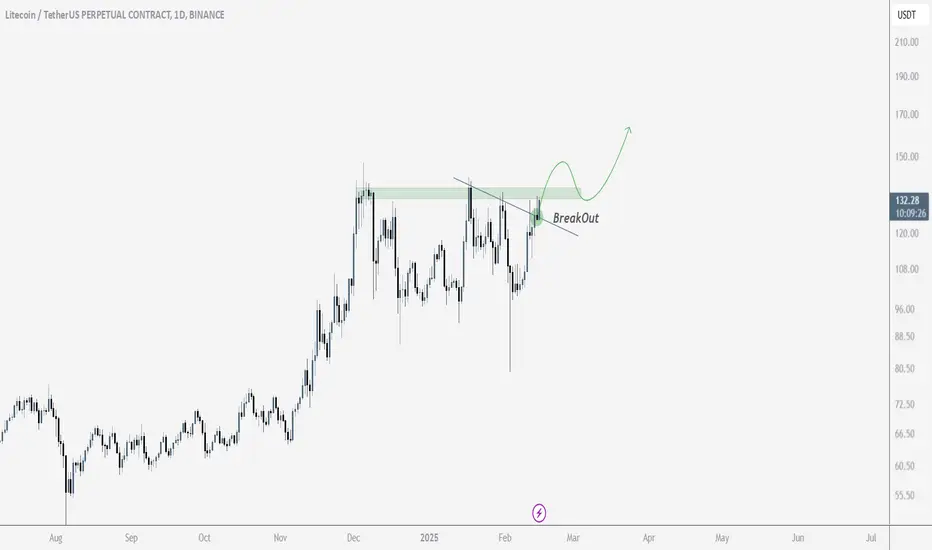
LTC Aims for $140 After Mid S/R BreakoutPrice is trading within a broad range between the $98 support and $140 resistance. After breaking out of the mid S/R line around $115, the price could now move toward the $140 target.
A breakout above $140 may trigger a strong bullish rally, while a drop below $98 signals bearish risks. Watch for volume confirmation!
Litecoin Easy Above $200, $300 & $400 Mid-2025 —The New BullLast week Litecoin produced a very strong bullish signal in the form of a hammer candlestick pattern.
This signal is quite revealing. The long lower wick of the candle reached below the 16-Dec. 2024 low and yet closed much higher. This close happened above the 1-April 2024 session open and close. Revealing that a market flush was successfully completed.
The action this week is even more revealing and works as confirmation. A very strong bullish candle, full green, trading higher on the session body than all previous weeks since the last peak in early December.
The most revealing signal as well as supportive of a new bullish wave developing now, is the high volume. This week is producing the highest volume ever on this exchange.
Currently, LTCUSDT sits at $131. I can see easily prices above $200, $300 and even $400 but this wouldn't be equal to the All-Time High. The end price for this bullish cycle can end much higher. Try searching for LTCUSDT in my profile for additional information on this part, or wait for a new publication where the focus will be the 2025 All-Time High.
A session close this week above $121, tomorrow, confirms a very strong reversal of the recent correction dynamics as well as the resumption of the bullish trend. The latest bullish trend started with the low in early August 2025.
It seems Litecoin will be one of the known projects to move early and with force in this cycle. Maybe a good option to add to a highly diversified portfolio. This pair can also hold big capital and has stability. It has been proven trustworthy based on its longevity. A point that can be relevant to whale holders, investors and traders.
The low is in. The correction is over.
Right now it is the time for sustained growth.
The anticipation is amazing. We are ready. We are ready. How good can it get?
How high can the market really grow?
Are we seeing the start of a break of a major pattern? The four years cycle.
Will Crypto enter its first ever 10 years long bull-market? It is too early to say.
I can say for sure that 2025 will bring us tons of growth, tons of innovation, lots of improvements, a change in the fundamentals and regulations that rule the market. Cryptocurrency is now legal. Cryptocurrency is here to stay.
Thanks a lot for your continued support.
Remember, you will always deserve the best.
Namaste.
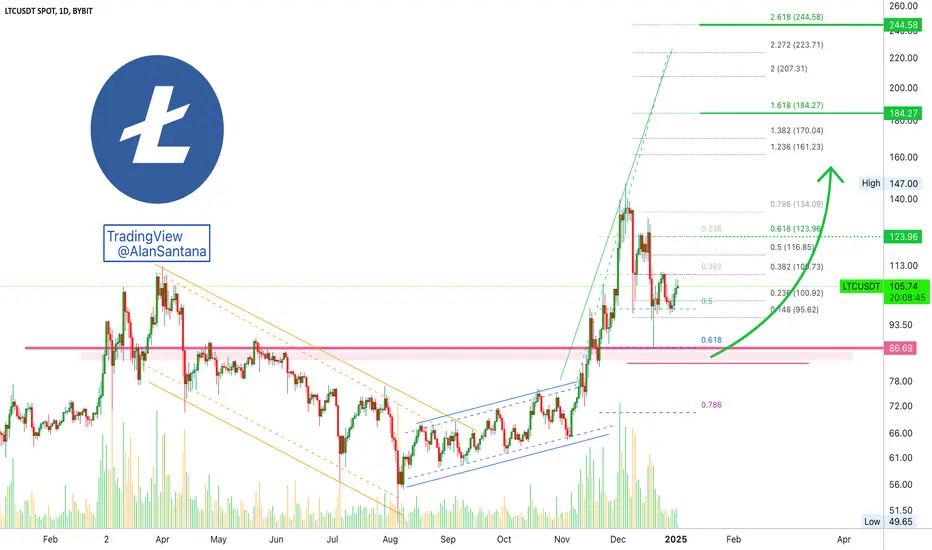
Litecoin: Another Bullish Wave, Or Same?Can we say this is a new bullish wave, or is it the same? It is definitely the same bullish wave that started in late November with a bottom in August 2024.
This bullish wave saw a 40% correction in 2 weeks time which activated the 0.618 Fib. retracement level. This level was activated perfectly and signals that the correction low, most likely than not, is in. This part can be tricky. Let me explain what I mean.
Litecoin closed three days green and today is the fourth day this pair trades green. Here it can happen that we see a small advanced followed be another drop, a sudden drop, that produces a higher low. It can also happen that the market moves straight up. With very low volume, the bullish resumption is still not confirmed. This is the part that is tricky. It is hard to say if LTC will hit a higher high next or go through a higher low first.
There is nothing tricky here when you focus on the long-term. Short-term, anything goes. In fact, rather than a higher low or straight up, LTCUSDT can go sideways for a few days and then grow. All scenarios are possible, available and open.
The truth is that everything is quite simple, this chart is easy; Litecoin is going up.
The next rise can happen within 3 days, 10 days or 33.3 days; doesn't change anything, we are happy as long as the market grows. And it will grow.
On the chart we have short- to mid-term targets. We expect much higher prices by the completion of the current bullish phase.
We are only getting started. Are we?
You can bet so.
Thank you for reading.
Namaste.
$LTC Looking goodLitecoin has broken its downward trendline, but the key static resistance ahead remains crucial. If it manages to break through, it could see a strong rally.
It's better to wait for confirmation. Keeping it on the watchlist seems like a good idea!
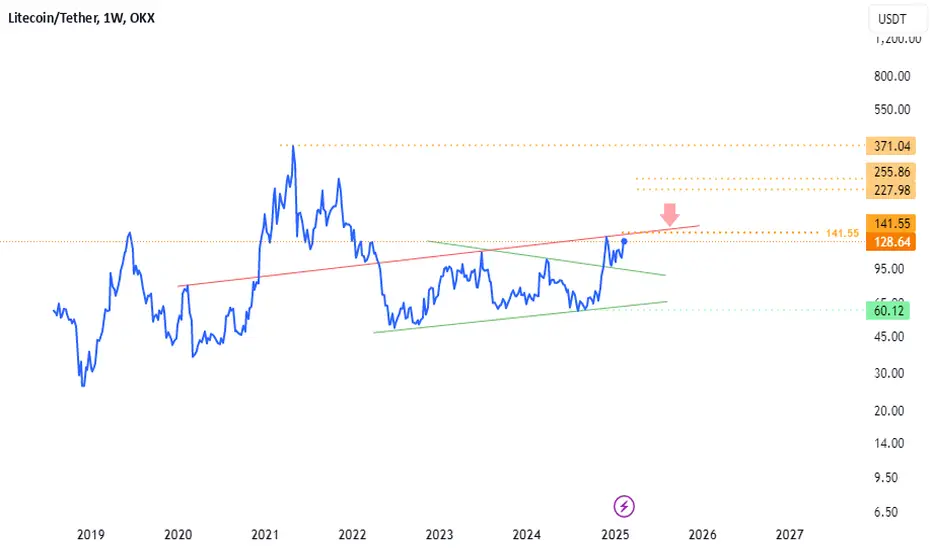
#LTCUSDT ( a line )A line chart and a strong and major resistance at the red arrow,
which can be sweet and hearty if it is broken,
so we are closely monitoring the breakdown of this resistance.
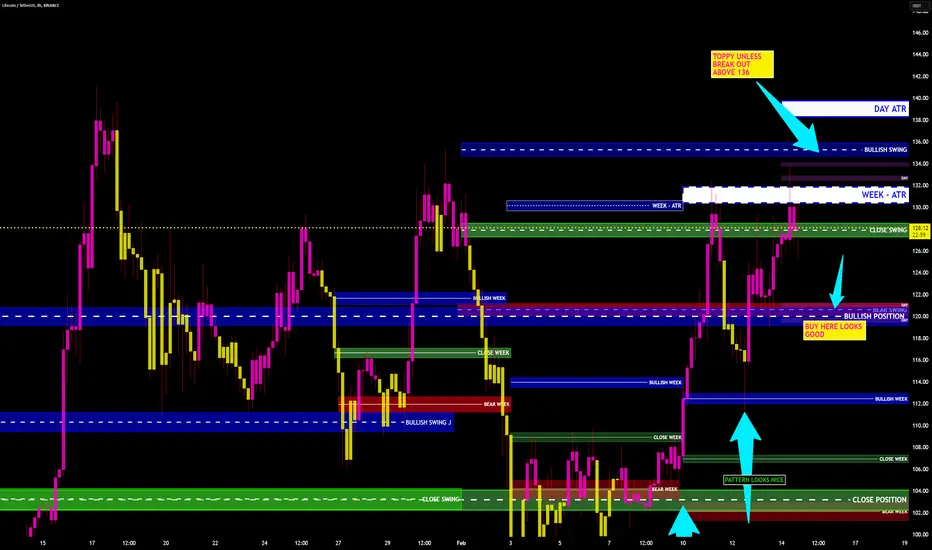
Litecoin Update (LTC/USDT)🚨 Litecoin Update (LTC/USDT) 🚨
Litecoin looking a bit toppy up here unless we see a clean breakout above the 135/136 handle. 📈
✅ Reload zone: Around the 120 level looks solid for a potential bounce and then a push to test that key 135 resistance.
💡 Key levels to watch:
🔹 135/136: Breakout confirmation zone
🔹 120: High-probability reload area
👨🏫 Reminder: Be patient, trade your plan, and always manage your risk. Think in probabilities, not certainties!
#Litecoin #LTC #CryptoTrading #DayTrading #RiskManagement #TradingStrategy
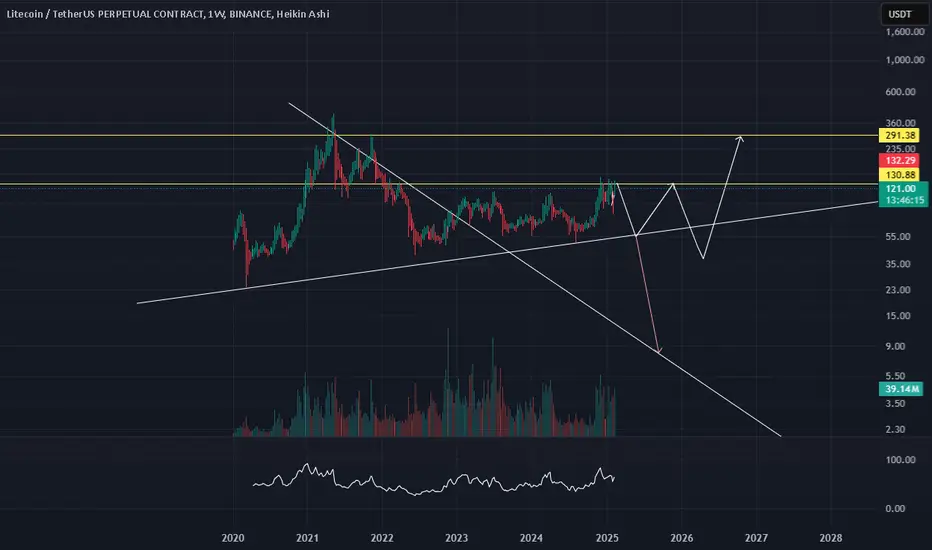
$LTC getting ready to giga sendWith all the tail wind for litecoin (halving happened ca. 1 year ago, ETF News) and a chart that looks absolutely amazing I could see a nice rally into the next monthly resistance @ $270. When you look a the daily chart, the break out has already happened, if the price of litecoin stays above $123 at the end of this week we also will have the weekly break out confirmation. Same goes for the monthly, but I think that if we start moving it will happen swiftly, leaving many bulls sidelined.
Once we reach monthly resistance at $270 it will be interesting to check how ETF flows are behaving. If flows are steadily strong once could also keep the long and aim for a new ath, but thats a story for another day. Today we watch how price action behaves after the daily breakout and if we get that weekly break out as well.

#LTC looks so awesome here to buy 105/120### Litecoin (LTC/USD) Technical Analysis
Current Chart Overview:
The daily chart for Litecoin (LTC) reveals a significant shift in price dynamics. Following a breakout below the moving average lines on February 3rd and a downward move to a low of $80, strong buying pressure has emerged, indicated by an extended candlestick tail touching this support level. This suggests that buyers are keen on defending the $80 support, while the current price action has developed a range-bound behavior above the critical $100 level.
- Anticipated Movement: If Litecoin can successfully breach the 50-day SMA, we may see the price progress towards a high of $134. Should the bulls maintain this upward momentum, a retest of the significant resistance at $135 and possibly the previous peak of $141 would become viable targets.
Target Levels:
- Short-Term Targets: 130 / 135 / 145
- Mid-Term Targets: 155 / 165 / 175
- Long-Term Targets: 185 / 200 / 225
LTC BUYhello friends
According to the formed channel and price support from the bottom of the channel, we can enter the position with capital management.
*Trade safely with us*
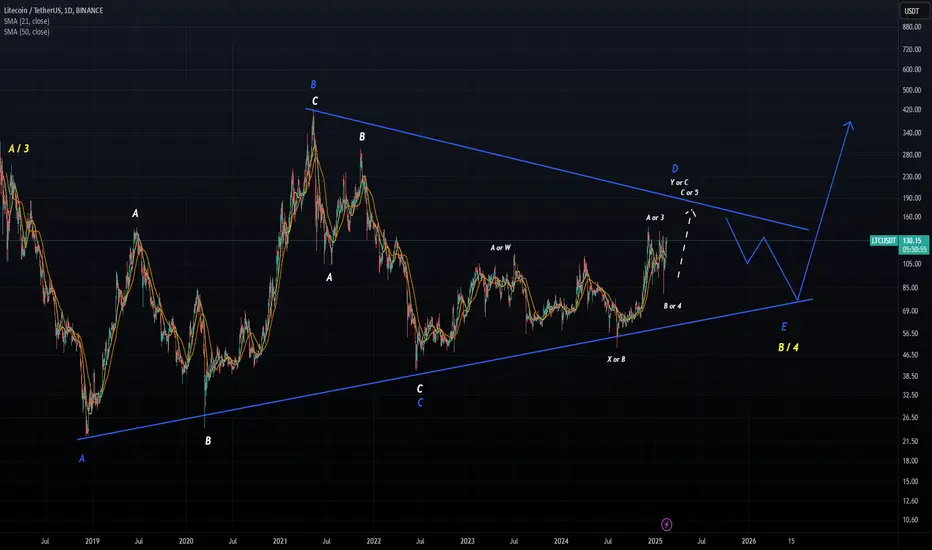
LTC Ready to Surge ! A Potential 200% Opportunity AwaitsHello Traders 🐺,
In this idea, I want to take a closer look at LTC . As you might know, the first step in our analysis is always to check the higher time frames like the weekly or even monthly charts. Once we get a clear picture of the bigger trend, we can zoom in on the daily or 4H time frames to identify the best entry points—whether for a solid spot trade or even a leverage position ! 👇🔥
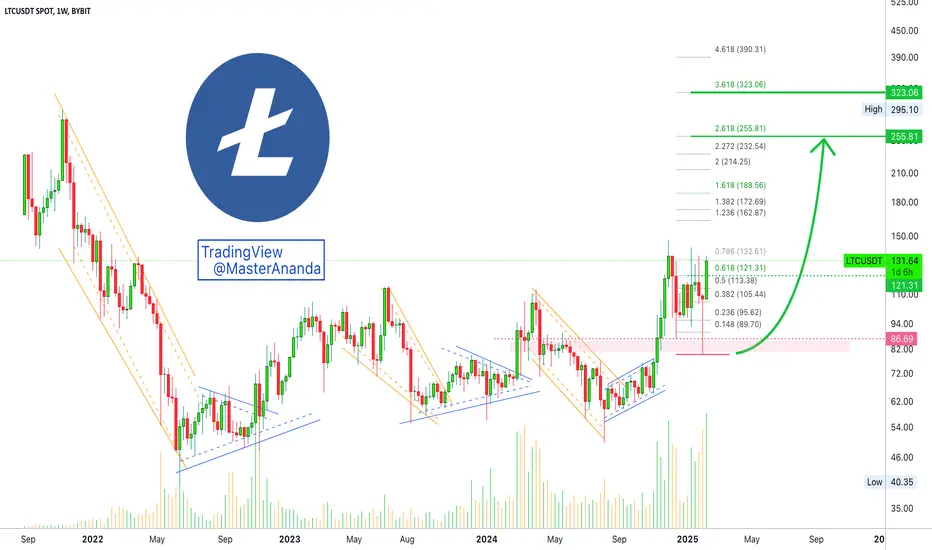
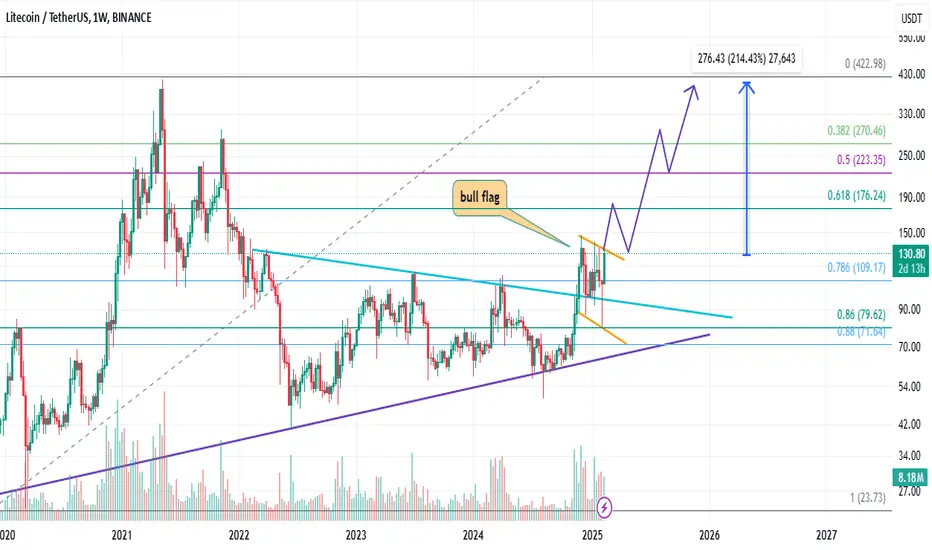
As you can see in the weekly chart , LTC is clearly in an uptrend and currently forming a bull flag . If the price breaks above this pattern, we could expect a move at least toward the 0.618 Fib level.
Also, during the last market dip , LTC held strong above a major monthly support , represented by the blue trend line , which reinforces its importance as a key support level.
With all these bullish signals lining up, it’s time to zoom into the daily chart and look for a solid long entry ! 🚀
In my opinion , if the price breaks above the yellow resistance line and closes at least one 4H candle above it with strong volume support , this could be a great confirmation to open a long position . The next key target? The 0.618 Fib level , which serves as the next major resistance! 🚀
" 🐺Stay sharp, trade smart! – KIU_COIN 🐺 "
Litecoin ETF inevitableSomeone's painting the chart, there is no doubt about it. I think old meme coins will make a comeback LTC being one of the strongest one atm so position accordingly.
There is a strong chance this pumps harder than target on here, 400s seems doable.
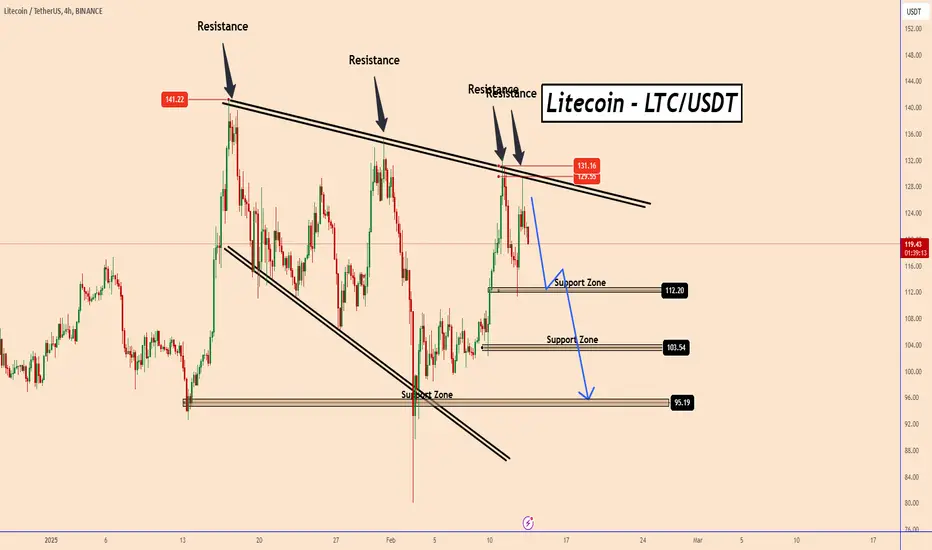
LTC: Increased Downward ProbabilityLTC: Increased Downward Probability
Litecoin (LTC) has encountered a robust resistance zone near the 131.00 level for the fourth time.
This level aligns with the resistance line originating from the peak of 141.20 on January 15th, 2025.
Given the strong reaction at this level, the likelihood of a downward movement appears higher. The chart suggests potential support areas around 112.20, 103.50, and 95.20.
You may find more details in the chart!
Thank you and Good Luck!
❤️PS: Please support with a like or comment if you find this analysis useful for your trading day❤️
LTC USDT Levels | BTC | DOGE | ETH LTC Should hold $112 level to break the bigger range ( $135 resistance)
BTC is in sideways . so till then BTC pair can try to gain some momentum
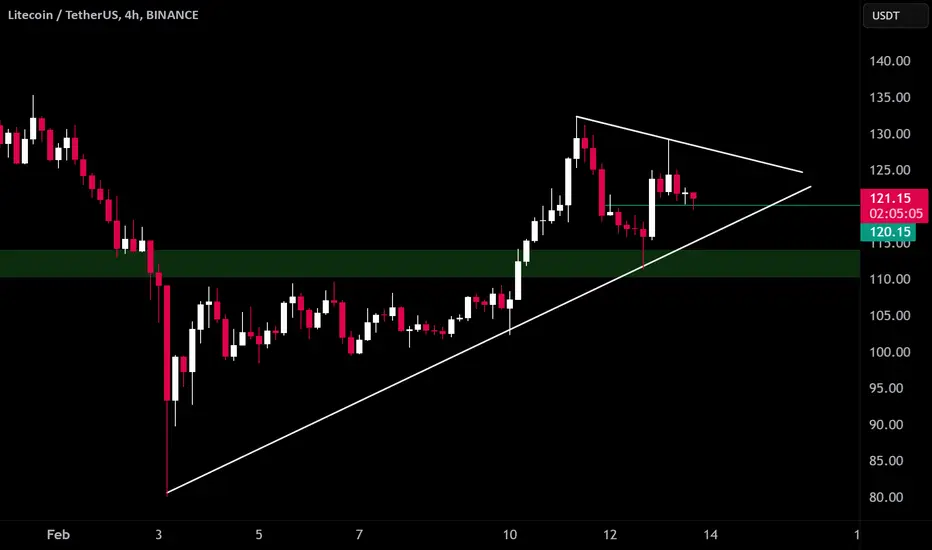
Litecoin (LTC) Long Spot OpportunityMarket Context:
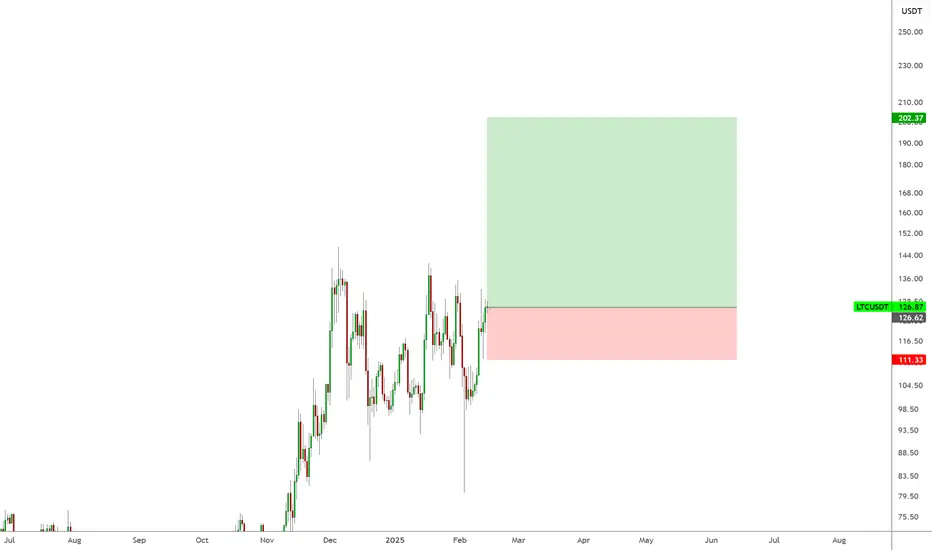
Litecoin has retraced into a key support zone, offering a favorable entry for a potential bounce.
Trade Details:
Entry Zone: $109 - $115
Take Profit Targets:
$130 - $140
$165 - $170
Stop Loss: Just below $105
This trade presents a strong risk-to-reward opportunity if LTC holds support and continues its uptrend. 📈