LTC Scenaripo 2 this is just another scernarip that i deem possible
therefore take care and good luck
LTCUSDT trade ideas
LTC Update scalpso i said if i will do it, let me atleats try to master it, so another copy hoping to be more accurate than the first
good luck
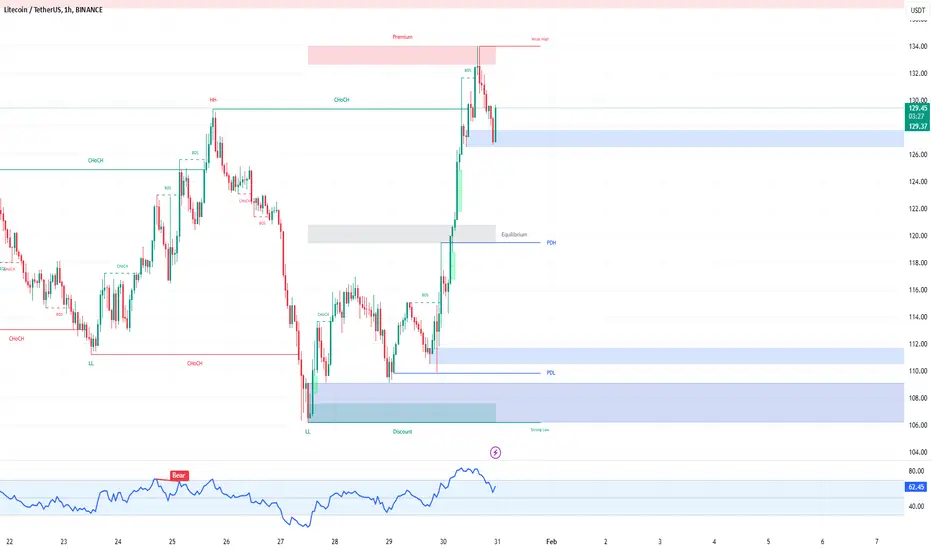
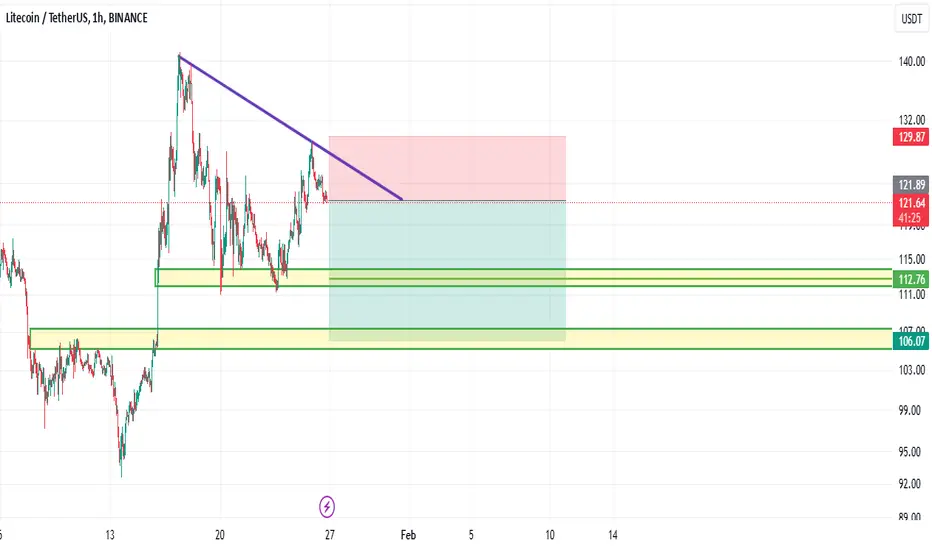
LTC/USDT 1H: Bears Target $112 After $132 Rejection!LTC/USDT 1H Chart Analysis
🚀 Follow me on TradingView if you respect our charts 📈Daily new charts!
Current Market Structure:
Bearish trend confirmed after rejection from premium zone at $132.
RSI: Bearish divergence at recent high, with overbought conditions.
Market Structure: Lower highs forming, signaling continuation to the downside.
Smart Money Activity:
Accumulation Phase: Likely occurring at discount zone $110-$112.
Distribution Phase: Visible at the premium zone ($132).
Market Makers: Targeting liquidity below $110.
Key Levels:
Entry Zone: Short at $126-$128 (resistance zone).
Targets:
T1: $120 (Equilibrium Zone).
T2: $112 (Discount Zone).
Stop Loss: Above $133 (recent swing high).
Risk Score:
7/10 (Favorable R:R ratio with clear invalidation).
Market Maker Intent:
Stop Hunt Expected: Watch for potential liquidity grab above $132 before further downside.
Volume Analysis: Declining on recent push up, indicating weakening bullish pressure.
Recommendation:
Short positions favorable within the $126-$128 range.
Maintain tight stops above $133 to manage risk.
Wait for bearish order block confirmation before entering.
Confidence Level: 8/10 for bearish continuation.
🚀 Follow me on TradingView if you respect our charts 📈Daily new charts!
LTC has a real good pattern for a huge rise !#LTC has a perfect pattern for rising !
in higher time frames we have a perfect huge rising channel and in lower time frames there is a positive pattern for rising !
check out my analysis on this coin in higher time frames !
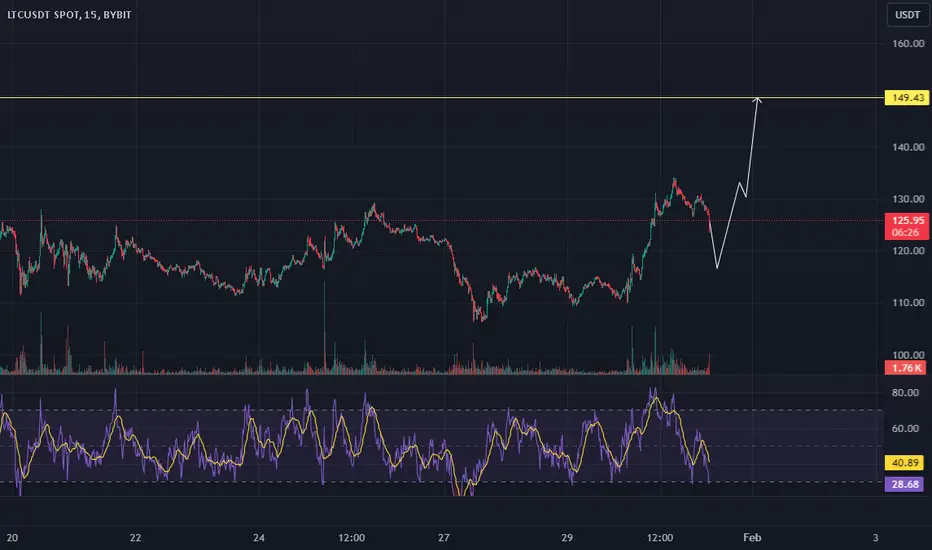
300 % profit on LTC !#LTC has a very clear rising channel pattern as i was told before the roof of the channel can be touched and then it will be a 350 % profit from now ! if it make a correction it will be more too !
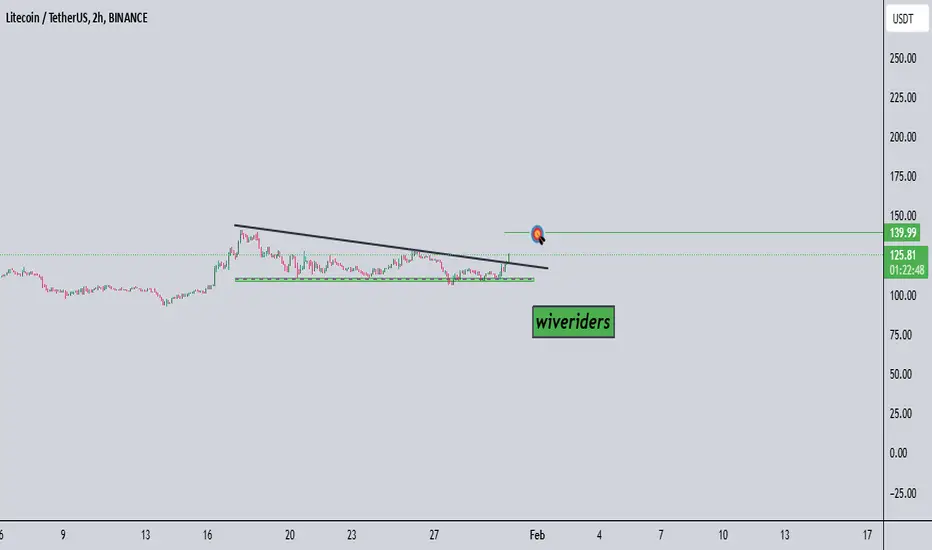
$LTC/USDT AnalysisCRYPTOCAP:LTC is breaking out of its resistance trendline in black.
🎯 Target to Watch:
1️⃣ First Target: Green line level
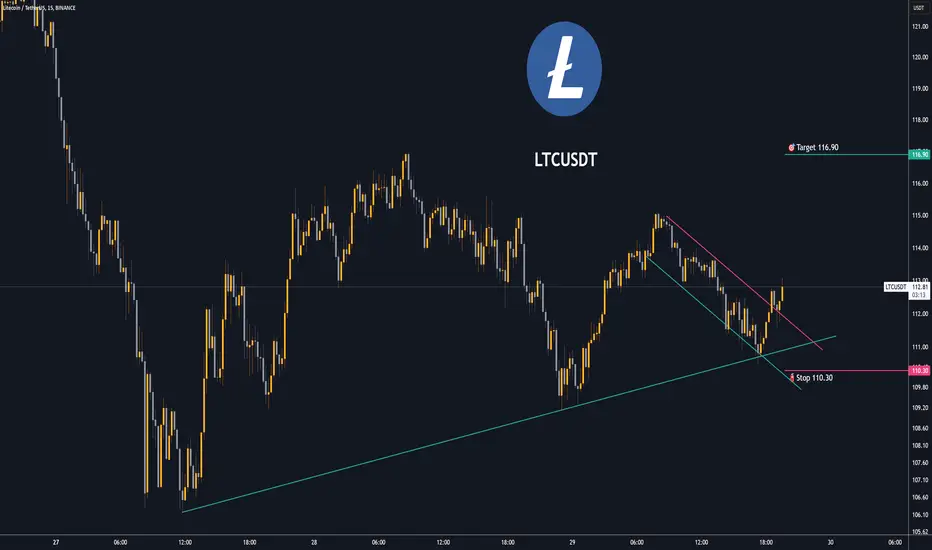
Trading opportunity for LTCUSDTBased on technical factors there is a Buy position in :
📊 LTCUSDT
🔵 Buy Now
🪫Stop loss 110.30
🔋Target 116.90
📏 R/R 1,5
💸RISK : 1%
We hope it is profitable for you ❤️
Please support our activity with your likes👍 and comments📝
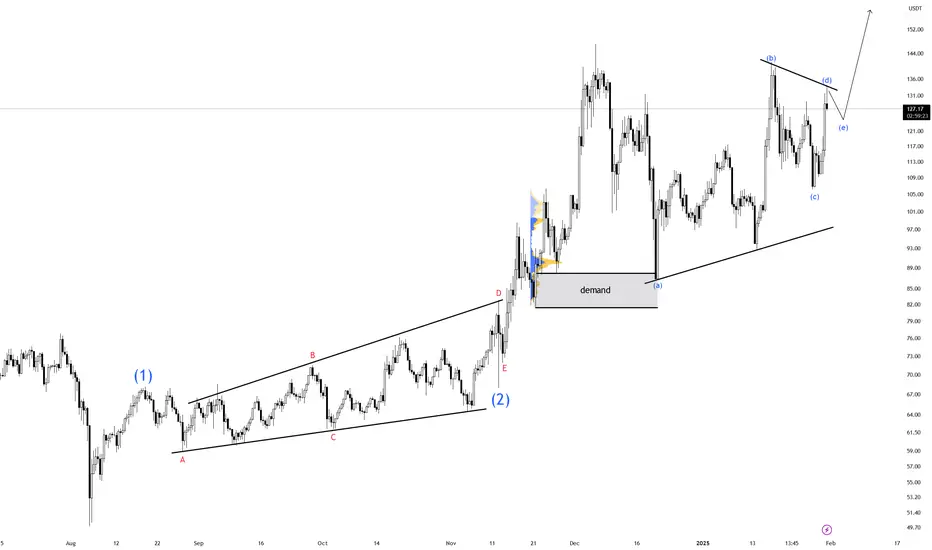
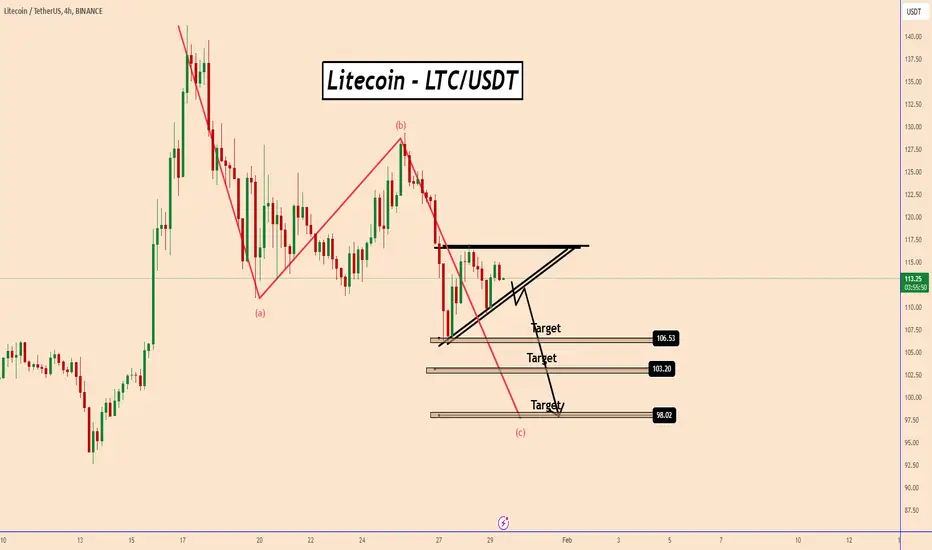
LTC Prepares for Bearish C Wave DownLTC Prepares for Bearish C Wave Down
Currently, Litecoin (LTC) seems to be entering a C wave-down phase.
The price appears to be accumulating, which may lead to the formation of a triangle pattern soon. A breakout from this pattern is expected to push the price down further, potentially resuming the short-term bearish trend.
The overall cryptocurrency market is anticipating an update from President Donald Trump regarding new decisions related to cryptocurrencies. However, these hopes have been diminishing, adding to the uncertainty.
Support Levels to Watch: 106.50; 103.2 and 98
You may find more details in the chart!
Thank you and Good Luck!
❤️PS: Please support with a like or comment if you find this analysis useful for your trading day❤️
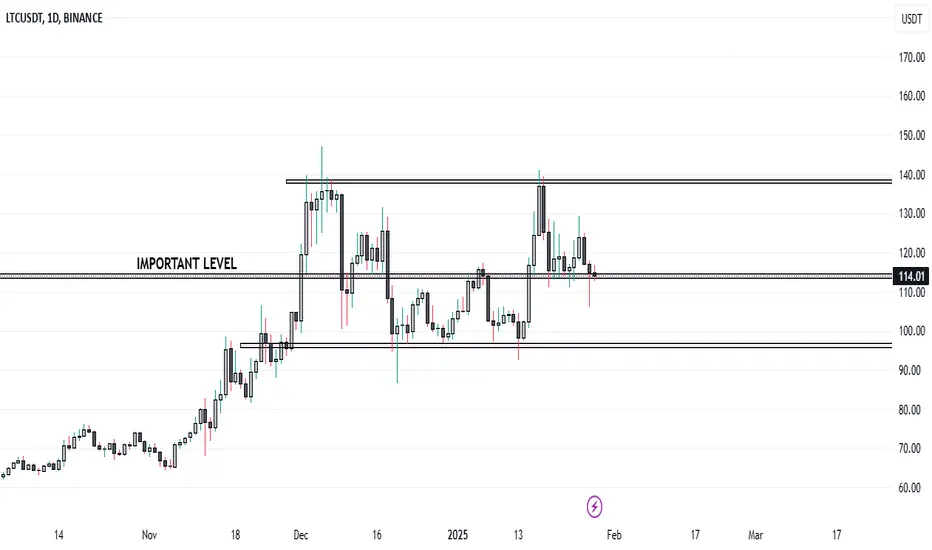
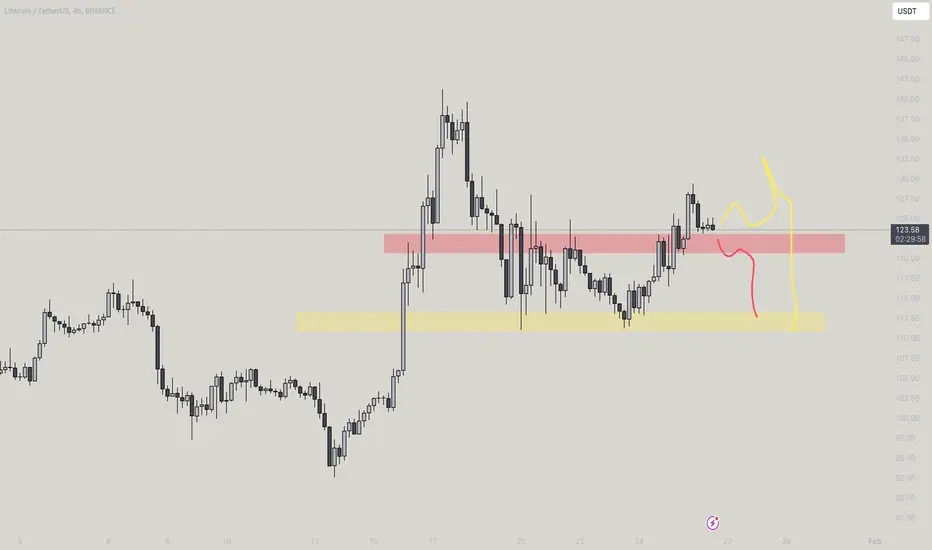
Litecoin Struggles at Key Level: Make or Break Moment...Currently, Litecoin is encountering formidable resistance at the $114 threshold, which has proven to be a critical barrier to upward momentum. Beyond this level, additional resistance can be observed at $140, suggesting a challenging climb for any bullish movements. On the downside, significant support is established within the $96 to $97 range, providing a safety net for potential dips.
In terms of strategy, we might consider initiating a long position if the price convincingly breaks above the $114 resistance level and sustains its position there for a reasonable duration. This confirmation would indicate a possible bullish trend. Conversely, should the price decline below the $96-$97 support zone, it may warrant a reevaluation, potentially leading to the initiation of a short position as this could signal bearish sentiment taking hold in the market.
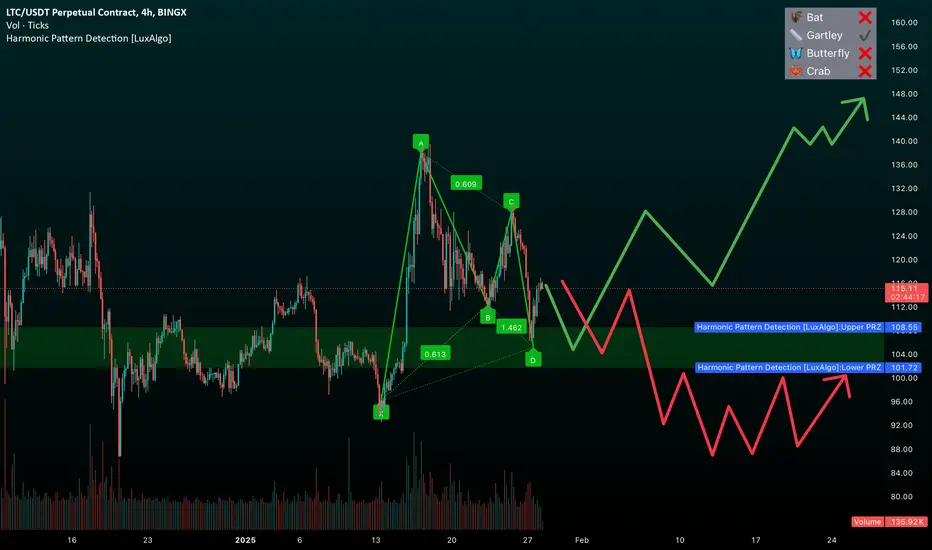
Litecoin trend predictionI saw Gartly on the Litecoin 4H Chart, but its outcome is contingent upon market dynamics and whether tomorrow’s Fed conference will present an unanticipated situation , downtrend will expected
Litecoin getting ready to ripI believe litecoin is in a ABC correction currently in C wave I believe it will do a False breakout to the downside then rip to the upside. 103 area would be .618 of wave A if wave C is equal to wave A then we could see 80-82$ area either way my first buy is at the bottom trend line then I will wait for price action.
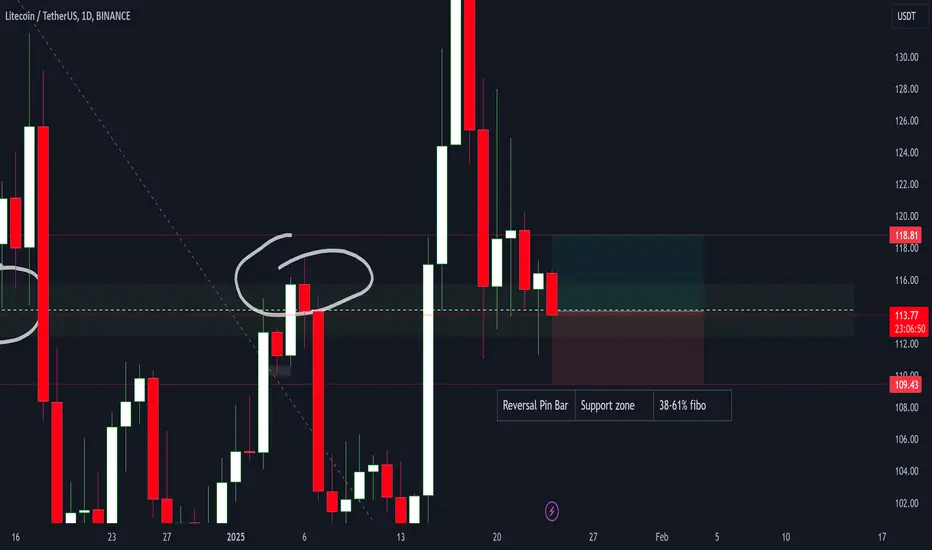
TradeWithMky LTC LIVE TRadehello there
we are in support zone right now
its an opportinity for Long positons if you got candle sticks confirmataions
I saw reversal pinbar in support zone
I go LONG with Logical Money managemnet and risk managements
consider that this is not finantial advise its my analysis about this chart
also I will edit this post as soon as price reach TP / SL / Deavtive
#TradeWithmky
@TradeWithMky
ltc hello friends
Considering the weakness of the trend and its return from resistance, we can enter into a transaction with capital management...
*Trade safely with us*
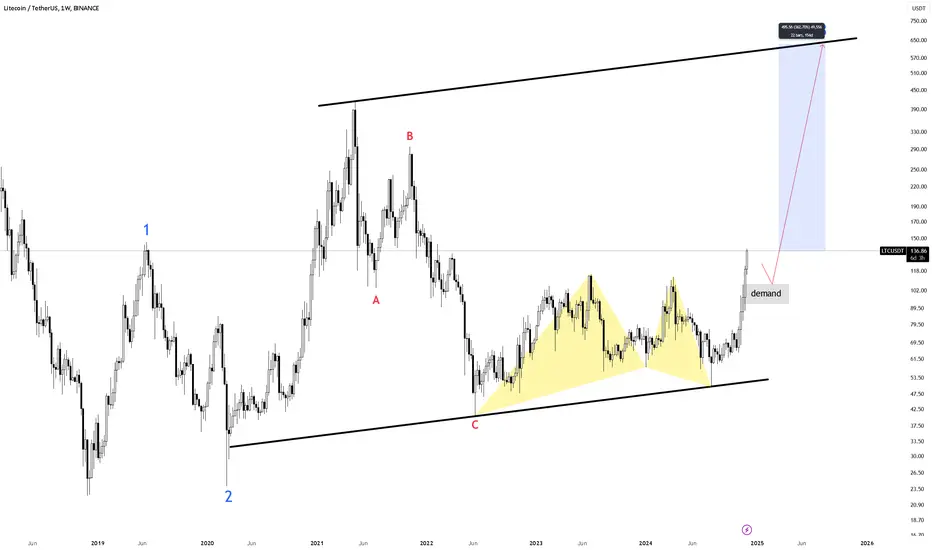
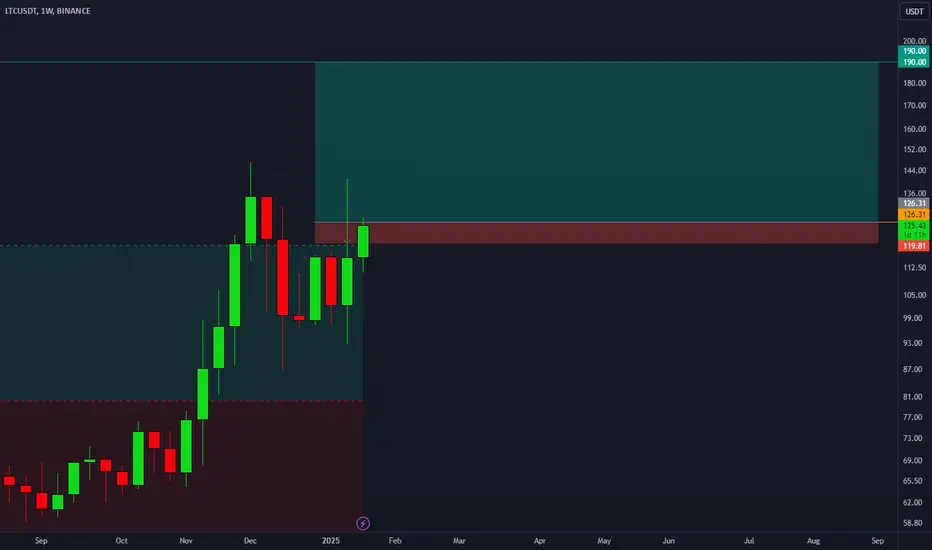
LTC Potential 50% Short TermAfter consolidating more than 1000 days, Litecoin is on the verge to make new fair value to nearest major resistance at 150-230 area.

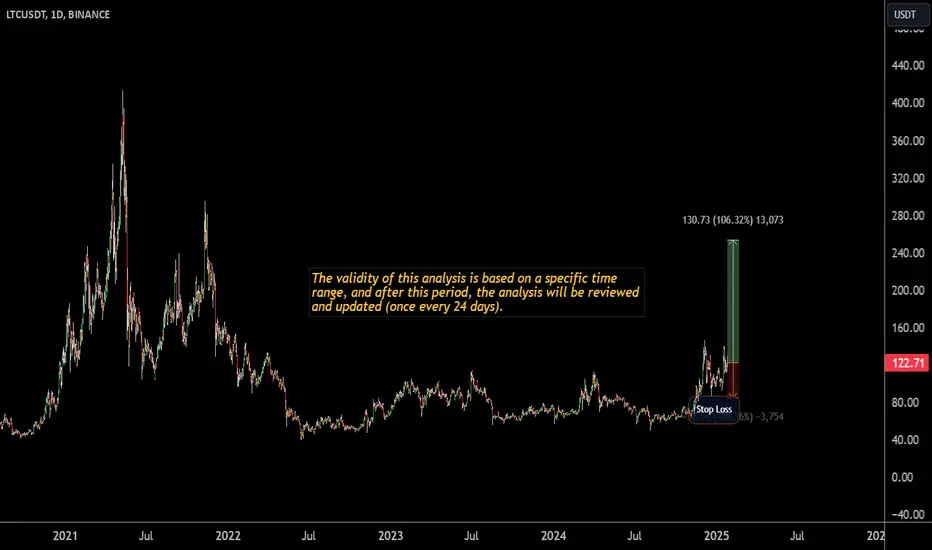
Litecoin-LTCUSD Periodic Analysis (Issue 62)The analyst believes that the price of Litecoin will increase in the next 24 Days. This prediction is based on quantitative analysis of the price trend..
Please note that the specified take-profit level does not imply a prediction that the price will reach that point. In this framework of analysis and trading, unlike the stop-loss, which is mandatory, setting a take-profit level is optional. Whether the price reaches the take-profit level or not is of no significance, as the results are calculated based on the start and end times. The take-profit level merely indicates the potential maximum price fluctuation within that time frame.
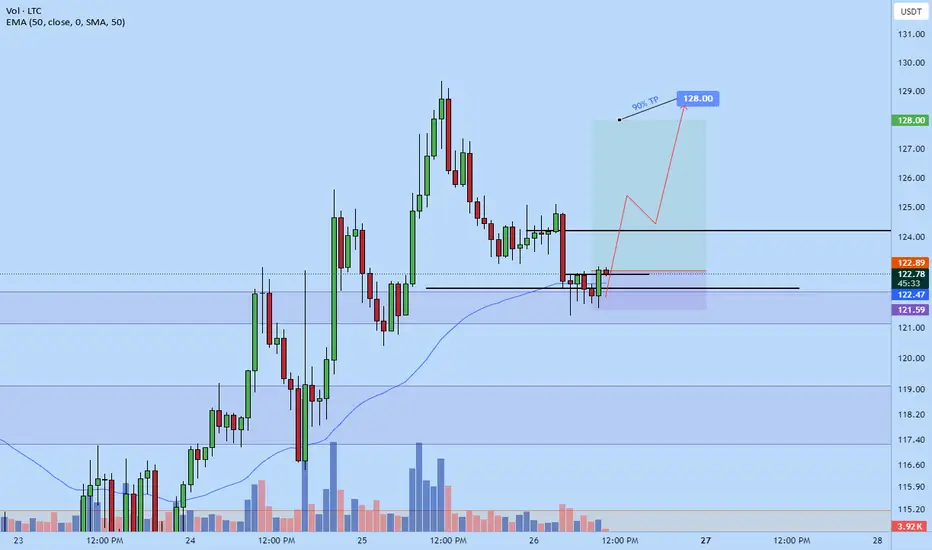
Litecoin long to $128Just opened this long position on litecoin.
I anticipate it will pump back up soon to $128. Its bullish on the weekly, daily and 4hr tf and just now we see the bulls have been able to push the price back above $122.75 which is a minor key level signaling that this is likely the end of the correction.
Fundamentally there also has been some talks about etf being filed for it.
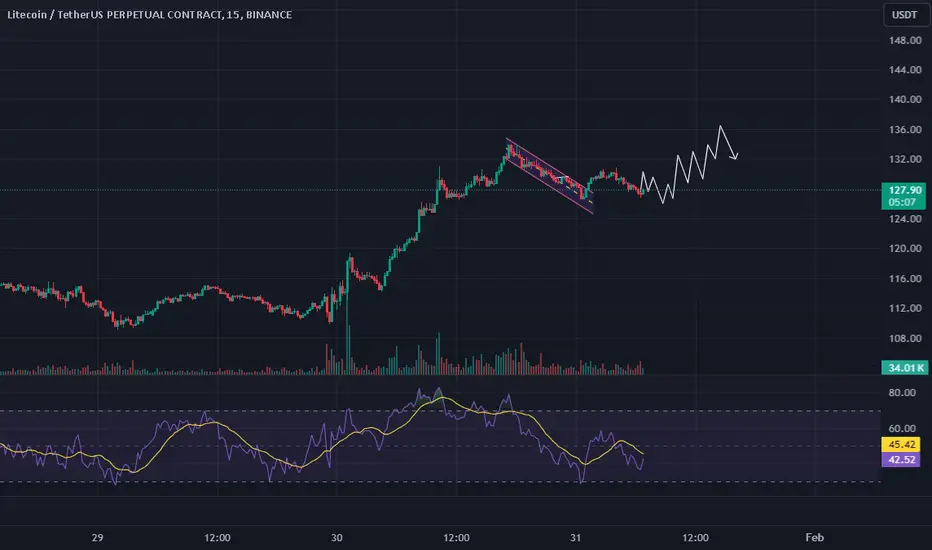
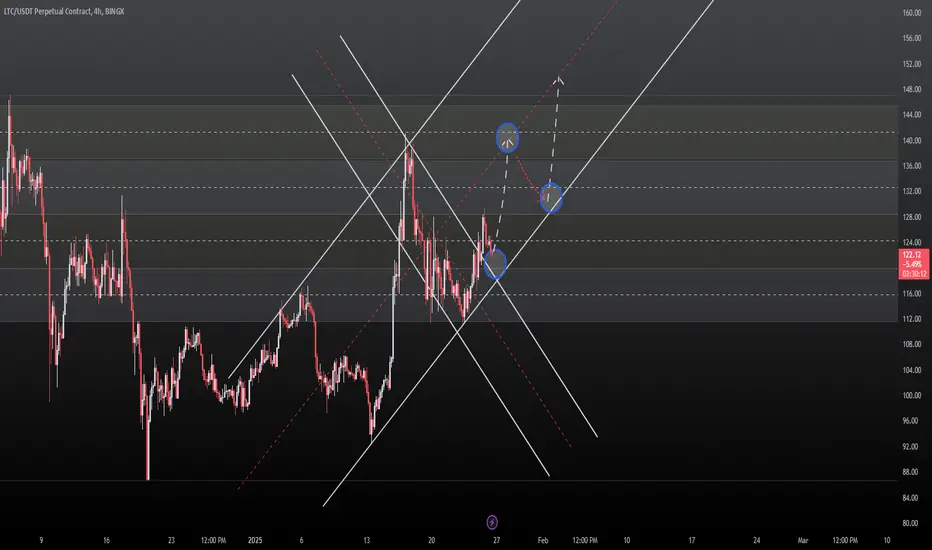
LTCUSDT UpdateHello traders!
This the update of my last LTCUSDT analysis
My SL is on $117.20
My first target (or maybe my last one): $140.00
Good Luck
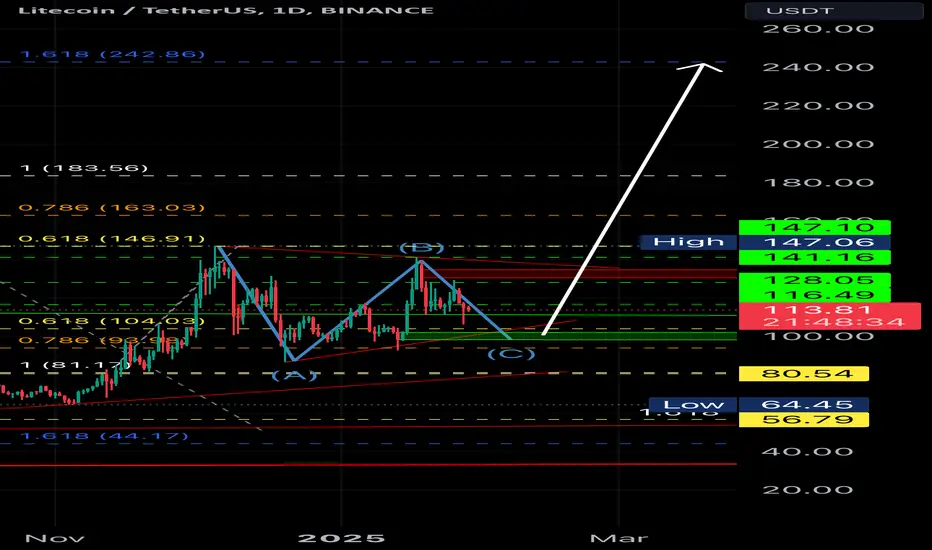
Can we be optimistic that this will come true? You might wonder why altcoins haven't experienced significant growth compared to Bitcoin. The answer lies in meme coins, as they have caused substantial harm to the market. How many cryptocurrencies do we really need? So, focus on the primary cryptocurrencies in this market. In my opinion, everything is beautiful for the first time, so only pay attention to Dogecoin among the meme coins.
Can we be optimistic that this will come true? If it follows the triangle pattern, the price will rise by $60.
Give me some energy !!
✨We spend hours finding potential opportunities and writing useful ideas, we would be happy if you support us.
Best regards CobraVanguard.💚
_ _ _ _ __ _ _ _ _ _ _ _ _ _ _ _ _ _ _ _ _ _ _ _ _ _ _ _ _ _ _ _
✅Thank you, and for more ideas, hit ❤️Like❤️ and 🌟Follow🌟!
⚠️Things can change...
The markets are always changing and even with all these signals, the market changes tend to be strong and fast!!

LTC perfect buy setupHi crypto enthusiastic
LTC has a good opportunity for long and it can go up.
Everything is clear in the chart.
DYOR
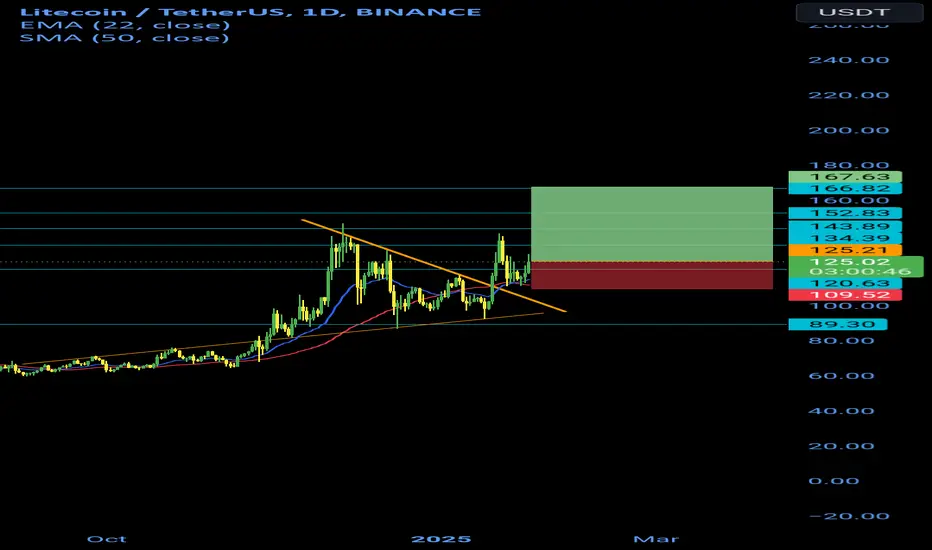
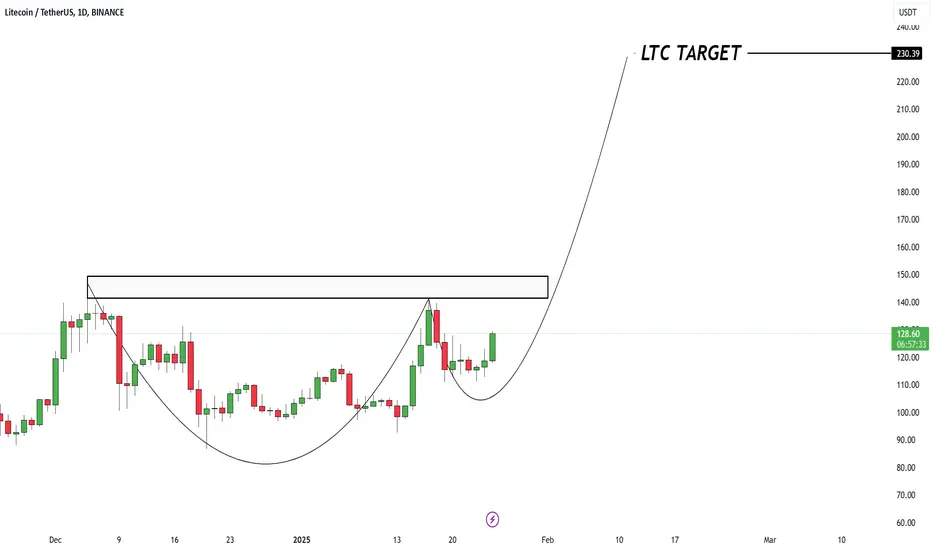
LTC USDT💰 CRYPTOCAP:LTC USDT
# LTC The Cup & Handle formation on the daily chart is signaling a powerful breakout 🐃
Strong resistance around $150 is the key level to watch before heading toward the target zone.
🎯 Target: $230.39
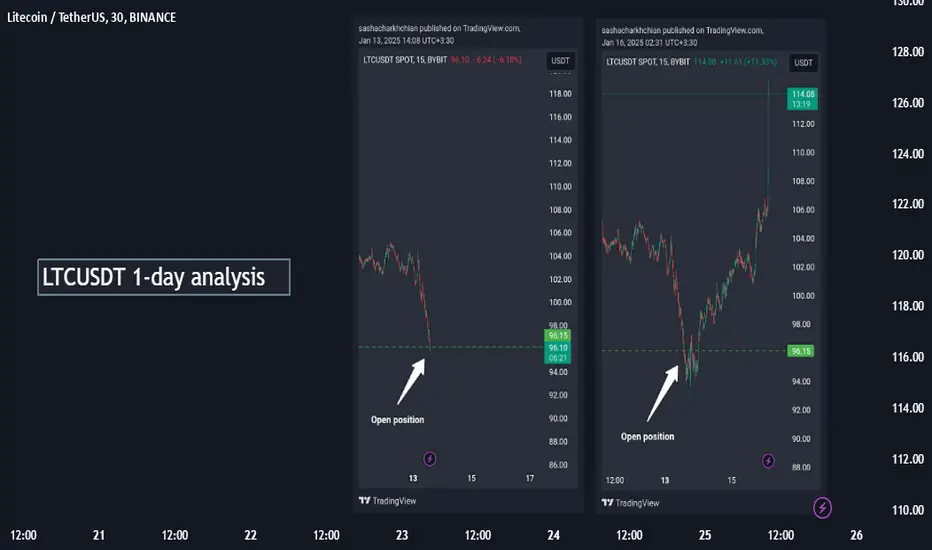
LTCUSDT 1-day analysis LTCUSDT 1-day analysis
1-day analysis of the strongest short-term support and sudden price increase of this cryptocurrency, this downward and upward swing has been repeated 2 times on the chart of this currency, indicating confirmation of this support area.
Sasha Charkhchian