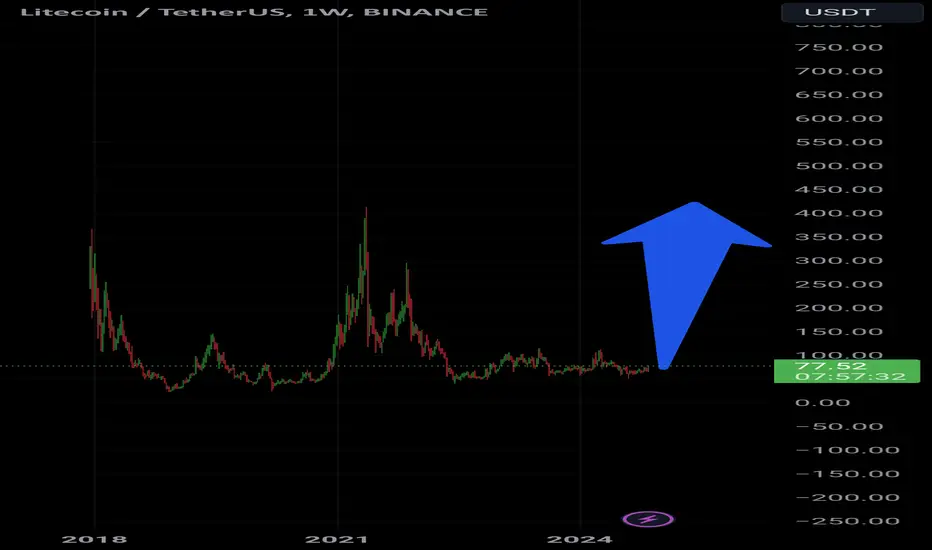
#LTC: Bullish Breakout! #LTC: Bullish Breakout! 🚀
Litecoin has broken out of a symmetrical triangle, signaling a strong rally ahead. Medium-term target: $285 🎯. Watch for volume confirmation and key support at $240 in case of a pullback.
LTCUSDT trade ideas
LTC | ALTCOINS | BIG Gainer OR Sinking Ship?LTC has been on my watchlist for many, many months - much to my annoyance.
Compared to other altcoins such as DOGE, LTC is just not growing, and hasn't been for the better part of two years as it is unable to breakout above $110.
This we see evidently when we pull up the DOGE chart in comparison, and the BTC chart to really get an idea of just how bullish we are - a sentiment that is just not showing p on the LTC chart.
WHEN the TOTAL3 peaks out above BTC , altcoins would have completed their runs. (More on that subject here):
We're still some time away from this; meaning that there is still hope for LTC. However, IF LTC can't move PAST these resistance zones I'd have to just face the facts and put it in the same boat as XRP and ADA.
_______________________
BINANCE:LTCUSDT BINANCE:LTCBTC

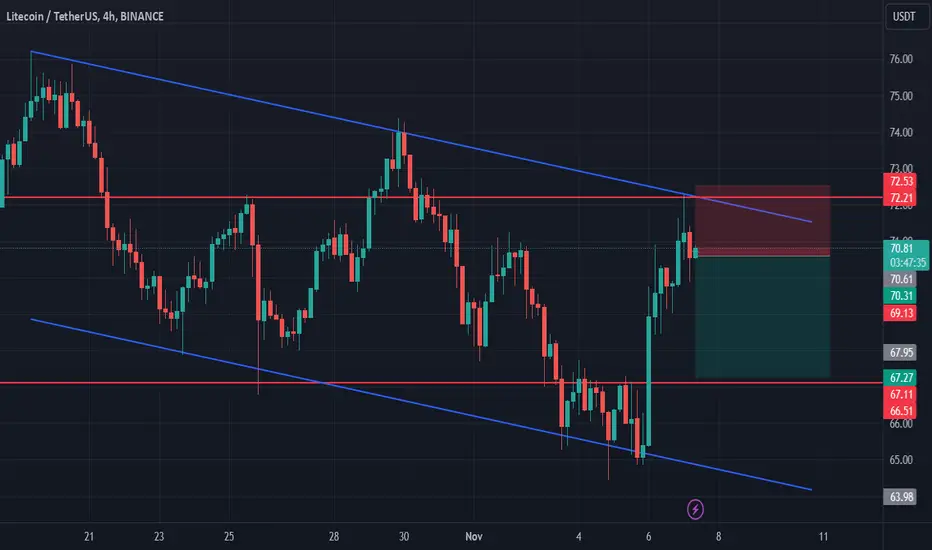
#LTC/USDT#LTC
The price is moving within a bearish channel pattern on the 4-hour frame, which is a strong retracement pattern
We have a bounce from a major support area in the color EUR at 67.70
We have a tendency to stabilize above the Moving Average 100
We have a downtrend on the RSI indicator that supports the rise and gives greater momentum and the price is based on it
Entry price is 72.00
The first target is 80.50
The second goal is 88.54
Third goal 99.01
LtcusdtLtc broke ma200 in weakly time frame, it's very important for investors
If you want make money buy and hold ltc for 2x target 🎯
LtcusdtLtc broke ma200 in weakly time frame, it's very important for investors
If you want make money buy and hold ltc for 2x target 🎯

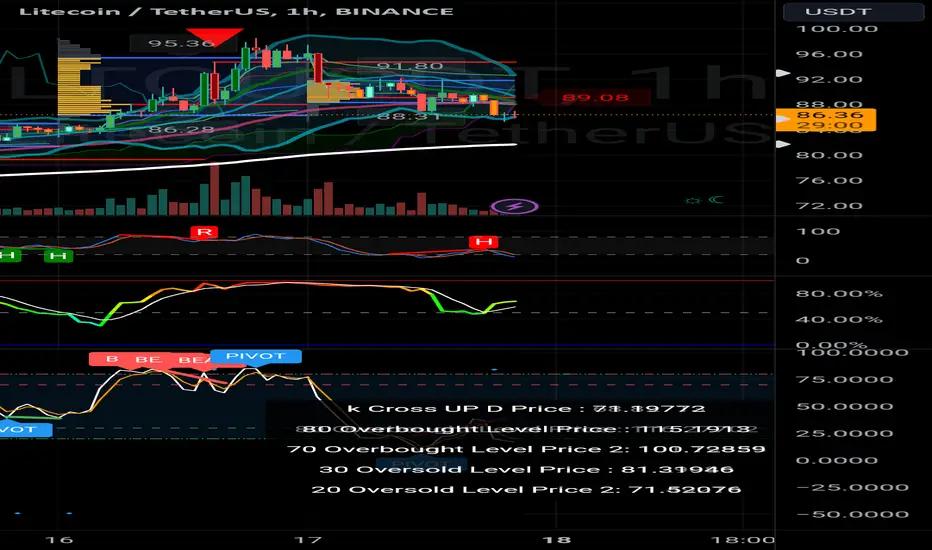
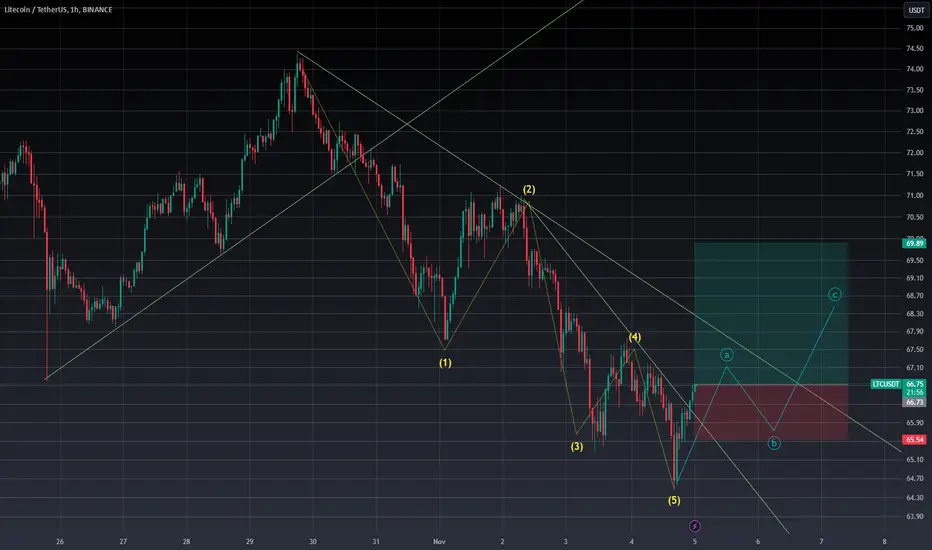
LTC/USDT: Potential Upside Ahead Amid Recent RetracementAnalysis
The 1-hour chart for LTC/USDT highlights several technical indicators that suggest a possible upside despite the recent bearish movement. Here are the key observations:
Bollinger Bands Compression:
The price is trading near the lower Bollinger Band, indicating that LTC is in a potentially oversold zone. Historically, such positions near the band often lead to reversals or retracements toward the mean (centerline of the Bollinger Bands).
Oversold Levels on Indicators:
The stochastic RSI is approaching oversold levels (30% and below), which increases the likelihood of a bullish reversal.
The RSI also shows signs of bottoming out near oversold territory, which often precedes upward movement.
Pivot and Key Support Levels:
The current price at $86.84 is near a significant support zone (noted by historical price action and volume spikes). This level has acted as a floor in the past, indicating buyers may step in here to push the price higher.
The "PIVOT" label near this region adds additional weight to this area as a key point of support.
Volume and Momentum:
A noticeable decrease in selling volume indicates diminishing bearish momentum, which often precedes a reversal.
The MACD (if analyzed further) could also show signs of bullish divergence given the slowing sell-off.
Resistance Zones:
The next major resistance is visible around $91.80 (recent high), which aligns with the upper Bollinger Band. Breaking this level would confirm a short-term bullish trend.
An extended move could see the price test the $95–$96 range, though this would depend on significant bullish momentum.
Stop Loss, Take Profit, and Additional Levels
Stop Loss: Place the stop loss slightly below the support zone, at $83.50. This ensures minimal losses if the bearish trend continues.
Take Profit: The first take-profit zone should be around $91.80, aligning with the upper Bollinger Band and recent resistance.
Potential Extended Target: A secondary level to watch is $95.36, where significant resistance lies. This level is hit or miss, as it depends on strong bullish momentum and external factors.
Conclusion
While LTC/USDT has recently experienced a significant drop, technical indicators suggest that a rebound could be on the horizon. Oversold conditions on the stochastic RSI, support at $86.84, and diminishing sell volume all point to a potential reversal. Traders should keep an eye on the $91.80 resistance for initial profits and watch $95.36 for a potential extension if bullish momentum strengthens. However, caution is warranted, and a stop-loss at $83.50 is advisable to manage risk effectively.
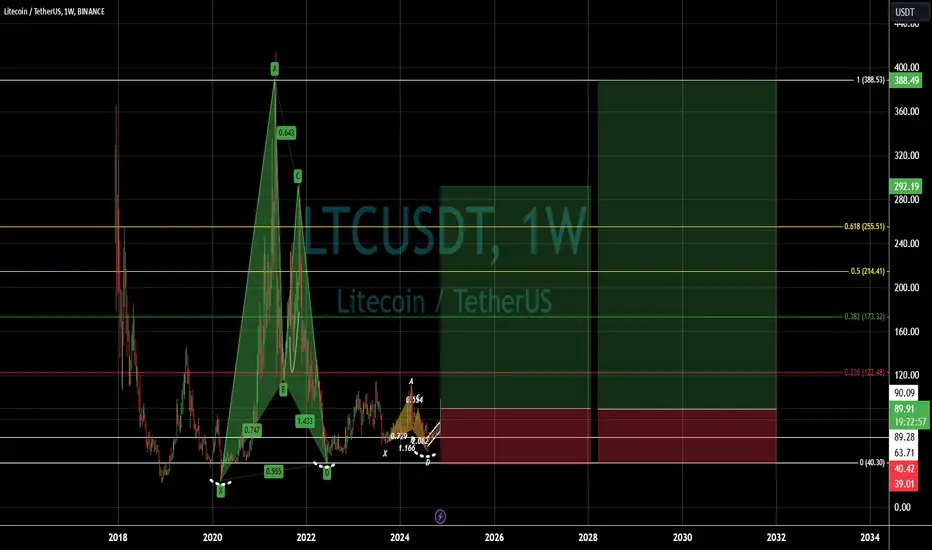
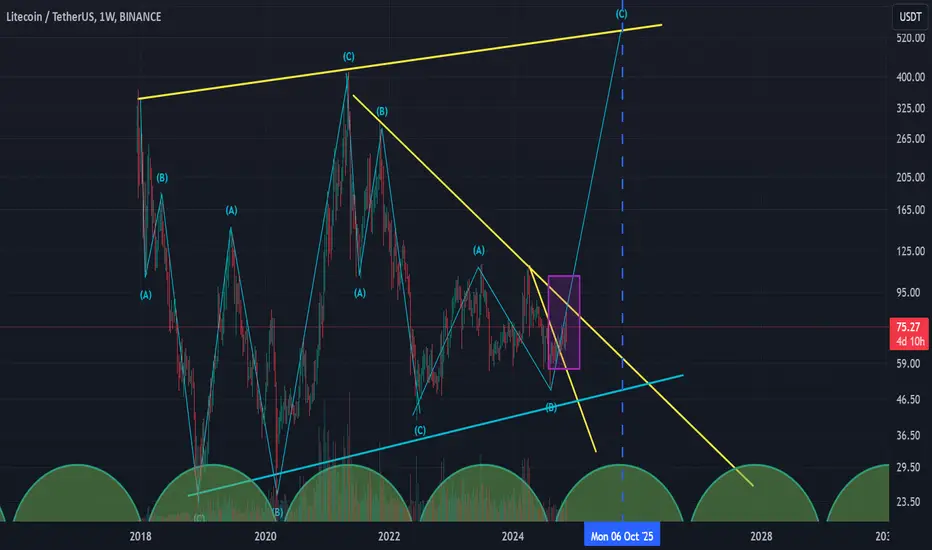
$LTC Litecoin Bullish Harmonic (With Targets)Bullish Harmonic on the weekly for Litecoin. Projected Targets are posted.
Litecoin (LTCUSDT): 350% Profit DONE!The 4-hour Litecoin chart demonstrates a flawless long trade setup, with all targets smashed and traders pocketing 350% gains on leveraged positions. This trade proves yet again the power of precision technical setups.
Trade Highlights:
Entry Price: $69.68
Stop Loss: $67.04 (minimal risk exposure)
Profit Targets:
TP1: $72.95 ✅
TP2: $78.25 ✅
TP3: $83.54 ✅
TP4: $86.81 ✅
Observations:
Strong Momentum: Litecoin showed consistent upward movement, confirming a strong trend supported by market sentiment.
Indicator Alignment: The trade was signaled by the Risological Swing Trader, ensuring a high-confidence entry with clear targets.
Leverage Efficiency: At 10x leverage, this trade generated an astonishing 350% return on investment, making it a significant win for LTC bulls.
Market Outlook:
Litecoin's breakout performance underscores its bullish potential. While profit-taking at this level is advised, the upward trajectory hints at further opportunities ahead.
Congratulations to all who capitalized on this spectacular trade! 🚀

LTC thesis with RAG AI by Titan_KarmaGiven the current market conditions for LTC, there is a favorable opportunity to consider entering a LONG position. The recent news surrounding regulatory changes positively impacting altcoins, along with the bullish sentiment reflected in the financial analysis, suggests a potential upward movement for LTC. The price of LTCUSDT is currently at $89.74, with a significant trading volume of approximately 1.78 million, indicating strong market interest.
The technical analysis indicates a strong bullish trend, particularly on the daily timeframe where the RSI is above 70, suggesting overbought conditions. However, caution is warranted as the price approaches the upper Bollinger Band and resistance levels. The short-term indicators (1h and 15m) suggest a potential consolidation phase, which may lead to a pullback. Therefore, it is essential to monitor price action closely around the resistance levels and consider setting stop-loss orders to protect gains.
Incorporating real-time data from Coinglass, the open interest and funding rates indicate a bullish sentiment, which aligns with the current market dynamics. The long-short ratio consistently above 0.6 further supports the decision to consider a LONG position.
coinglass_data: The latest open interest for LTC shows a steady increase, indicating growing confidence among traders. The weighted funding rate remains positive, suggesting that long positions are favored. Liquidation levels are currently stable, providing a conducive environment for potential upward movement.
binance_data: The order book dynamics reveal significant buy walls at key support levels, which could act as a buffer against downward price movements. The price action signals indicate a bullish momentum, with candlestick patterns suggesting potential breakouts.
coinmarketcap_data: The volume data over the last 24 hours shows a healthy trading activity, with a liquidity score indicating strong market depth. The market cap of LTC has seen a positive change, reinforcing the bullish outlook.
sentiment: Current market sentiment analysis from Augmento.ai shows a predominantly positive sentiment towards LTC, with many traders expressing optimism about the upcoming price movements.
cryptocompare_data: The latest news and social media sentiment indicate a growing interest in LTC, particularly in light of recent developments in the cryptocurrency space.
Technical Analysis: The indicators suggest a strong bullish trend, but caution is advised due to overbought conditions. The RSI is currently at 61.37 on the 1-hour chart, indicating buying momentum, while the MACD shows a bullish crossover. The price is above the 50-period moving average, reinforcing the bullish outlook.
The top 3 BTC pairs exhibiting strong performance today include BTC/ETH, BTC/XRP, and BTC/LTC, which may provide correlated trend analysis for LTC.
TRADE RECOMMENDATION
json { "OUTCOME": "OPEN_LONG", "STOP_LOSS": "$87.50", "TAKE_PROFIT": "$92.00", "CONFIDENCE_LEVEL": "85%", "EXIT_POINT": "$90.00", "ENTRY_CRITERIA": { "TIMEFRAME": "1h", "RSI": "above 50", "MACD": "Bullish crossover", "MA20": "Price position above", "ATR": "Moderate volatility", "Bollinger_Bands": "Price approaching upper band", "Stochastic_Oscillator": "Condition indicates potential pullback", "News_Impact": "Positive", "Historical_Data": "Resistance around $90.00" }, "CURRENT_OPEN_LONG_POSITIONS": 0, "CURRENT_OPEN_SHORT_POSITIONS": 0 }

$Ltcusdt ready for 30% uphello dear TV users, here Im again for 30% banger. Tum to buy it. I can not miss this opportunity.
Eliot wave says buy now and keep it until $89.
LTC Weekly ShortTime to go back to the 1.618, where there is a Retail Trendline.
Lots of liquidity to take.
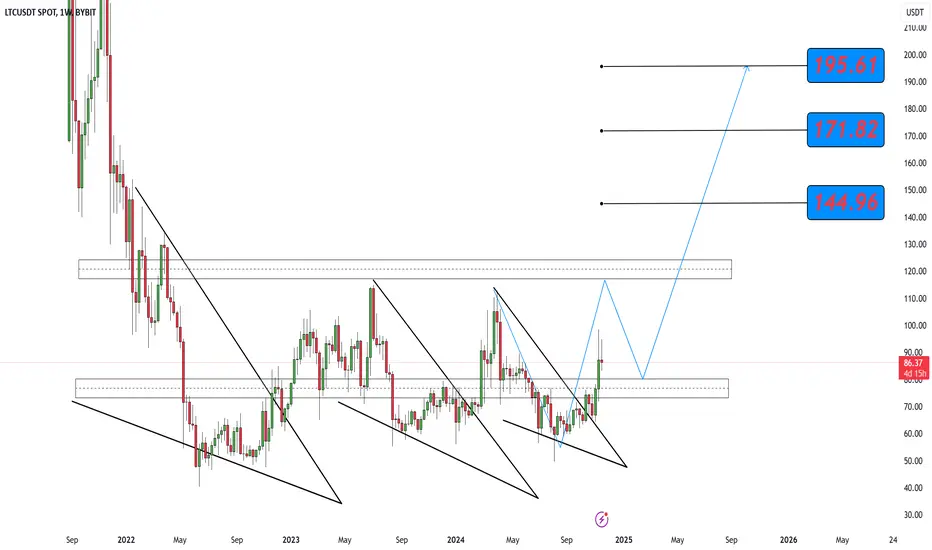
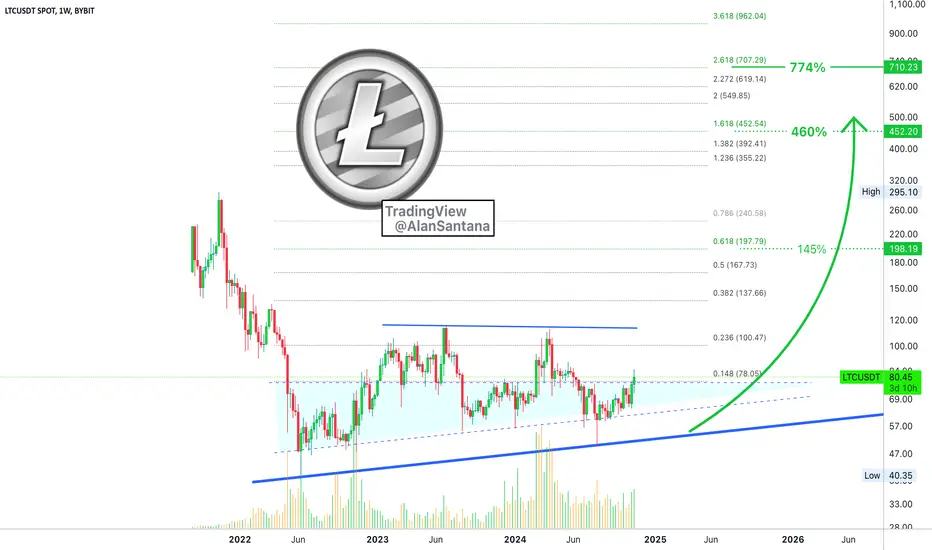
Litecoin Goes Bullish: Accumulation Ended—New 2025 All-Time HighLTCUSDT (Litecoin) is coming out of our long-term accumulation zone, a price range we defined back in August 2024, you can see more below:
✴️ Litecoin Pre-2025 Bull-Market Accumulation Zone & Strategy
Now that Litecoin is out of this massive, long-term price range, we can fully consider the bullish scenario and growth potential.
As you can see here, the market bottom happened June 2022 and a definitive higher low August 2024. Prices grew slowly (accumulation) between August and November, and now we are in the early stages of the bullish zone.
Litecoin is going bullish but it is still early. I say accumulation for long-term is still good below $100, but the best possible prices are now behind us. These can be activated again on a strong swing but likely they won't.
Bitcoin is ultra-bullish and volume is rising for the first time in month. For example, this week LTCUSDT will end up producing the highest buy volume since March 2024, that's eight months ago.
Coming from a recovery wave, 8 months of correction is all that is needed and eight months are now gone. Welcome to the bull-market. Very early; prepare for maximum growth.
Buying should be done in late 2024. Only two months left.
Namaste.
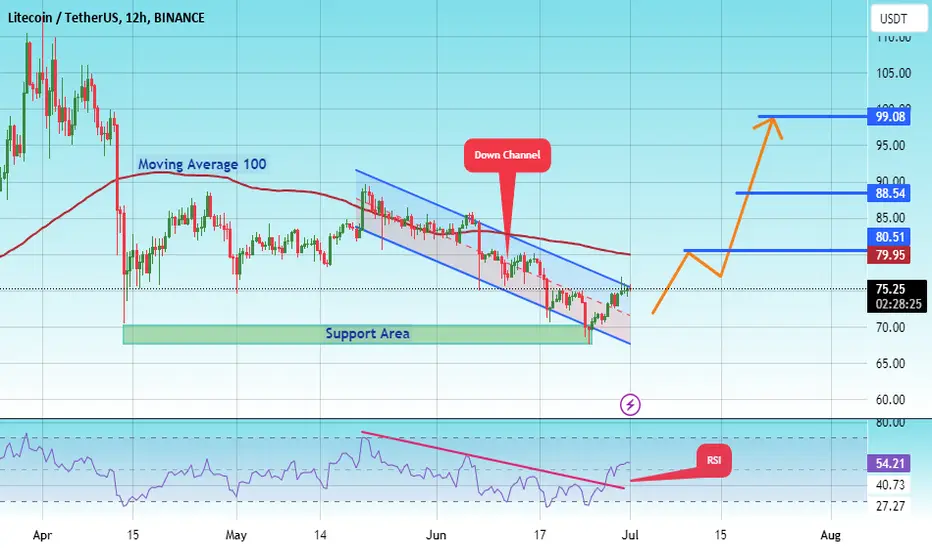
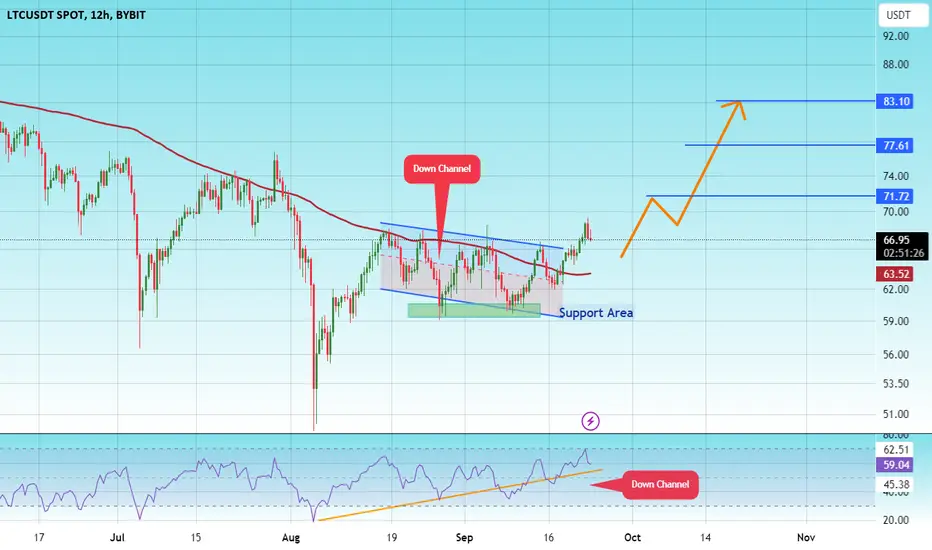
#LTC/USDT#LTC
The price has broken the descending channel on the 12-hour frame upwards and is expected to continue
We have a trend to stabilize above the moving average 100 again
We have an upward trend on the RSI indicator that supports the rise by breaking it upwards
We have a support area at the lower limit of the channel at a price of 60
Entry price 65
First target 71
Second target 77
Third target 83
LTC the black swan?This analysis was done weeks ago and not much has changed. The channel is still valid. But, why has LTC not picked up the pace with the other tokens? BTC is flying, ETH is flying, even DOGE is in a world of it's own. But, LTC which has been one of the 'top 10' for quite some time is not seeing the elevation at all, literally not one bit. We need to see a push here on LTC for it to be considered part of the pack. OR, it's just biding it's time looking like a dead duck but actually has the highest potential of them all. Only time will tell. Follow for more.
SasanSeifi|$85 Breakout Could Propel LTC to $100 and Beyond!Hey there, ✌I In the weekly timeframe, Litecoin’s price, after a period of consolidation around the $84 level, encountered a bearish trend and corrected down to the $50 range.
As you can see, the price has once again moved towards the important resistance zone and the descending trendline. Currently, it is trading at around $78. If the price breaks the key resistance at $85 and stabilizes above it, the likelihood of further upward movement increases. In this scenario, potential price targets could be $100 and $127. The important weekly support between $65 and $60. Given the overall market conditions, the probability of breaking through the resistance level seems high. Note that this chart is presented in a logarithmic scale.
💢 Please remember that this is just my personal viewpoint and should not be taken as investment advice. I’d love to hear your thoughts and share opinions!
Happy trading!✌😎
Sure, if you have any more questions or need further clarification, feel free to ask. I'm here to help!✌

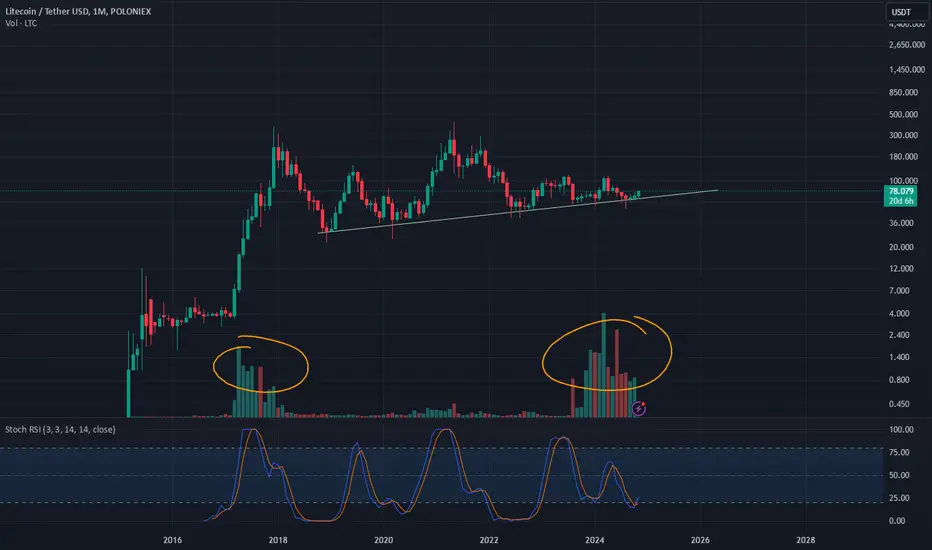
WHY LTC SO INTERESTED <3 1MPOLONIEX:LTCUSDT This ancient monster start to get alive like 2017. Look at the volume on one of the oldest exchange POLONEX. Don't waste this chance to get on this dinosaur :D
Advise for Spot holding,
LTC Underdog: Target 400-500Doing some very basic casual analysis using 20% of my IQ to make this decision, based purely on primitive instinct and rain patterns, after my fire dance, I will be making this obvious-to-a-monkey trade adding to my position from $68 up to here at $77, riding this one out into the Lite
Litecoin shortLitecoin bounced off the upper boundary of descending channel. Asset bounced off the resistance level. Bearish movement to support level 67.3 is expected to happen.
Trend reversal trade setup formingTrend reversal trade setup forming.
I'm using the break of the green down trend as my entry.
risk will be determine later.

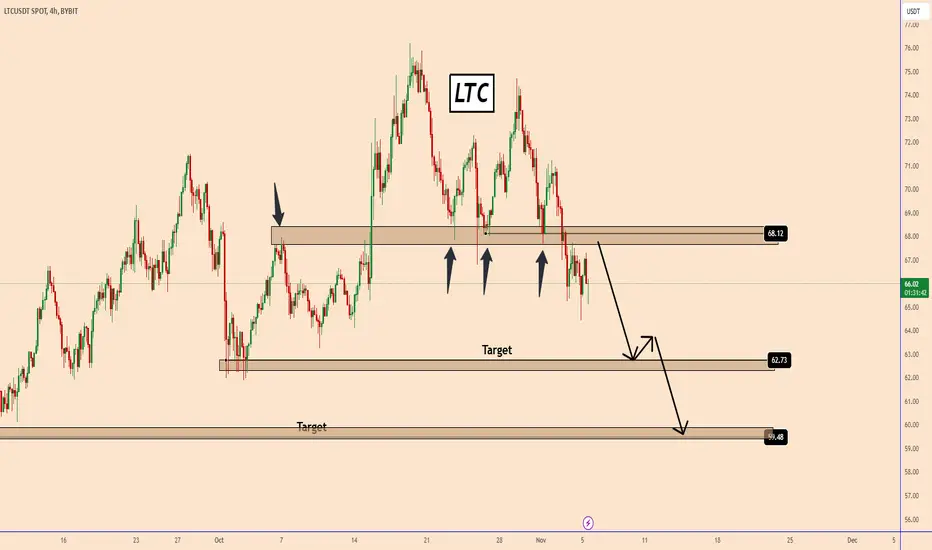
LTC Confirms Bearish Trend and May Reach $60LTC Confirms Bearish Trend and May Reach $60
At the beginning of November 2024, LTC broke down from a strong support zone near $68.00.
The price tested this zone three consecutive times without breaking it, but LTC broke through the support with strong bearish momentum on the fourth attempt.
Currently, the price is taking a pause, but it is expected to resume the bearish movement as long as it holds below $68.00.
If this trend continues, LTC may reach $60.
You may find more details in the chart!
Thank you and Good Luck!
❤️PS: Please support with a like or comment if you find this analysis useful for your trading day❤️
New idea if btc goes up and donald trump wins the presidential election,
C closes higher and we can take 10% profit
LTCUSDT Long Setup Setting / Risky but Why not?BINANCE:LTCUSDT
📈Which side you pick?
Bull or Bear
SL1 ---> Low-risk status: 3x-4x Leverage
SL2 ---> Mid-risk status: 5x-8x Leverage
(If there is just one SL on the chart, I suggest, low risk status)
👾Note: The setup is active but expect the uncertain phase as well. also movement lines drawn to predict future price reactions are relative and approximate.
➡️Entry Area:
Yellow zone: 68.45-66.76
⚡️TP:
69.43
70.50
71.90
🔴SL:
64.89
🧐The Alternate scenario:
If the price stabilize against the direction of the position, below or above the trigger zone, the setup will be canceled.
