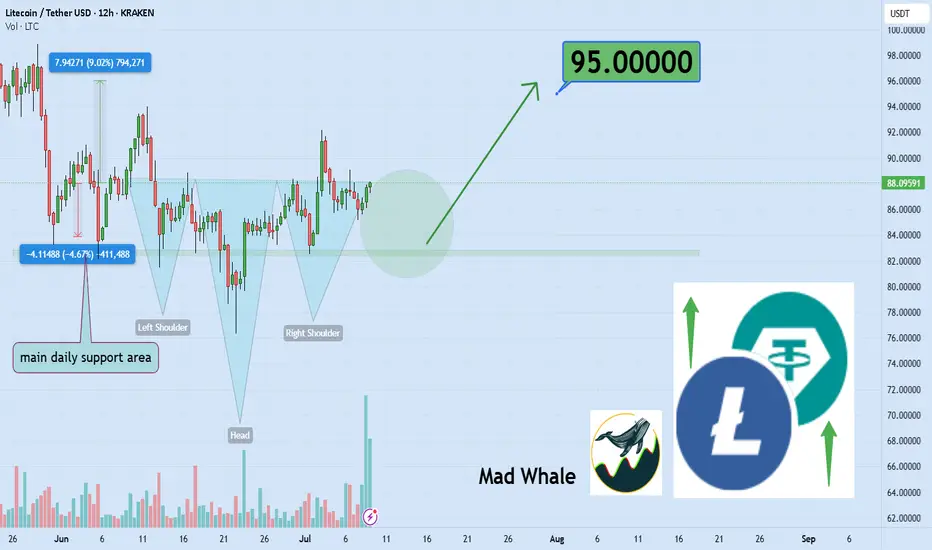
Litecoin Approaches $100 Support, Eyeing 17% Rally to $128Hello✌
Let’s analyze Litecoin’s upcoming price potential 📈.
BINANCE:LTCUSDT is approaching a solid daily support around the key psychological level of $100, which coincides with the 0.5 Fibonacci retracement. Holding this level could open the door for a 17 % upside, targeting $128 near a major daily resistance. Keep an eye on this setup for a potential bounce! 📉🔄
✨We put love into every post!
Your support inspires us 💛 Drop a comment we’d love to hear from you! Thanks , Mad Whale
LTCUSDT trade ideas

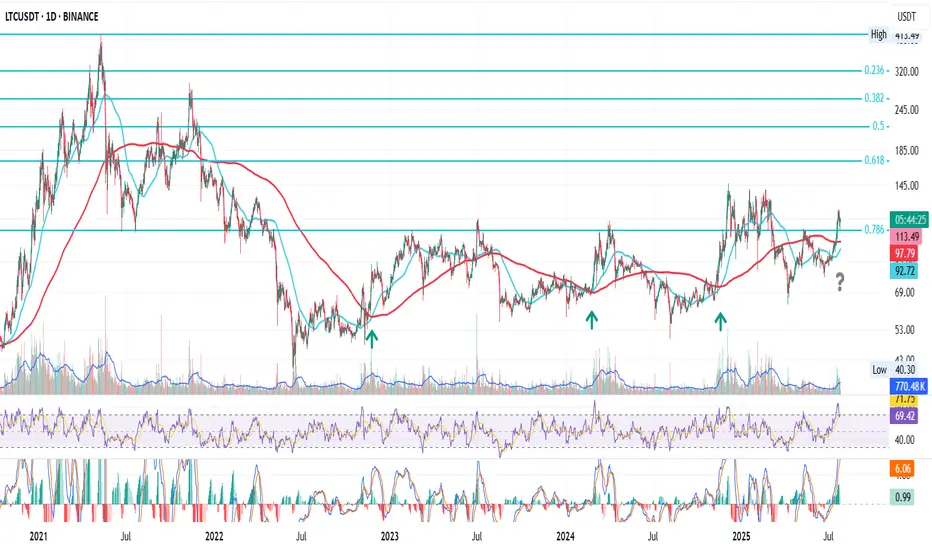
LTC Prepares to Break the CycleThis is LTC on the daily
After the bear market bottom in June 2022, LTC had three golden crosses, each followed by a rally into the 0.786 Fib level.
To be fair, last time price broke above that resistance, but got pushed back — like everything else — by the macro storms earlier this year.
Now we’re approaching another golden cross, but the setup feels different:
1. Price is already holding above 0.786, at least for now.
2. Macro looks calmer, with crypto gaining favorable attention from the SEC, and rate cuts becoming a matter of when, not if.
Putting these together, I lean bullish on LTC price action going forward.
Whatever happens next — we’ll be here to watch it unfold.
Always take profits and manage risk.
Interaction is welcome.
Litecoin (LTC): Still Bullish And Still Good For Long!Well, this video came out a little laggy, as markets were very volatile and had in the background the order book open, but overall we managed to make one TA for you.
We are bullish; it is still good for long as we are about to explode towards the local resistance line most likely—the $150 area.
More in-depth info is in the video—enjoy!
Swallow Academy

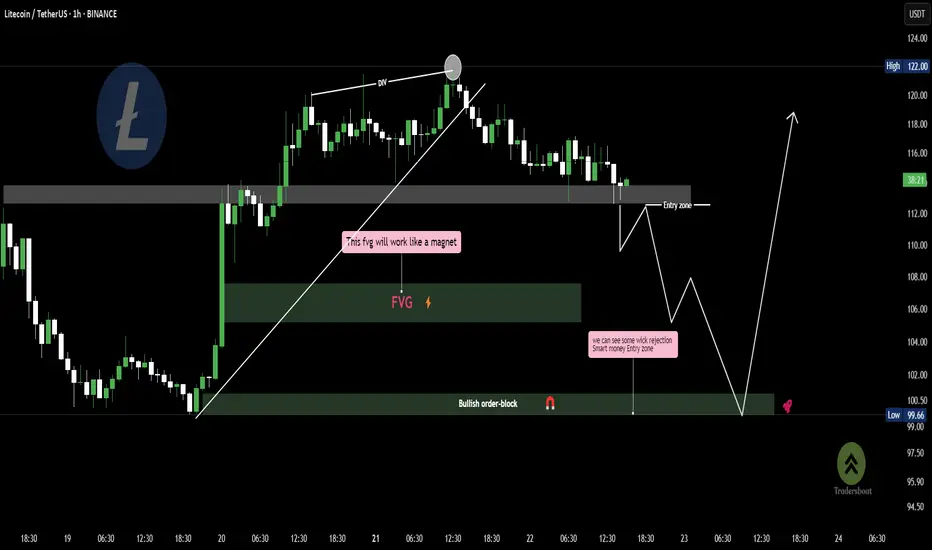
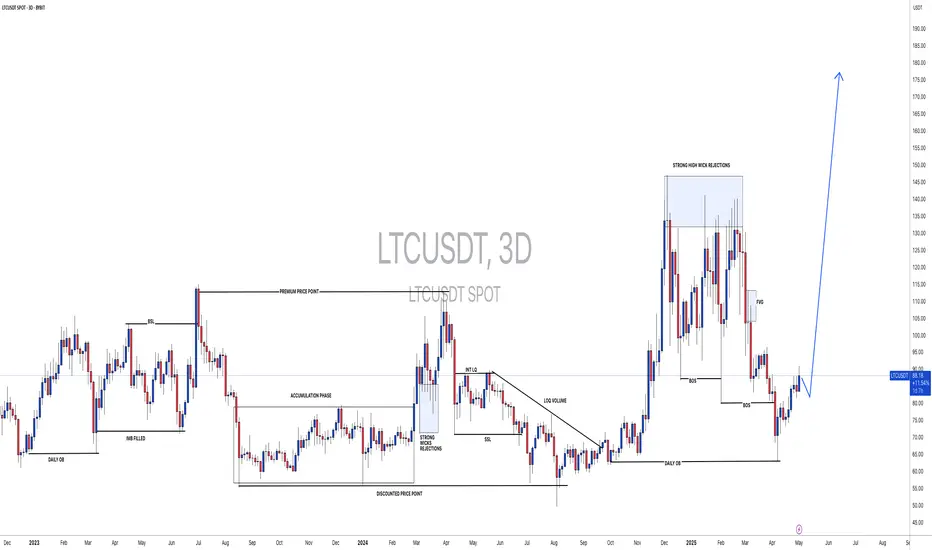
LTC Liquidity play loading.....Smart Money Awaits!🧠 Technical Breakdown:
Divergence signals exhaustion at the highs.
Price is likely to dip into the Fair Value Gap (FVG) — marked as a magnet zone for price attraction.
Expect wick rejections near the bullish order block — this is your smart money entry zone.
The projected move shows a possible liquidity sweep followed by strong upside continuation.
⚠️ This is not a call to enter — it's a reminder: Smart entries are built from trap zones and imbalance plays.
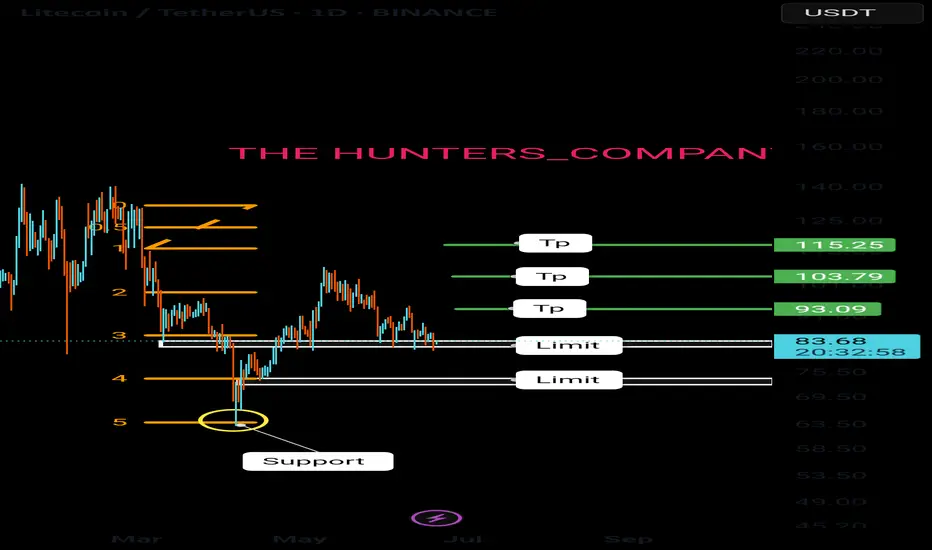
LTCUSDT Short Risking 1% to make 2.22% BINANCE:LTCUSDT Short Swing Trade, with my back testing of this strategy, it hits multiple possible take profits, manage your position accordingly.
This is good trade, don't overload your risk like greedy, be disciplined trader.
I manage trade on daily basis.
Risking 1% to make 2.22% on COINBASE:LTCUSD is good trade, lets see.
Use proper risk management
Looks like good trade.
Lets monitor.
Use proper risk management.
Disclaimer: only idea, not advice

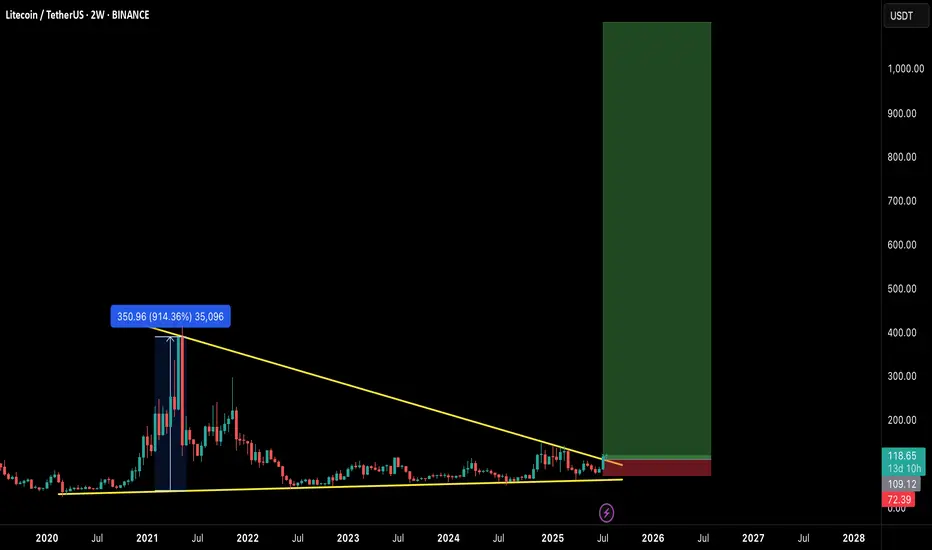
$LTC READY FOR EXPLOSION! THE COMEBACK OF THE OG?Litecoin has quietly formed one of the most massive macro structures in the market — a multi-year falling wedge on the 2-week timeframe, now breaking out with early confirmation.
This could be the start of a generational move, similar to the 2020 breakout. Let's break it down:
🧠 Technical Breakdown:
✅ Falling wedge forming since 2021 — 4 years of compression
✅ Volume and structure support breakout
✅ LTC already gave a 914% rally last time it broke a similar level
📏 Target zone extends above $900–$1000
🛒 Entry Zone:
Current Price: $118
🟢 Buy on breakout or dips near $105–$110 for safer entries
🎯 Target Zones:
TP1: $280
TP2: $400
TP3: $650
TP4: $950+
🛑 Stop-loss:
Breakdown below $72 (last higher low & wedge base)
⚖️ Risk-to-Reward:
High timeframe structure = High conviction play.
Potential R:R > 8x — Rare macro opportunities like this don’t come often.
🧩 Final Thoughts:
LTC may not be the flashiest alt anymore, but this setup is technically undeniable. If BTC enters full bull cycle, LTC could ride the wave explosively.
🔥 This could be a "buy and forget" macro play for 6–12 months.
💬 Let me know your thoughts in the comments & hit that ❤️ if you like macro setups like these!
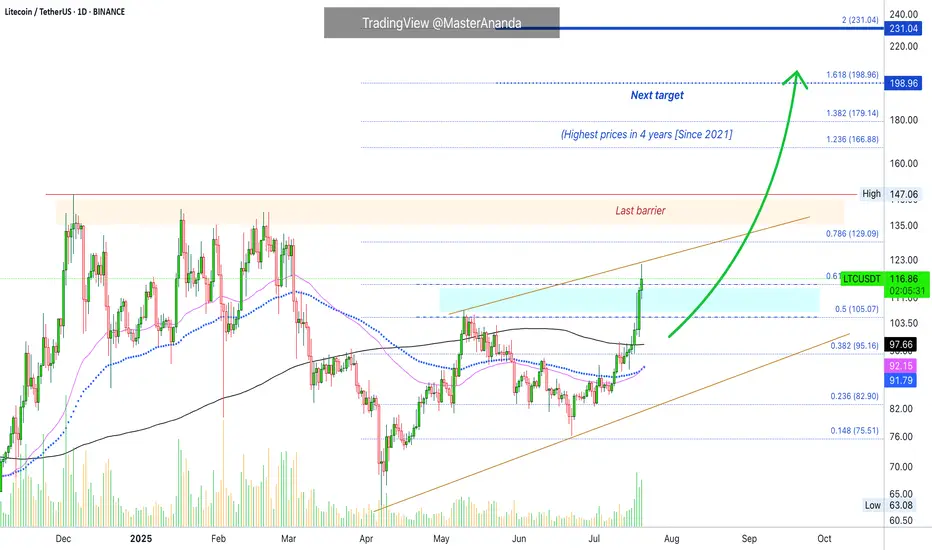
Litecoin's Path Beyond $200 Revealed · Daily TimeframeWe looked at Litecoin on the weekly timeframe which is the long-term picture, but we also need to consider the daily to see what is happening up-close.
As soon as we open this chart we have three signals that stand out:
1) Litecoin is now trading above MA200 safely and rising. This is a very strong bullish development and supports additional growth.
2) Trading volume has been rising significantly being now the highest since February 2025. The difference is that in February we were in distribution, resistance being confirmed with prices set to move lower. In this case, the action is rising from support and volume is rising rather than dropping.
3) May's peak has been broken. Many pairs are still trading below their high in May. Those that broke this level are the ones moving first and this signal exudes strength. Litecoin is now one of the top performers specially in the group with a big market capitalization.
The next barrier is the December 2024 high at $147. Short-term the next target is $129. As soon as the former breaks, we are going to be looking at the highest price since 2021.
Litecoin is fighting resistance today, 0.618 Fib. extension at $115. It is trading above this level but the confirmation only happens at the daily close. If it closes above, bullish confirmed. It if closes below, it means that there will need to be some struggling before higher prices. This struggling can last a few days just as it can extend. Seeing Ethereum and how it is moving straight up, Litecoin is likely to do the same.
Overall, conditions are good for Litecoin on the daily timeframe.
Thank you for reading.
Namaste.
LITCOIN BUY OR SELL !!!Hello friends🙌
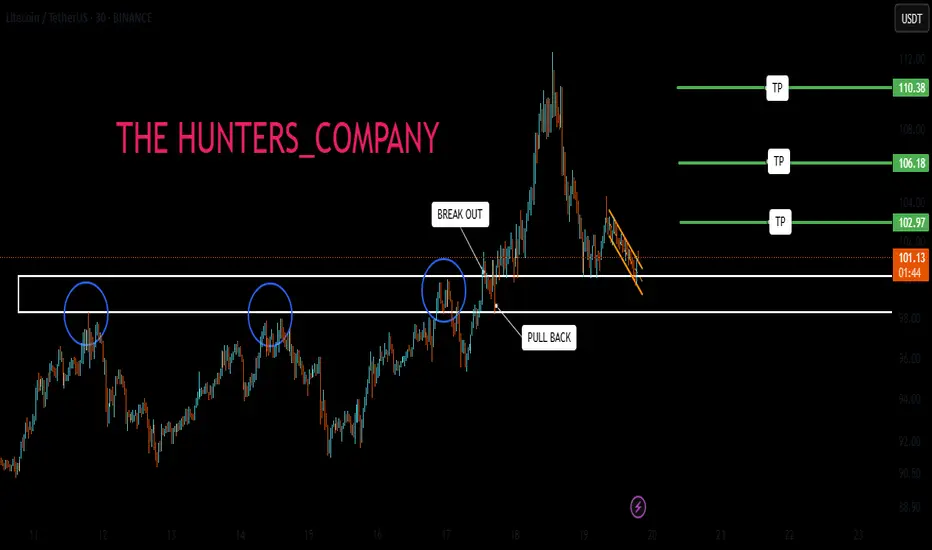
🔊According to the price drop, you can see that the price has been below the specified resistance for a while and when it was able to break the resistance, it shows us the power of the buyers. Now, when we return to the previous resistance, which has now become a support, you can see that the buyers are providing good support and the price is expected to move to the specified targets.
Note that the most important rule in trading is capital and risk management So make sure to follow it.
🔥Follow us for more signals🔥
*Trade safely with us*
Litecoin $1,000 (900%) ExplainedBack in 2020, just 210 days of consolidation led to a 1,623% strong bull market. How much different market conditions we have now. Since 2022, Litecoin has been consolidating. The length of this consolidation is now 1,127 days. More than five times the previous consolidation and then some.
How much higher can Litecoin go compared to a past period?
How much more growth can a project produce when it has been building strength for so long?
LTCUSDT is now trading weekly above EMA55. When this happened back in 2020, what followed was sustained growth. Straight up, literally, for a period of 203 days. No stops.
Back in 2020, Litecoin moved above EMA55 first in August just to be rejected. The second time was the good one. This year the situation is the exact same. Litecoin broke above EMA55 in May and was rejected. The second time is happening now in July and this is the good one.
Litecoin is also trading above MA200 fully confirmed and there is a golden cross between EMA55 and MA200. We are very close to a major marketwide bull-run.
$644 in this bullish cycle is a high probability target for Litecoin, but prices can go higher, much higher because market conditions continue to improve and institutions will gain access to Litecoin through Exchange-Trade Funds (ETFs). This means that a standard price projection would be a disservice to us. We are aiming for $1,000+ on this bullish cycle but it can end up closing higher of course.
After the new all-time high is hit, it is normal to see a correction or even a bear market. This one should be short and small compared to previous ones. See you at 1K.
Namaste.

#LTCUSDT: On The Way To $200, Get Ready For Swing Buy! Hey there!
Evening Everyone,
The price of this crypto is currently in a bullish formation, and it looks like it’s on the rise, potentially reaching $200. The best thing you can do is wait for the price to break out of the downtrend and then keep going up. You could set a target at $150 and then $200, which would be a swing move.
Good luck and trade safely! 😊
Thanks a bunch for your unwavering support! ❤️🚀
If you’d like to lend a hand, here are a few ways you can contribute:
- Like our ideas
- Comment on our ideas
- Share our ideas
Cheers,
Team Setupsfx_
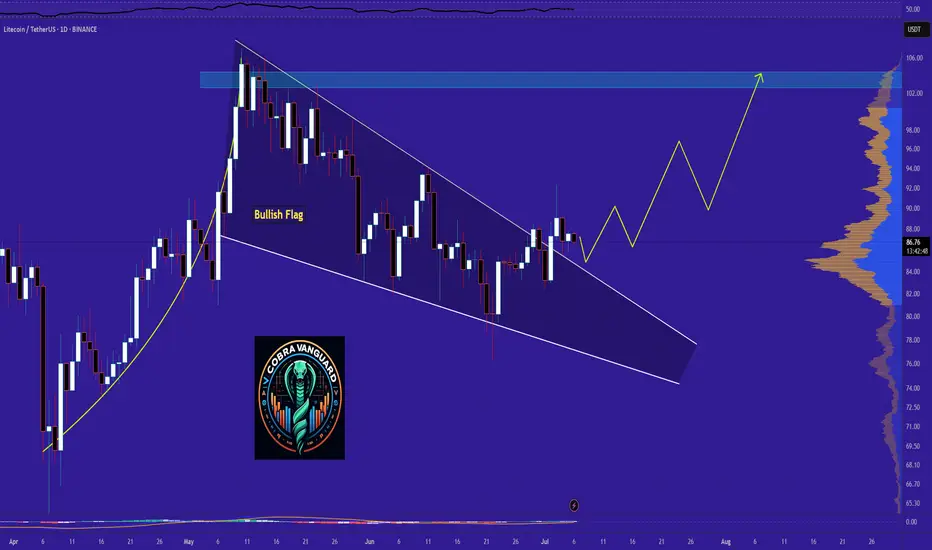
LTC - Time to buy again! (Update)Finally, this pattern was broken and had a positive impact, leading to significant growth. Now, with a slight price correction, higher price levels can be reached.
PREVIOUS ANALYSIS
Best regards CobraVanguard.💚
Litecoin (LTC): Seeing Strong Upside Potential | Bullish TradeLitecoin caught our attention with a nice breakout and buy-side volume dominance, where we are seeing 2 good trades that can be taken, both with a decent R:R ratio.
More in-depth info is in the video—enjoy!
Swallow Academy

LITCOIN : So what is an ETF ?Hello friends
Be careful with the recent fluctuations of this coin because the movements of this coin have become unpredictable and we suggest that if you want to buy, buy in the specified support areas and in steps, of course with capital and risk management...
We have also specified targets for you.
*Trade safely with us*
LTCLitecoin
An open source decentralised digital currency that enables fast and borderless transactions.
Everything is clear on the chart.
I wish everyone abundant profits.
Like and follow
for more.

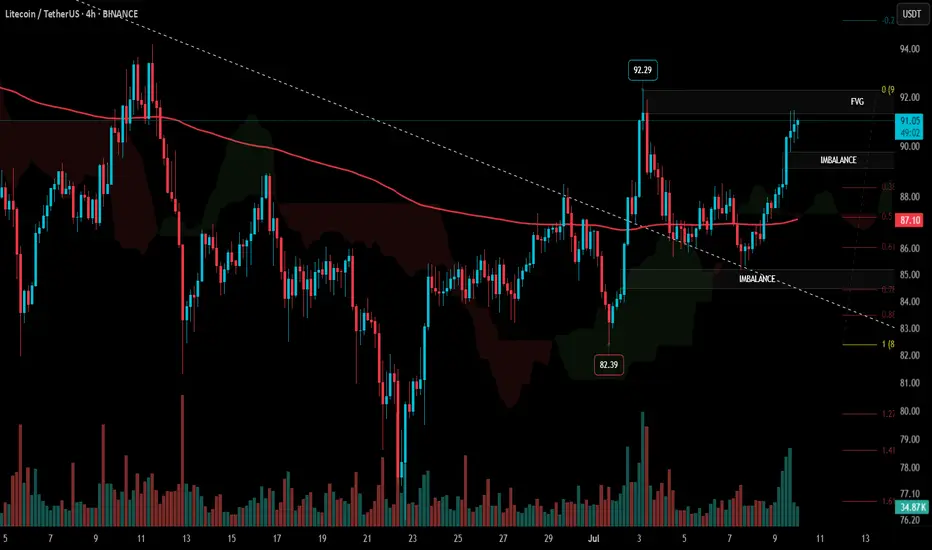
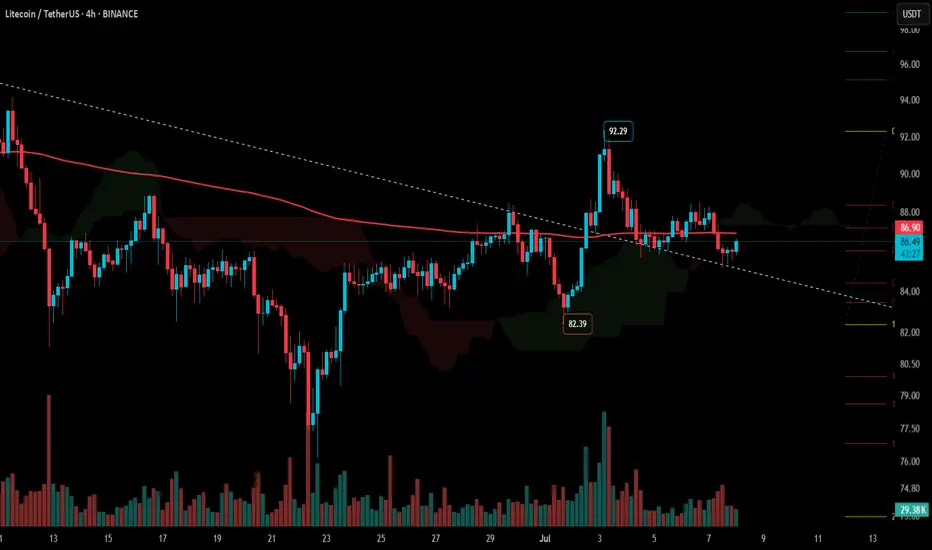
#LTC Update #4 – July 10, 2025🔵 #LTC Update #4 – July 10, 2025
LTC was rejected from the fractal resistance left behind during its previous impulsive move. Just below this level lies an imbalance zone, which is likely to be filled first during any correction. If the downtrend continues, price could move toward $88, $87, and $86 levels.
Currently, long positions seem risky. However, a short setup around $91 with a 3% profit target could be an option for risk-takers. I’m personally not opening any trade at this time, but short-term traders may consider it.
On the upside, LTC is still holding above its 200 MA, which is a positive technical indicator. If it manages to hold above $92.30, the next upside target would be around $95.
LTCUSDThe LTC/USDT pair currently trades at $74.77, positioning itself for notable bullish movements across various timeframes. In the near term, price targets are set around $90.00, reflecting immediate upside potential supported by strong technical signals and market dynamics.
Looking ahead to the medium term, targets extend to the range of $100.00 to $110.00. This forecast is underpinned by robust momentum indicators and bullish patterns suggesting sustained upward momentum.
For the long term, LTC/USDT could aim for $120.00, driven by favorable market conditions and ongoing adoption within the cryptocurrency ecosystem. Further out, targets expand to $150.00 to $180.00 by Q4, illustrating significant growth prospects backed by historical price trends and extended Fibonacci levels.
Investors and traders are advised to monitor key technical indicators, such as the moving average convergence divergence (MACD) and relative strength index (RSI), which affirm bullish sentiment and potential price appreciation. Risk management strategies should be implemented to navigate market volatility and optimize entry points aligned with support levels.
Continued vigilance on market developments and regulatory factors impacting cryptocurrencies will enhance decision-making processes and support strategic investment decisions

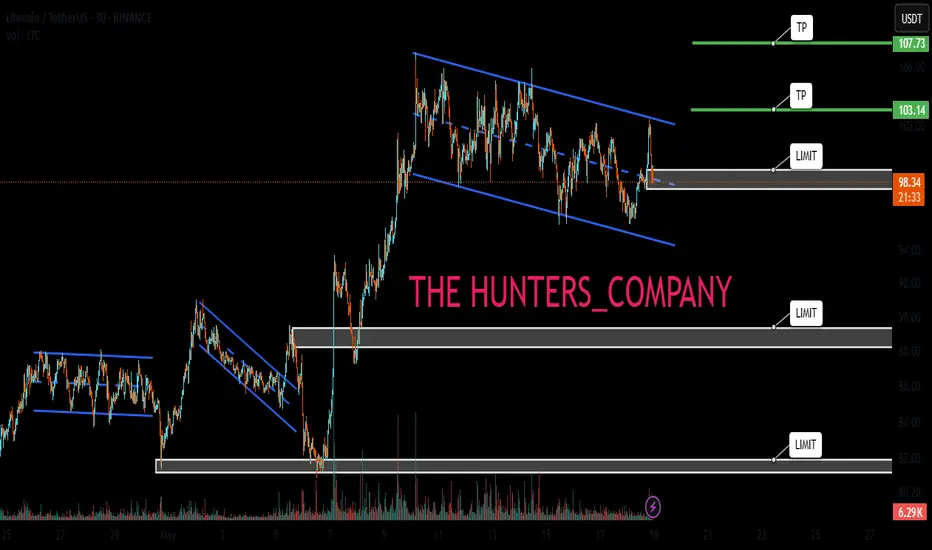
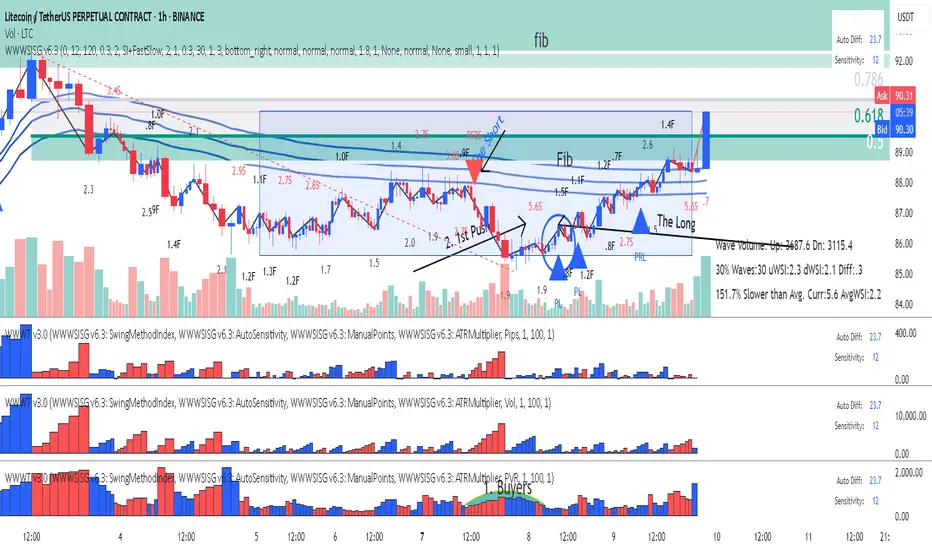
LTC - Litecoin - After the Short the LongAfter the short Signal on the AVWAP line we found buyers at the bottom.
1. PVR mountain shape is the first indication that buyers are coming in.
2. Abnormal SI 5.6 is what I call 1st Push Up.
Finally the entry Plutus signal PL.
You should be careful now because we are crossing Fib 61.8, get you profits sellers might be in that high volume bar. The reaction later waves will be indication if we are going to continue or reverse.
Enjoy Trading the Volume Wave and Speed Index!
Litecoin (LTC): Really Good Buying Opportunity For July 2025 Litecoin has a really good chance to explode anytime now. We noticed a decent uptrend forming so what we are looking for is a break of that trend and full-scale upward movement!
More in-depth info is in the video—enjoy!
Swallow Academy

Your Biggest Trading Enemy Isn’t the Market It’s YouWhy do traders get liquidated right at the peak of confidence?
Is capital safety defined by charts or by our inner world?
Let’s dig deeper. The real threat doesn’t come from the market. It comes from within.
Hello✌
Spend 3 minutes ⏰ reading this educational material.
🎯 Analytical Insight on Litecoin:
BINANCE:LTCUSDT has recently formed a reliable inverse head and shoulders pattern near a strong support zone 📉. This technical setup indicates a potential upside of approximately 9%, targeting $95 in the near future 🚀. Traders should watch for confirmation and manage risk accordingly.
Now , let's dive into the educational section,
🧠 The Mind: The Most Dangerous Indicator in the Market
Before the market empties your wallet, it hijacks your mind.
You may think you’re entering a trade using your indicators, but more often than not, it’s your emotions pushing the buttons. Tools are just the excuse.
When you feel absolutely certain and think this time is different, that’s when you’ve probably entered the danger zone. The market thrives on exploiting emotional certainty.
Truth is, many losses come not from poor analysis but from repeating bad decisions out of anger, revenge, or stubbornness. If you don’t protect yourself from your own behavior, no strategy can protect your capital.
🧨 Overconfidence: The Greatest Liquidator
One of the most destructive feelings in trading is confidence without validation
After a few consecutive wins, your brain flips the switch and you feel invincible
Overconfidence tricks you into skipping stop-losses, overleveraging, ignoring timeframes, or ditching your strategy altogether. The end result is all your hard-earned profits vanish in a single emotionally-driven trade.
Confidence should be earned trade by trade, not assumed after a few lucky runs.
📉 TradingView Tools: Real Support or Mental Trap?
Let’s be real. Tools are powerful only if used with clarity
Try the Bar Replay feature to stress-test your setups without live risk
Use the Long Short Position tool to visualize your actual risk reward, not the one your ego wants to see
Set Alerts so that your entries are data driven, not emotion driven
These tools are your allies. But just like a sharp knife, they can cut the cook too. The problem isn’t the tool. It’s always the hand using it.
🪤 If It Feels Right, It’s Probably a Trap
One of the most common cognitive biases traders face is mistaking emotions for data
You might see price touch support, but deep down, you’re still haunted by that last failed bounce, so this time, you enter out of revenge. Or maybe everyone online is screaming pump and FOMO kicks in
At that moment, you’re not thinking. You’re gambling
The market doesn’t care how you feel. It only cares whether you’re reacting emotionally because that’s the easiest liquidity
🧩 Not Trading Is a Trade
Especially in crypto, traders with patience often outperform those who force constant action
Someone who watches charts for three days without entering may end up ahead of the one jumping into five trades a day
Discipline in waiting is a skill. Sometimes, the most profitable decision is simply doing nothing
Pro traders strike rarely but with precision. The rest is surveillance, not execution
🧠 Good Trading Means Being Rational in the Moment
Here’s what separates losers from winners
Losers make a decision and then look for justification
Winners seek solid logic then make a decision
If your mind is unstable, even the best setup can lead to chaos
But a clear mind can extract gold from even the simplest charts
🧬 Final Thought
If you're serious about protecting capital, start with protecting your mindset
Open positions, stop losses, and chart entries matter, but without internal stability, none of them will save you
In truth, the riskiest place for your capital is not the market. It’s you
✨ Need a little love!
We pour love into every post your support keeps us inspired! 💛 Don’t be shy, we’d love to hear from you on comments. Big thanks , Mad Whale 🐋
📜Please make sure to do your own research before investing, and review the disclaimer provided at the end of each post.
#LTC Update #3 – July 8, 2025🔵 #LTC Update #3 – July 8, 2025
Litecoin continues its correction following the latest impulsive move. A strong resistance awaits at the $87.20 level, and breaking through it won't be easy. If price manages to close above $88.50 , a potential move toward the $92 zone may follow.
On the downside, if Litecoin pulls back below $82 , the next likely stop is around $77 . At this stage, I do not recommend opening any long or short positions. Observing the market is the better approach for now.
Litecoin:Is the main climb coming?hello friends👋
As you can see, the price, after falling in the support area specified by the buyers, has been supported and returned, forming an upward pattern.
Now we don't enter into a transaction with just one pattern, we also check the entry of buyers and the amount of currency and other factors and draw conclusions.
According to the points we have said, we have identified very important support points for you to buy step by step with capital and risk management and move to the specified goals.
🔥Follow us for more signals 🔥
*Trade with us safely*
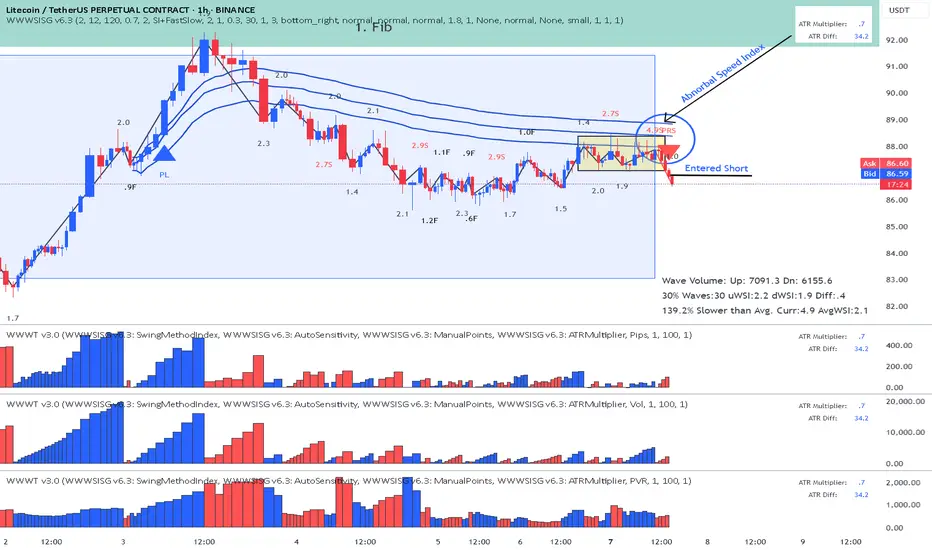
LTC- Litecoin Entered Short Reading the chart this is the story:
1. We had Significant Fib location where we found sellers visible at the top- the reaction after the up wave a large down wave.
2. Placed AVWAP at the beginning of the up-wave and waited for the price to cross downwards and the pull back so that AVWAP will act as resistance.
3. Pull Back to AVWAP came after some time
4. Price never breaks AVWAP upwards and it has hard time to move up - Abnormal SI of 4.9
5. Finally waited for a Plutus short signal and in this case it was a PRS.
Stop above AVWAP center line target at least 1:1.5
Enjoy!
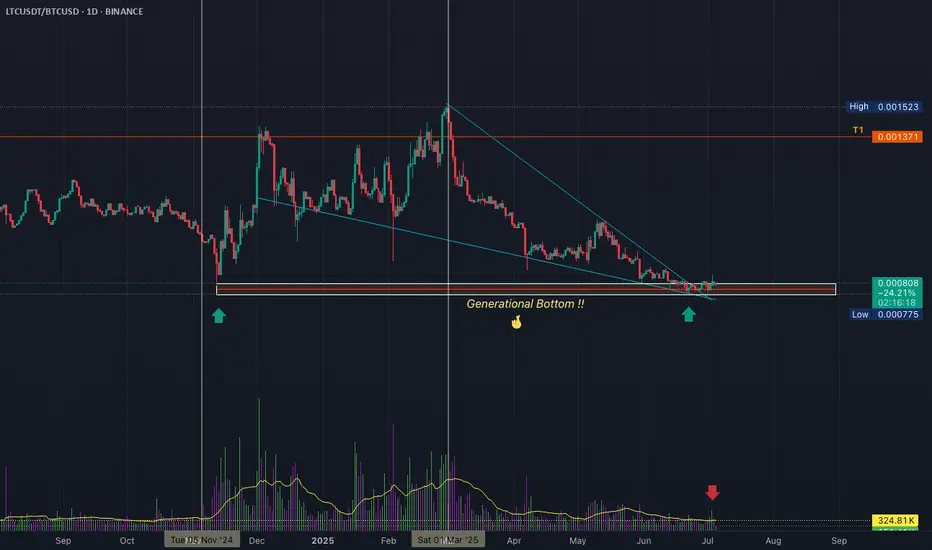
LTC, he Hidden Strength Beneath the Retrace Ma dudes, we might just be witnessing something big and beautiful here. 🤌✨
Okay okay, I might sound like a total degen, but hear me out:
✅ Double bottom (check those two green arrows)
✅ Bullish divergence on the RSI
✅ MACD on the monthly just crossed bullish — for the first time ever on this pair!
✅ OBV stayed strong, didn’t collapse even during that nasty monthly retrace
✅ Notice how volume was climbing during the uptrend, but fell off during the retrace? That means the drop lacked real conviction.
We’re also sitting at an ATL (all-time low) — the lowest we've been.
Check out that red arrow pointing at the volume: that's the first sign of a burst. The next bursts? 💥 They should be explosive.
…And that’s just to name a few.
See you somewhere up there 🚀 — once we break through that T1 level, we should start trending higher fast.
That's it, that's the idea" - Good night !