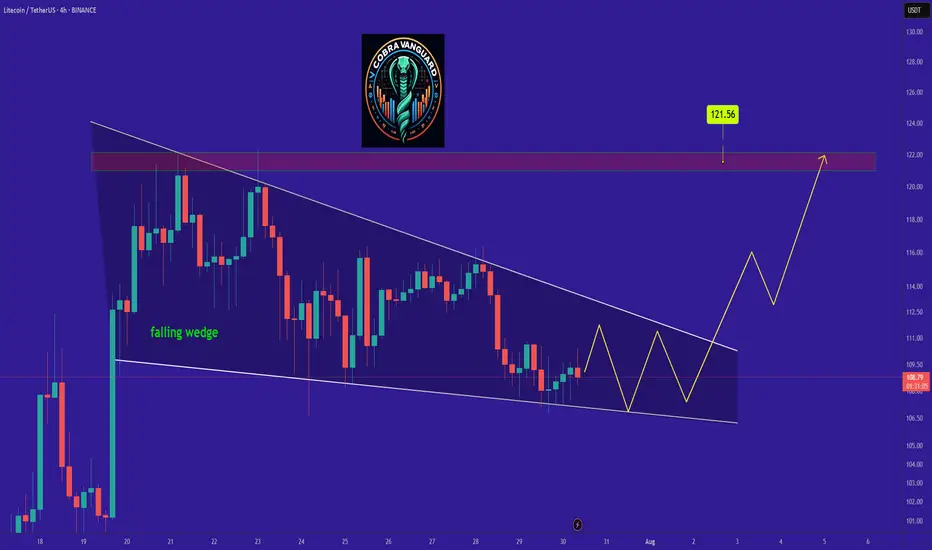
LTC is bullish now and many Traders don't see itSo if you pay attention to the LTC chart you can see that the price has formed a Ascending wedge which means it is expected to price move as equal as the measured price movement.( AB=CD )
NOTE: wait for break of the WEDGE .
Best regards CobraVanguard.💚
LTCUST trade ideas
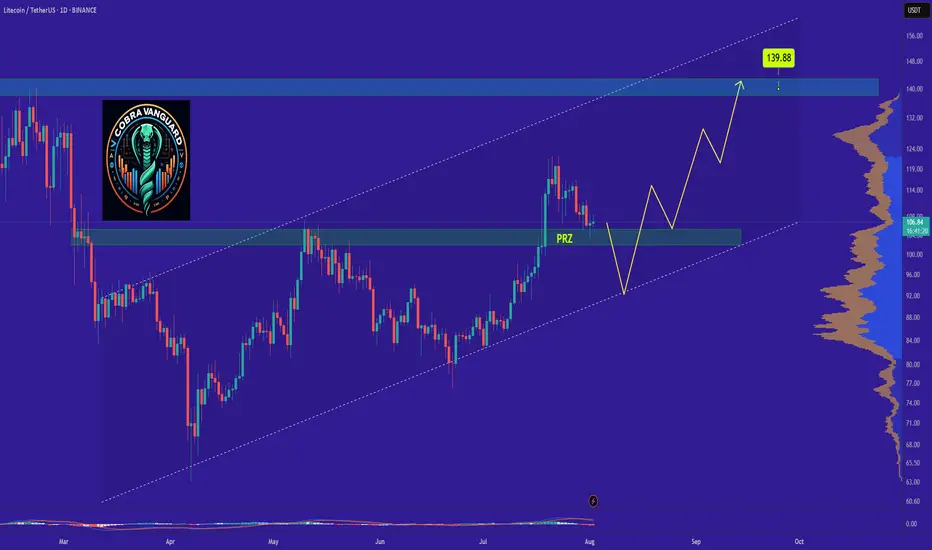
LTCs Situation (Daily) !!!If the price loses the PRZ range, it will drop to the bottom of the channel and then rise to the top of the ascending channel, which will take some time.
Best regards CobraVanguard.💚
Litecoin (LTC): Bearish until Fill of CME | After That We Buy Litecoin is under pressure by sellers, and we might be heading toward that bearish CME gap. Multiple trades that can be taken so keep your eyes wide open!
More in-depth info is in the video—enjoy!
Swallow Academy

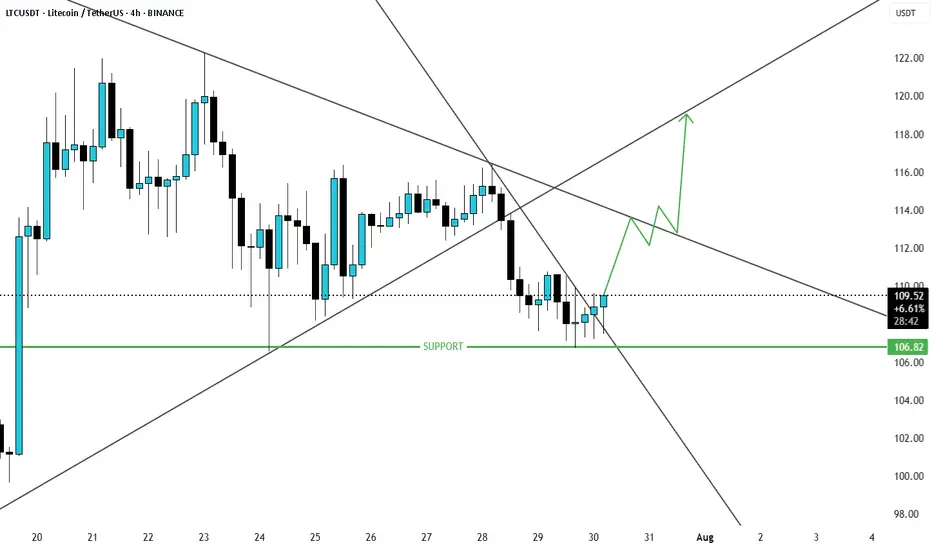
LTCUSD Possible Scenario breakout of trendline resistanceLTCUSD is at major support and has now broken the resistance and price will likely will move up.
LTC- LitCoin - This is how a Fake Break on Fib looks like This is how a Fake Break on Fib looks like using Weis Wave with Speed Index
Reading the Daily Cha rt
1. Fib Location - Sellers could enter here
2. Largest Up volume wave after a while - also sellers could be hidden in there.
3. Increasing PVR (progressing volume rate) = as we approve the top more volume comes in (sellers)
4. This up wave has the highest Speed Index 10.0S of all the up waves in the trend, that's a HTMU (hard to move up = sellers)
5. The highest PVR bar =sellers
6. Another Abnormal Speed Index 25.5 S - that's another HTMU = more sellers on the up move, price cannot progress upward anymore.
7. and finally down we go with a PRS signal.
All the ingredients for the Short were there. Reading Weis Wave with Speed Index is like reading a book, page after page, until you reach to the last page that the writer has kept the surprise, the only difference is that this is never ending chart book with many stories. This was the story of LTC for now. I think this story has not ended yet and continue to drop to another Fib, the details on the 1HR!.
I hope you enjoy this chart reading lesson using Weis Wave with Speed Index.

Litecoin Hits a New High · Update · Highest Price in 5 MonthsToday Litecoin hit its highest price in more than five months, since March 2025. Soon Litecoin will break its December 2024 high and produce the highest prices since the last bull market, 2021. We are getting very close now.
A few weeks back the market was in a similar situation, doubt started to creep in and people wondered if the market was set to endure a long-term correction or resume higher. We used Bitcoin Cash which was moving ahead to prove the rest of the market would do the same and it happened as predicted. Before Bitcoin Cash, further back, we used XRP and it worked.
Today we are looking at Litecoin and the action this chart is showing matches additional growth. While some pairs are retracing or consolidating, others continue to move ahead. This only happens in a bull market, and, when Bitcoin retraces while the altcoins continue to grow, this is a sure sign that the bulls are buying and the market expects additional growth.
Additional growth but remember retraces will always be present along the way. The market grows steadily but it takes time. Five steps: three steps forward, two step back. Allow time for variations. Retraces and corrections are an opportunity to rebuy and reload.
Secure profits when prices are up; buy back at support.
Sell when prices are high; sell when the market is green.
Sell when everything feels fine and great.
Buy when prices are low; buy when the market is red.
Buy when everything feels down and depressed.
Go against the market impulse. Make your decisions based on information. The market is growing and set to continue growing long-term. Choose wisely and let the market take care of the rest.
Namaste.

Litecoin (LTC): Aiming For $145 Area Before Potential CorrectionLitecoin looks good for potential upside movement here, although trades are not the best to take but we definitely see a good shorting opportunity appening soon.
More in-depth info is in the video—enjoy!
Swallow Academy

Litecoin Looks Ready – Breakout or Fakeout!Hello Traders 🐺
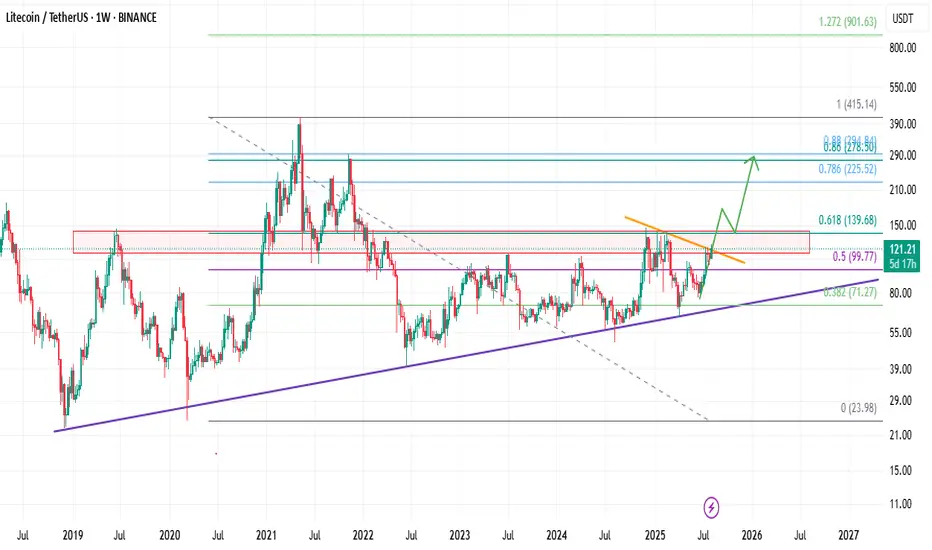
As you can see on the weekly chart, price is trying to break above the resistance line, which is in alignment with the red weekly resistance box and the 0.618 Fibonacci level.
Long story short:
If price manages to push above the 0.618 level — which is a very important resistance — we could expect a higher price target around the all-time high level at the 0.786 Fib zone.
And as always my friend, remember:
Discipline is rarely enjoyable, but almost always profitable.
LTCUSDT sleeping giantLTC was consolidating for a long period of time, and ready to blast off soon.
Targets are on chart.
DYOR
NFA

LTC Wakes Up — Bullish Adam & Eve Targets $150+LTC is gaining serious momentum, breaking through key resistance levels and printing a clean Adam & Eve bullish reversal pattern. The breakout signals a potential shift in the macro trend — and the chart is offering clear setups.
✅ Breakout Through $100 & Pattern Confirmation
LTC confirmed the Adam & Eve double bottom with a breakout above $100, a major psychological resistance.
The neckline retest around $105 acted as a Market Structure Shift (MSS) confirmation, with upside wicks signaling strong demand and a reversal.
$100–$105 Support Zone: Stacked Confluence
This zone offered a high-probability long setup due to multiple overlapping technical factors:
Yearly Open (via DriftLine - Pivot Open Zones ): $103.28
0.382 Fib Retracement: $104.67 (from $76.17 low to $122.29 high)
Anchored VWAP from the $76.17 low
POC of 1-Year Trading Range: ~$102
233 EMA & SMA (4H TF): Both moving averages aligned between $103–$100, acting as dynamic support
✍️ A clean, high-confluence demand zone between $100–$105 — ideal for long setups.
Upside Structure & Next Long Opportunity
➡️ Current Price: ~$127
A fresh long setup may present itself around $120 on a pullback
➡️ Pattern Target: $150
🌀 1.0 TBFE: $149.28
🌀 1.618 TBFE: $147.31
🔺 Key Swing High / Liquidity Pool (BSL): $147–$150 — an area to watch for possible rejection
🔴 Short Setup Consideration
➡️ Short zone: $147–$151
Only short on clear confirmation: SFPs, rejections, or bearish order flow
➡️ Downside target: $135 (1:2 R:R potential)
Macro Bullish Target: $198–$200
If LTC breaks and holds above $150, the next macro target becomes:
🌀 0.618 Fib Retracement (from $295.7 high to $40.3 low): $198.14
$200 Psychological Resistance: Major round number, likely to act as magnet and profit-taking zone
🛠 Indicators Used:
DriftLine — Pivot Open Zones
↳ For key levels like the Yearly Open, crucial in confluence stacking
📚 Educational Insight: Understanding the Adam & Eve Pattern
The Adam & Eve pattern is a classic bullish reversal formation that often marks the end of a downtrend or a major correction phase.
Adam forms first: a sharp, V-shaped low — often panic-driven or capitulation.
Eve follows: a rounded, more gradual bottom, showing accumulation and stabilisation.
Once price breaks above the neckline, the pattern is considered confirmed.
A retest of the neckline (like LTC at ~$105) is often the best entry point, especially when supported by confluence like Fib levels, VWAP, or key levels.
In LTC’s case, the breakout above $100 and successful retest at $100–$105 validates the pattern — with a measured move pointing toward $150, and a macro Fib target at $198.14 aligning with the $200 psychological level.
Summary:
With a confirmed breakout, strong technical confluence, and clearly defined targets, LTC is setting up for continuation. Watch $120 for long entries and monitor $150 for potential rejection.
_________________________________
💬 If you found this helpful, drop a like and comment!

LTC/USDT- Mega classic box Litecoin (LTC) has spent the last three years forming a textbook accumulation pattern, specifically a classic horizontal box range, with key support around the $100 zone acting as a historical floor. This level has held through multiple bearish cycles, showing strong buyer defence and accumulation interest from long-term holders and institutions.
After a prolonged consolidation, bullish momentum is emerging, as evidenced by:
Breakouts above mid-range resistances with volume
Successful retests of the $100 level confirming it as solid support
Emergence of higher lows and bullish structure on the weekly chart
LTC/USDT Robbery Underway | Bullish Setup, Get In Now!🔥💎 LTC/USDT HEIST PLAN: ROB AT ANY PRICE! 💎🔥
🚨 Bullish Move Incoming | Layered Entries | Thief Trader Exclusive 🚨
🌟Hi! Hola! Ola! Bonjour! Hallo! Marhaba!🌟
Dear Money Makers & Market Robbers, 🤑💰💸✈️
The time has come for another high-stakes Thief Trading heist, and this time we're lockin' in on LTC/USDT – aka "Litecoin vs Tether" 💣💸
🎯 Thief’s Mission Plan: BULLISH AT ANY PRICE LEVEL!
We're going full stealth mode with a layering strategy — stacking multiple limit orders like a true pro thief preparing for a clean escape! 🔪📉📈
🚪 ENTRY: "Anywhere, Anytime" 🚪
📈 Buy from any price level — but for optimal entry:
🟢 Use Buy Limit orders near recent lows (15-30 min TF)
🔔 Don’t forget to set alerts for breakout confirmation!
🛑 STOP LOSS: Strategic Defense 🛑
🗣️ "Listen up, team! Stop loss ain’t a maybe — it’s your armor. Place it smart, or prepare for pain." 🔥
📍Recommended SL: 100.00
🔐 Adjust based on your lot size & how deep you stack your orders.
🏁 TARGET: 130.00 🏁
💸 But always Escape Early if the plan gets too hot!
Use a Trailing SL to lock in gains and slip out clean 😎🧨
🧠 PRO TIPS from the THIEF:
🔎 Only Buy. No Shorting!
💣 Scalpers: Jump in with the trend, not against it.
🧲 Swing Traders: Stay patient, and execute the full heist.
🚀 Use Trailing Stops – Let profit ride, but stay protected!
📢 MARKET INSIGHT:
🔥 Bullish Bias backed by:
✅ On-Chain Metrics
✅ Sentiment Shifts
✅ Macro Flows
✅ COT Reports
✅ Intermarket Divergence
⚠️ TRADING ALERT: Stay Sharp!
📰 News Events = Volatility.
💡 Avoid fresh entries during high-impact events.
📉 Use Trailing SL to secure your running trades.
💖 SUPPORT THE CREW 💖
🚀 Smash that Boost Button if you believe in the Thief Style Strategy
👑 Let's rob the market together, one level at a time.
🧠 Stay sharp, stay sneaky – and I’ll see you at the next target 🎯
— Thief Trader 🐱👤💰🚁🌍

LTC long turm Accroding to VSFA+ A.o.A All
Accroding to VSFA+ Strategy, LTCusdt long trum dump expected

Litecoin Approaches $100 Support, Eyeing 17% Rally to $128Hello✌
Let’s analyze Litecoin’s upcoming price potential 📈.
BINANCE:LTCUSDT is approaching a solid daily support around the key psychological level of $100, which coincides with the 0.5 Fibonacci retracement. Holding this level could open the door for a 17 % upside, targeting $128 near a major daily resistance. Keep an eye on this setup for a potential bounce! 📉🔄
✨We put love into every post!
Your support inspires us 💛 Drop a comment we’d love to hear from you! Thanks , Mad Whale

#LTCUSDTDate: 03-08-2025
#LTCUSDT - Current Price: 109
#LTCUSDT Pivot Point: 107 Support: 104 Resistance: 110
#LTCUSDT Upside Targets:
Target 1: 113
Target 2: 117
Target 3: 120
Target 4: 124
#LTCUSDT Downside Targets:
Target 1: 100
Target 2: 97
Target 3: 93
Target 4: 89
#Crypto #Bitcoin #BTC #CryptoTA #TradingView #PivotPoints #SupportResistance
#TradingView #Nifty #BankNifty #DJI #NDQ #SENSEX #DAX #USOIL #GOLD #SILVER
#BHEL #HUDCO #LT #LTF #ABB #DIXON #SIEMENS #BALKRISIND #MRF #DIVISLAB
#MARUTI #HAL #SHREECEM #JSWSTEEL #MPHASIS #NATIONALUM #BALRAMCHIN #TRIVENI
#USDINR #EURUSD #USDJPY #NIFTY_MID_SELECT
#SOLANA #ETHEREUM #BTCUSD #MATICUSDT #XRPUSDT #LTCUSDT

LTC Forms Triangle Pattern Signaling Potential BreakoutLTC is currently forming a triangle pattern on the 4-hour time frame. A break of the upper trend line may indicate an exit from the support zone. Based on historical dynamics, such breaks often lead to upward momentum with a higher probability.
Current price: $108.12
With a higher probability, the price can reach the marks of $111 to $115
The price can also touch the lower marks of $105.4
This analysis is based on the technical pattern and also incorporates AI to provide more accurate results.

473$$$LTC/USDT Technical Analysis: Bullish Breakout Targeting $473.17
This chart presents a long-term bullish forecast for Litecoin (LTC/USDT) on the 2-week timeframe. The analysis suggests that LTC is on the verge of completing a multi-year consolidation pattern, with a potential for a significant upward price movement.
Key Observations:
Macro Symmetrical Triangle: The chart highlights a massive symmetrical triangle pattern that has been forming for approximately seven years (from 2018 to 2025). This pattern is defined by a descending trendline connecting the major highs and an ascending trendline connecting the major lows, indicating a long period of price contraction and energy accumulation.
Bullish Breakout: The analysis projects a breakout from the upper resistance of this triangle around mid-2025. A breakout from such a long-term consolidation pattern is considered a powerful bullish signal, suggesting the end of the sideways/downtrend and the beginning of a new major rally.
Price Target Activated: The primary target for this bullish move is set at $473.17. This price level corresponds to the historical all-time high of May 2021. After a major pattern breakout, it is common for price to target previous significant highs where "buyside liquidity" is presumed to rest. The text "473 target activated" implies that the breakout event is the trigger that sets this price objective in motion.
In summary, the chart illustrates a scenario where LTC breaks out of a multi-year consolidation, leading to a powerful rally with the ultimate target of reclaiming its previous all-time high of $473.17.

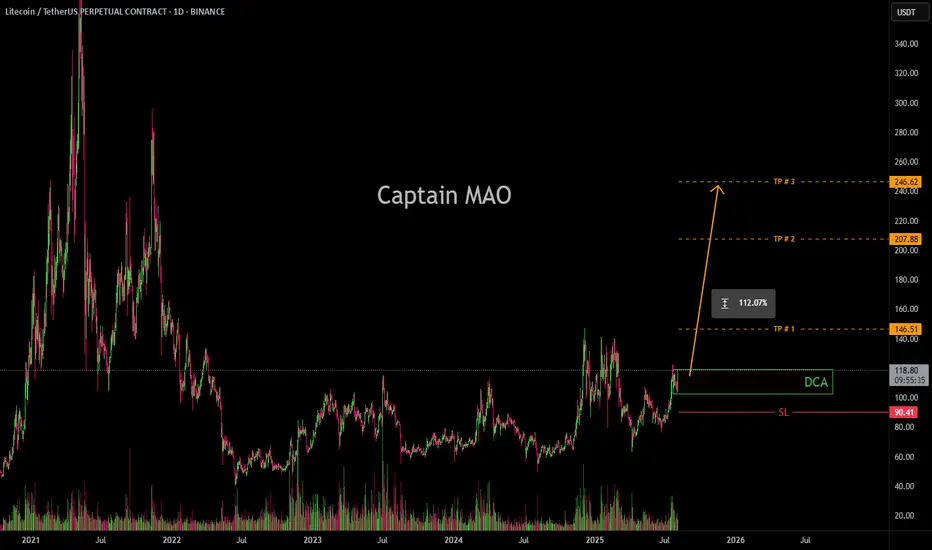
Litecoin (LTC) – Re-Entry After 44% RallyLTC rallied over 44% since our last trade setup. Now, we’re looking for a re-entry opportunity as the broader crypto market shows signs of a potential pullback.
🔍 Setup Overview:
Entry Zone: $108 – $103
Take Profits: $125 / $140 / $150
Stop Loss: Daily close below $100
Bias: Bullish continuation (as long as structure holds)
🧠 Trade Idea:
Expecting a possible sweep of the $104 low before upside resumes. Key condition: Daily candle must not close below $100—wicks are fine. If price respects this level, the bullish structure remains intact.
This is a classic liquidity grab scenario. Entering in the $108–103 zone allows favorable risk-to-reward if LTC catches support and reclaims momentum.
⚠️ Invalidation:
If LTC posts a daily close below $100, trade setup becomes invalid. Monitor price action closely around this key support zone.

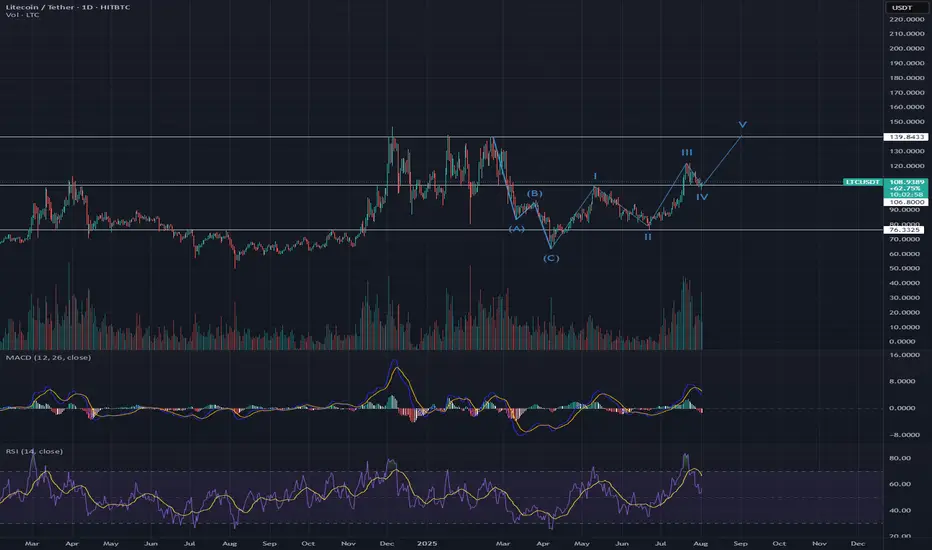
LTCUSDT | Daily Chart Analysis | Bullish Structure UnfoldingLTCUSDT | Daily Chart Analysis | Bullish Structure Unfolding
🔍 Let’s break down LTC/USDT’s technical setup, focusing on volume, Elliot Wave structure, and key target levels for this bullish scenario. If you're following this channel, be sure to react and let us know your thoughts on the roadmap!
⏳ Daily Overview
LTCUSDT is moving within a defined ascending channel, supported by increasing bullish momentum and clear Elliot Wave progression. The recent wave count points to a textbook impulse, setting up the next key move.
🔺 Long Setup:
The market has completed Waves (1) through (4), and we’re now looking at the development of Wave (5) to the upside.
- Wave (5) Target Zones:
- $130.00
- $144.44
These are the next resistance levels based on previous highs and channel dynamics.
- Key support to watch:
- $105.30 — this zone may act as a springboard for the next rally if tested.
📊 Key Highlights:
- Volume has shown a clear bullish divergence as price advances, signaling growing interest and strength heading into Wave (5).
- The bullish channel remains intact, and each dip has been met with higher lows, confirming the ongoing uptrend.
- Elliot Wave structure suggests further upside, with the $130.00 and $144.44 levels as potential targets.
🚨 Conclusion:
LTC bulls should keep an eye on price action as it approaches support at $105.30 — a bounce here could ignite the next leg higher toward our target zones. Reaction from the channel community will be crucial as Wave (5) unfolds. Show your support with a reaction below if you’re riding this wave!

LtcLtc lproject looks promising
Solid owners who define the true value of crypto
I don’t see any reason this turns bearish anytime soon

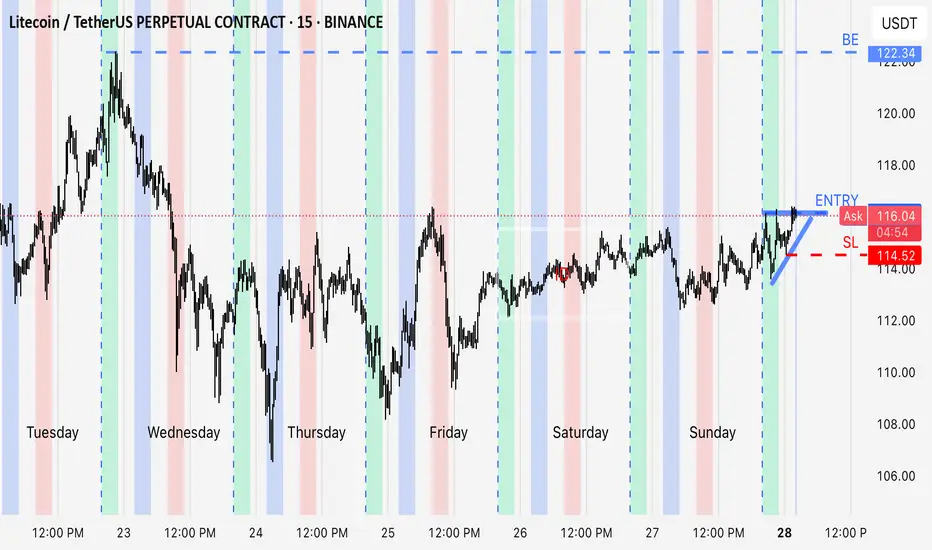
inside day breakoutLooking for a quick parabolic trade. Builded up from Asia and the gap time , supported by 20ma. On the daily it is bouncing of a 50% of a strong bullish move. This could be a really big R:R trade . Even 1:10 is possible. Looking to hold till close and breakeven if opportunity presents
Litecoin (LTC): Looking Bad Now, But Has Good Potential Litecoin is in bad shape, where sellers are showing pressure, which could lead to bigger downward movement.
Despite that, we are still above the local neckline area, so we are still bullish, for now!
More in-depth info is in the video—enjoy!
Swallow Academy
