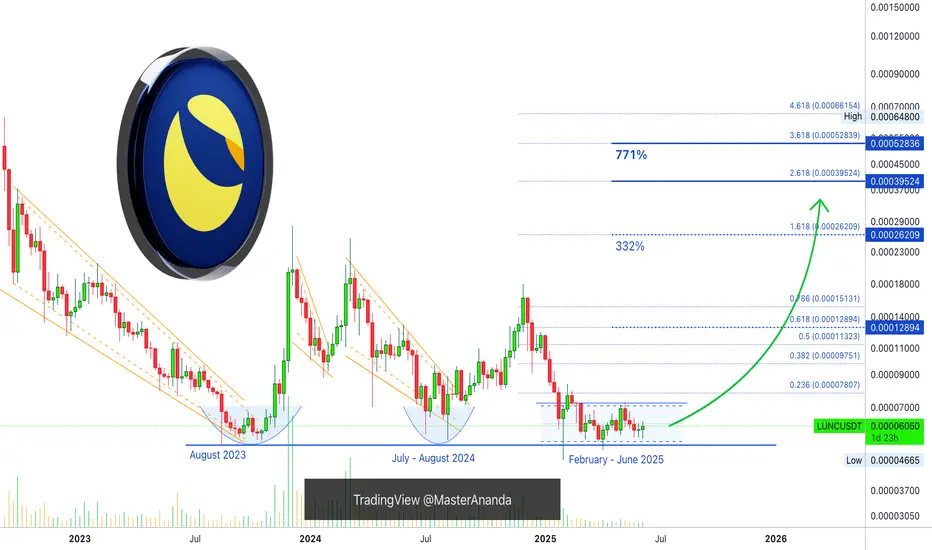
Terra Luna Classic LT Double-Bottom & 771% Potential ProfitsYou can say it is a long-term (LT) triple-bottom when taking into consideration the July-August 2024 support.
Terra Luna Classic (LUNC) has been reacting at the same level for years. Each time this strong support range gets challenged, what follows is a bullish wave.
» August 2023 marked the bott
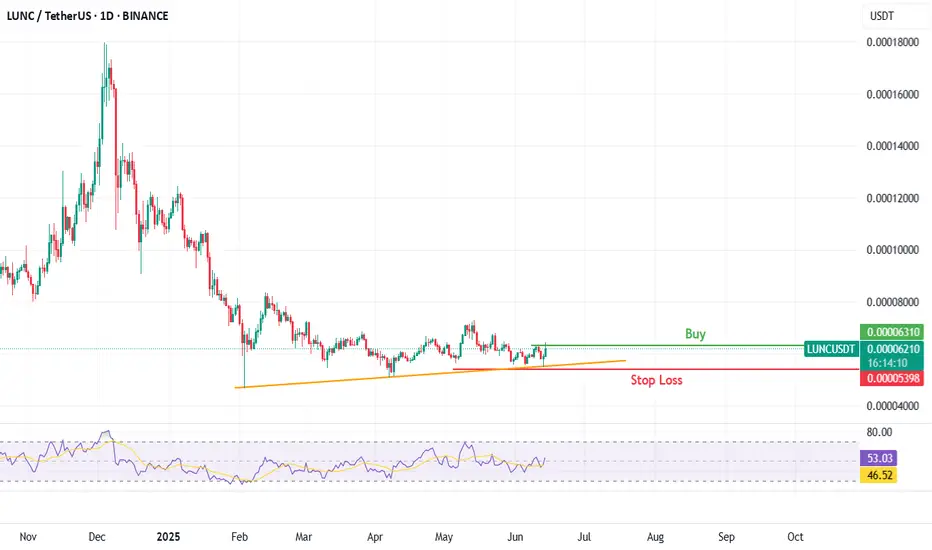
LUNC/USDT is in Reversal LUNC/USDT is showing good trend line reversal with the divergence on the 4hr time frame looks good for buy at current price or it can be go for some small retracement on 1hr time frame
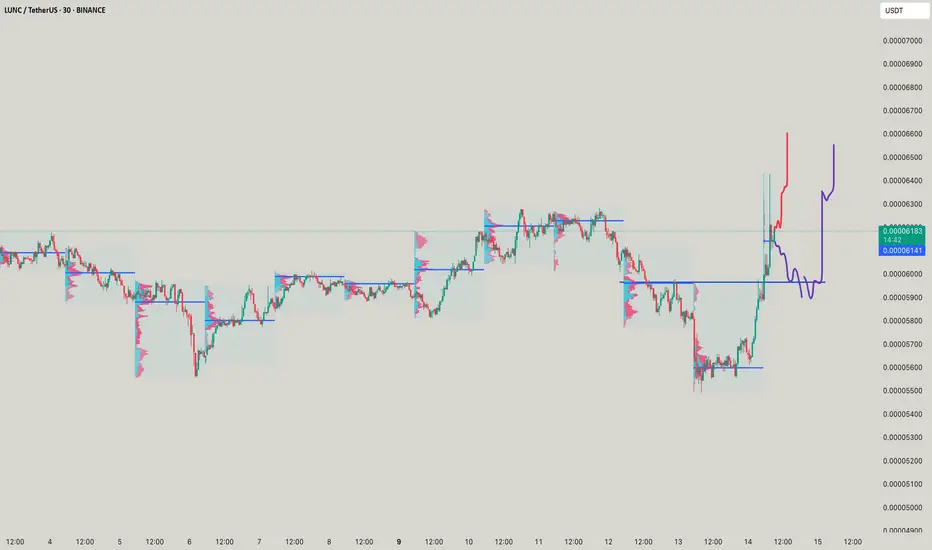
LUNCUSDT - A Move again?LUNC moves are marked by red and purple, purple is something to be really best to buy, red is just a forced move!
LUNCUSDT 1W Analysis LUNC ~ 1W Analysis
#LUNC This trade is very high risk
This is the lowest support for now. Buy gradually from here with a short term target of at least 20%++

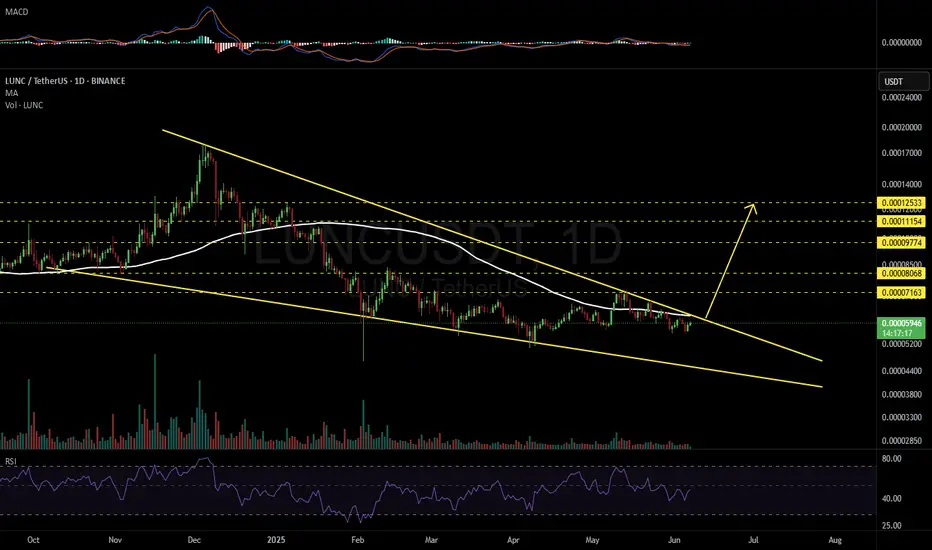
LUNCUSDT 1D#LUNC is currently moving inside a Falling Wedge pattern on the daily chart — a classic bullish setup.
A breakout above the wedge resistance and the daily MA100 could trigger a strong upward move. Potential targets:
🎯 $0.00007163
🎯 $0.00008068
🎯 $0.00009774
🎯 $0.00011154
🎯 $0.00012533
⚠️ Always u
LUNC Bullish Inverted Head and Shoulders – Testing Neckline Agai🚀 SEED_DONKEYDAN_MARKET_CAP:LUNC Bullish Inverted Head and Shoulders – Testing Neckline Again 📈
SEED_DONKEYDAN_MARKET_CAP:LUNC has formed a bullish inverted head and shoulders pattern and is now testing the neckline in red once again. This could be the final breakout we’ve been waiting for! 🔥

LUNC Bullish Inverted Head and Shoulders – Target Ahead!🚀 SEED_DONKEYDAN_MARKET_CAP:LUNC Bullish Inverted Head and Shoulders – Target Ahead! 📈
SEED_DONKEYDAN_MARKET_CAP:LUNC has formed a bullish inverted head and shoulders pattern. If confirmed, the first target could be the green line level! 📊
Let’s catch this breakout together! 💼💸

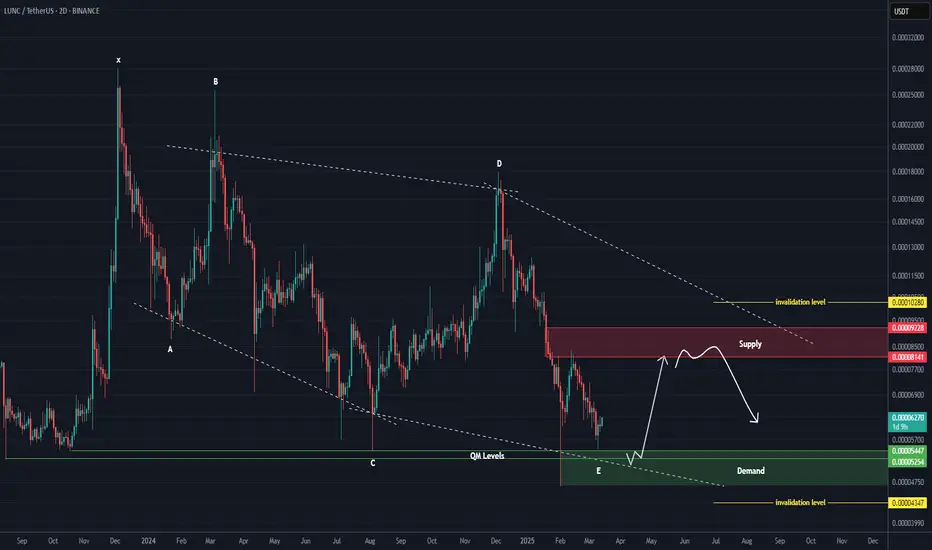
LUNC ANANLYSIS (2D)LUNC, after a strong pump in the form of an X wave, appears to have entered a diametric pattern and is now at the end of Wave E.
In the green zone, we are looking for buy positions in spot, while in the red zone, we are looking for sell/short positions in futures.
To invalidate the buy and sell ou
Terra Luna Classic ($LUNC) Hits Major Burn MilestoneThe Terra Luna Classic ( SEED_DONKEYDAN_MARKET_CAP:LUNC ) ecosystem has reached a significant milestone, burning over 405 billion LUNC since May 2022. This deflationary move, alongside the burning of 3.5 billion USTC, has fueled optimism for a potential price breakout. As fundamental and technical i
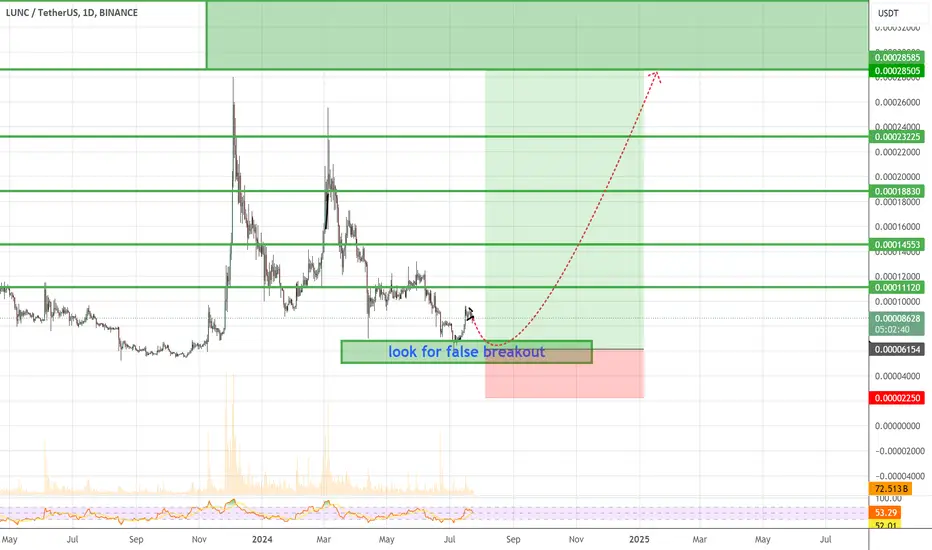
#LUNC look for the false break outi'll be looking for bullish signal to long LUNC if false breakout or retest of the previous high
target will be 400 %
See all ideas
Summarizing what the indicators are suggesting.
Oscillators
Neutral
SellBuy
Strong sellStrong buy
Strong sellSellNeutralBuyStrong buy
Oscillators
Neutral
SellBuy
Strong sellStrong buy
Strong sellSellNeutralBuyStrong buy
Summary
Neutral
SellBuy
Strong sellStrong buy
Strong sellSellNeutralBuyStrong buy
Summary
Neutral
SellBuy
Strong sellStrong buy
Strong sellSellNeutralBuyStrong buy
Summary
Neutral
SellBuy
Strong sellStrong buy
Strong sellSellNeutralBuyStrong buy
Moving Averages
Neutral
SellBuy
Strong sellStrong buy
Strong sellSellNeutralBuyStrong buy
Moving Averages
Neutral
SellBuy
Strong sellStrong buy
Strong sellSellNeutralBuyStrong buy
Displays a symbol's price movements over previous years to identify recurring trends.