Magic: Higher Low, Falling Wedge & Bullish Continuation (1,046%)It seems like forever, but it is worth it because of the huge potential for growth.
The falling wedge pattern is a classic, we haven't been seeing that many recently and here we have one.
The initial breakout in April only lasted two weeks. MAGICUSDT peaked 21-April and started a long retrace, thi
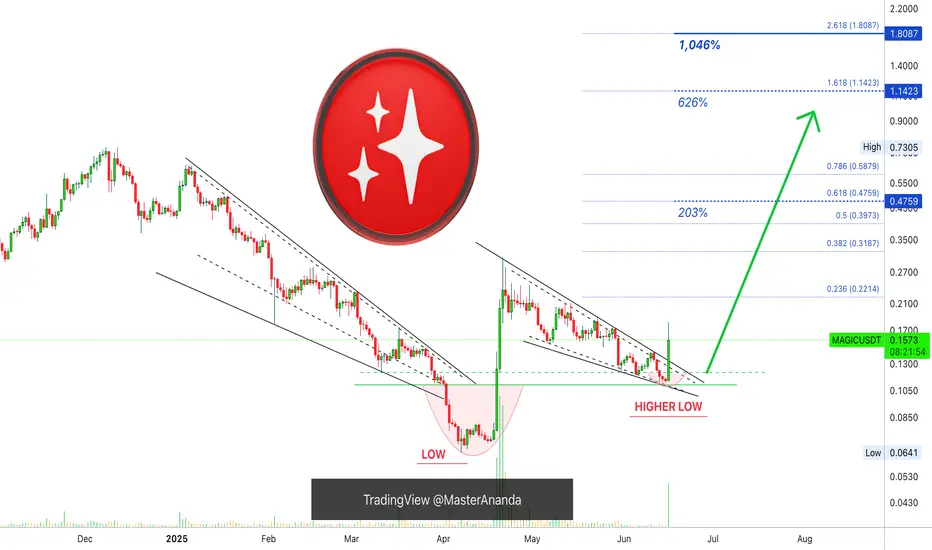
MAGIC - LONG SET-UP BINANCE:MAGICUSDT
𝐌𝐀𝐆𝐈𝐂/𝐔𝐒𝐃𝐓
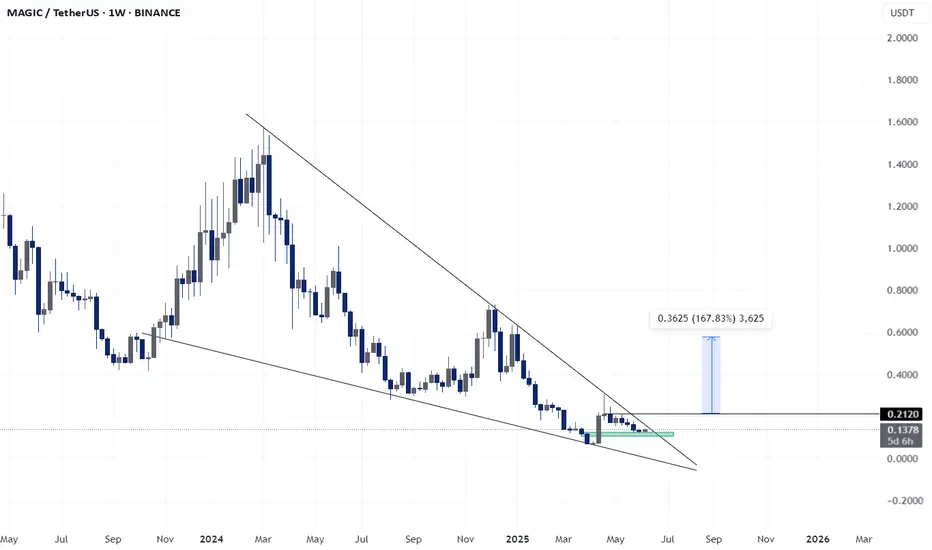
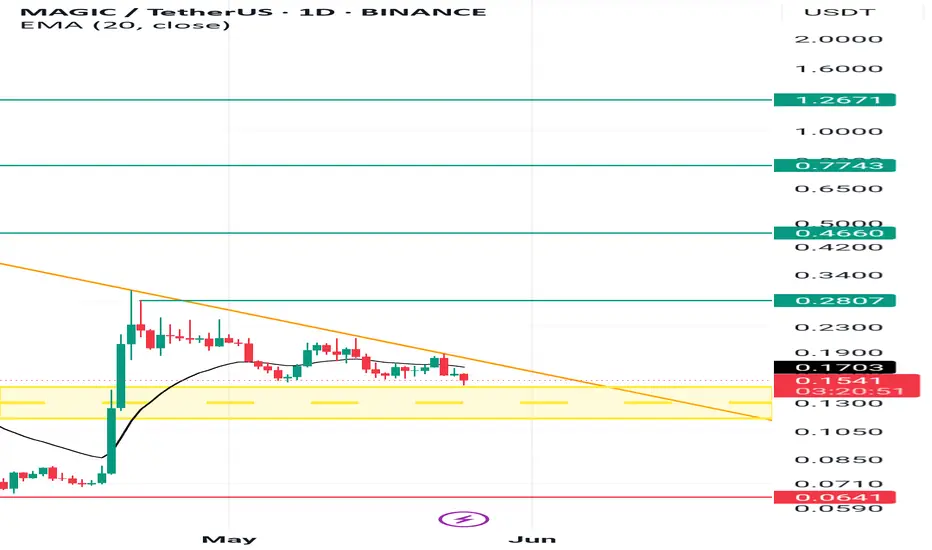
Magic is breaking out of a long-term falling wedge pattern, a classic bullish reversal setup. With clear support at $0.125 and resistance at $0.2120 breached, this chart implies a potential 167% upside move toward the $0.36+ zone. Momentum building
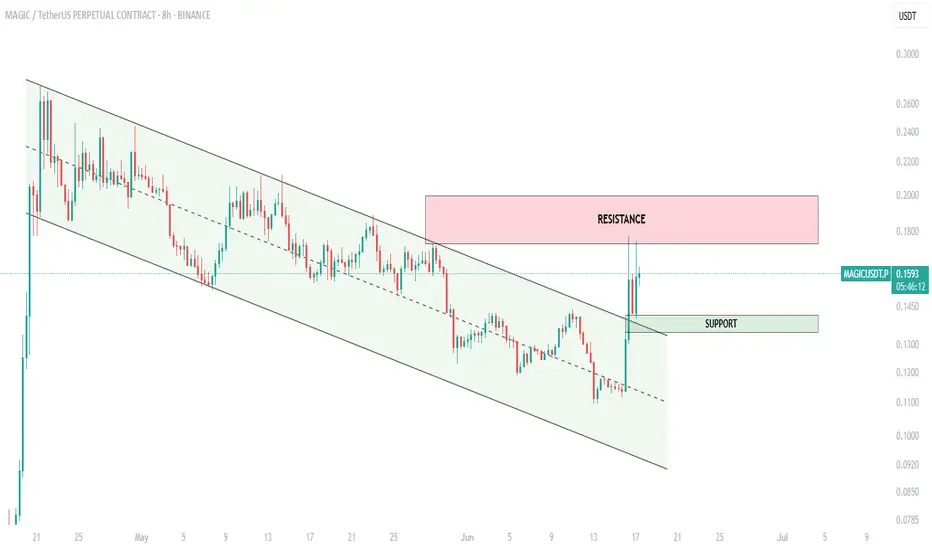
$MAGIC broke out!After weeks of grinding inside a falling channel, OMXTSE:MAGIC finally broke out with a sharp 20% move!
- Channel breakout confirmed
- Price reclaimed the support zone around $0.145
- Resistance zone ahead: $0.185–$0.20
Now it’s all about momentum. If bulls hold above the breakout area, we could
MAGIC BREAKING OUT WITH MASSIVE VOLUMEMAGIC breaking out with Massive Volume on Higher Timeframes and Bulls are taking over, with strong momentum and aggressive buying
Treasure DAO’s June 12–14 announcements of AI-powered NFT agents and an “Emotion System” for in-game interactions drove speculative interest. The updates aim to deepen
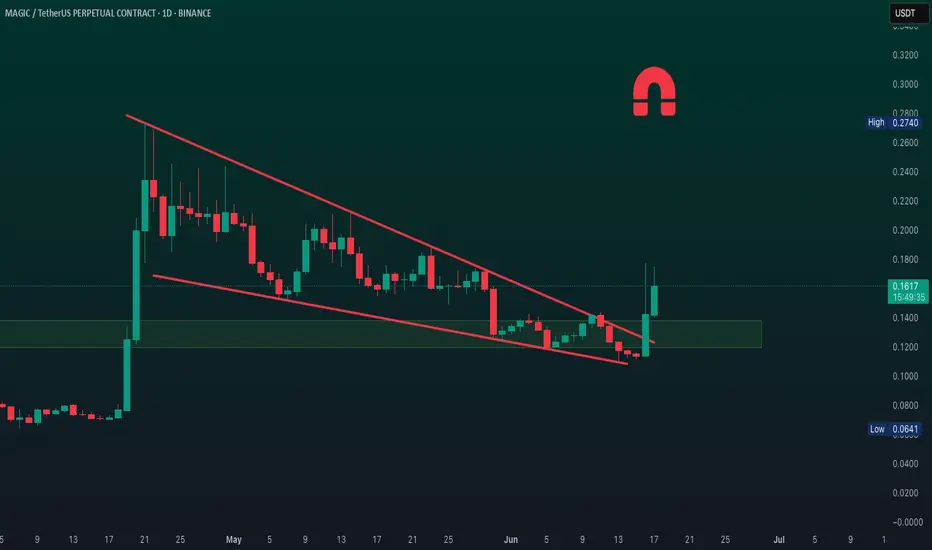
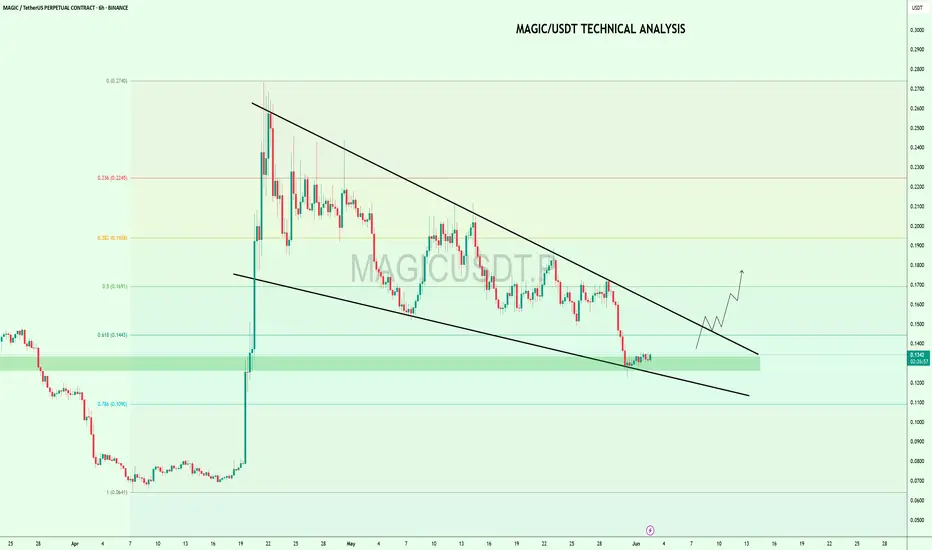
$MAGIC Falling Wedge + Fib ConfluenceOMXTSE:MAGIC Falling Wedge + Fib Confluence
Price is holding strong at the 0.618–0.786 golden support zone while forming a bullish falling wedge on the 6H chart.
Looks ready for a breakout toward $0.17+ 🚀
DYOR, NFA
#MAGIC #Altseason2025
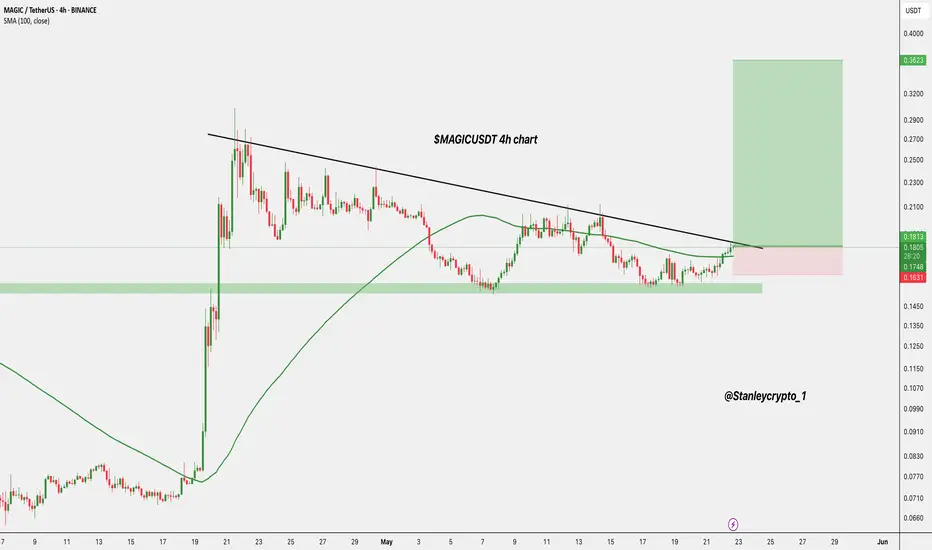
$MAGIC is breaking out after 30+ days of consolidation!Now testing the trendline with strong support at $0.16–$0.17 and holding above the 100 EMA.
If confirmed, we could see a move toward $0.36+ 🚀
Entry: CMP $0.1811
SL: $0.1631
Target: $0.3623
DYRO, NFA
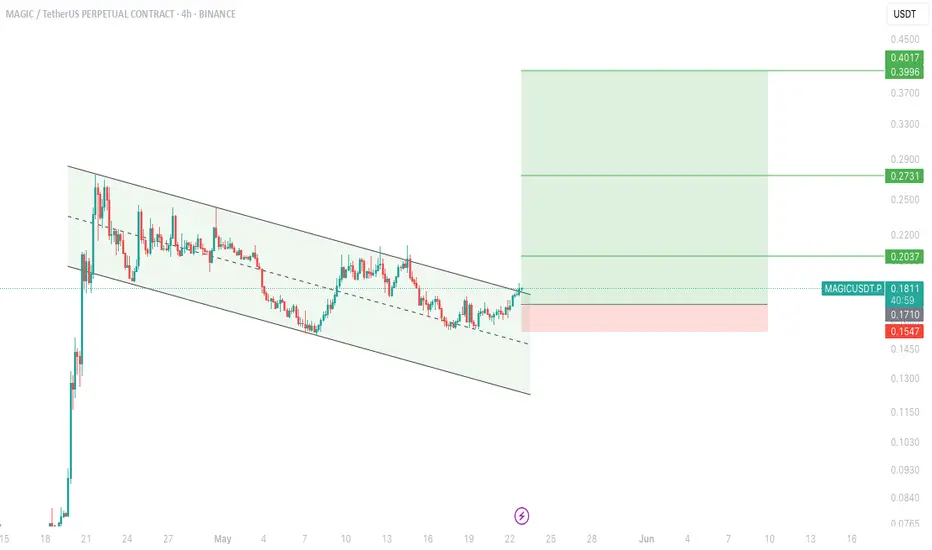
$MAGIC Trade Setup Alert!Bull flag breakout on OMXTSE:MAGIC — and we’re eyeing a beautiful move next! 👀📈
Price is testing breakout levels right now with solid bullish momentum.
🎯 Targets:
• TP1: $0.2037
• TP2: $0.2731
• TP3: $0.3996+
🛑 SL: $0.1547
📌 Entry Zone: Around $0.1710
Breakout traders, this is your cue!
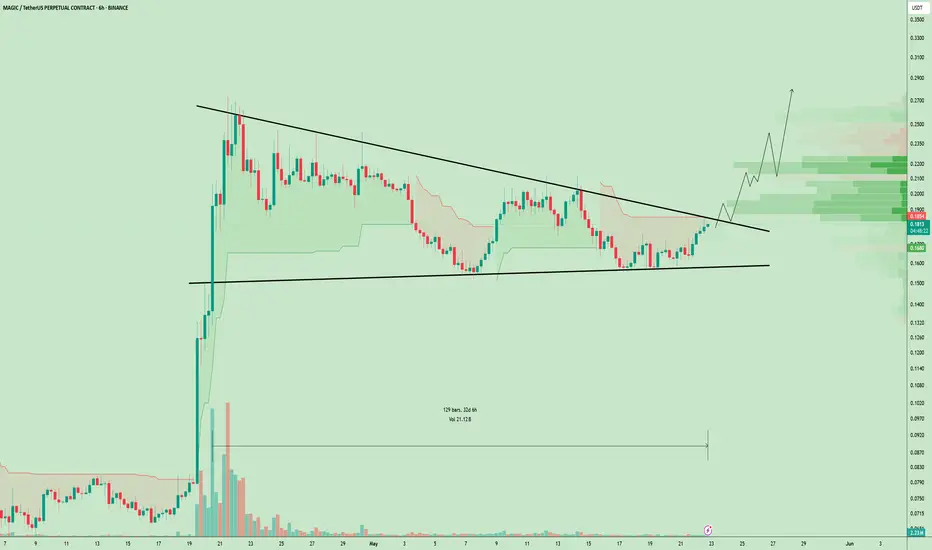
$MAGIC Loading Up for a Breakout After 32 Days of Silence!OMXTSE:MAGIC has been forming this symmetrical triangle pattern for over 32 days, that's more than a month of consolidation!
Price is squeezing tighter inside the range, and a breakout is getting closer.
If it breaks above the upper trendline with volume, we could see a move toward $0.22–$0.28 🚀
See all ideas
Summarizing what the indicators are suggesting.
Oscillators
Neutral
SellBuy
Strong sellStrong buy
Strong sellSellNeutralBuyStrong buy
Oscillators
Neutral
SellBuy
Strong sellStrong buy
Strong sellSellNeutralBuyStrong buy
Summary
Neutral
SellBuy
Strong sellStrong buy
Strong sellSellNeutralBuyStrong buy
Summary
Neutral
SellBuy
Strong sellStrong buy
Strong sellSellNeutralBuyStrong buy
Summary
Neutral
SellBuy
Strong sellStrong buy
Strong sellSellNeutralBuyStrong buy
Moving Averages
Neutral
SellBuy
Strong sellStrong buy
Strong sellSellNeutralBuyStrong buy
Moving Averages
Neutral
SellBuy
Strong sellStrong buy
Strong sellSellNeutralBuyStrong buy
Displays a symbol's price movements over previous years to identify recurring trends.