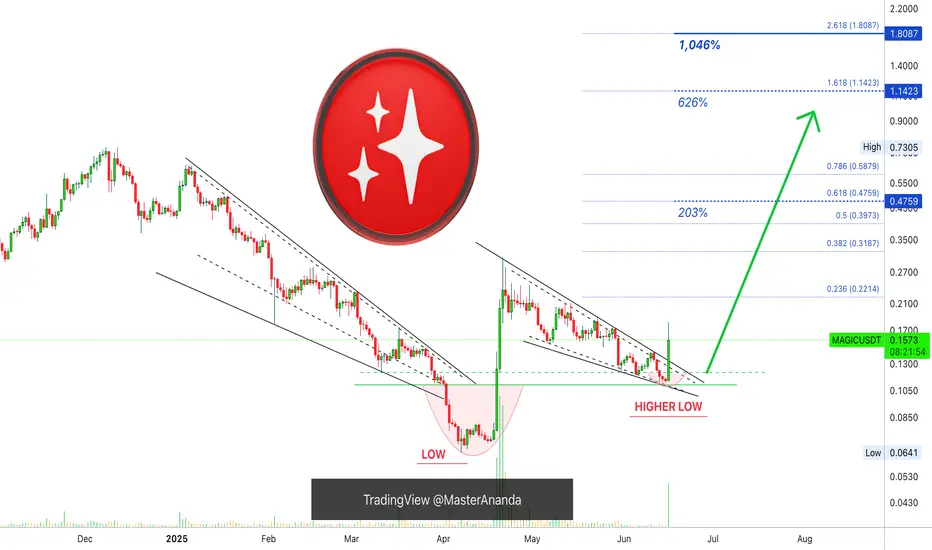
Magic: Higher Low, Falling Wedge & Bullish Continuation (1,046%)It seems like forever, but it is worth it because of the huge potential for growth.
The falling wedge pattern is a classic, we haven't been seeing that many recently and here we have one.
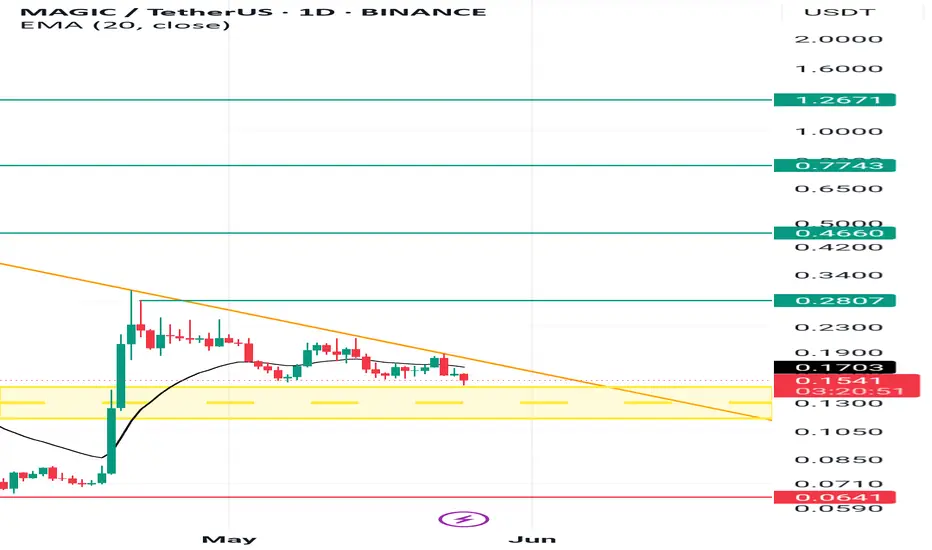
The initial breakout in April only lasted two weeks. MAGICUSDT peaked 21-April and started a long retrace, this retrace as always happens ends in a higher low. The candles formed a falling wedge pattern which can be used as a bullish reversal signal.
As the breakout from the pattern happens today, we can see trading volume going up. The highest volume since April. This high volume confirms this move being real and we can expect additional growth.
The following targets can be hit within 1-3 months. So these are huge numbers watch:
» $1.14 Gives 626%.
» $1.80 Gives 1,046%.
» $0.4759 Gives 203%.
These are great numbers, nice potential for growth. The last target can be hit short-term, within thirty days. It can be less.
Thank you for reading.
Your support is truly appreciated.
I hope we can continue to exchange for the long-term.
You give me attention, and I give you knowledge and great trading opportunities.
Namaste.
MAGICUSDT.P trade ideas
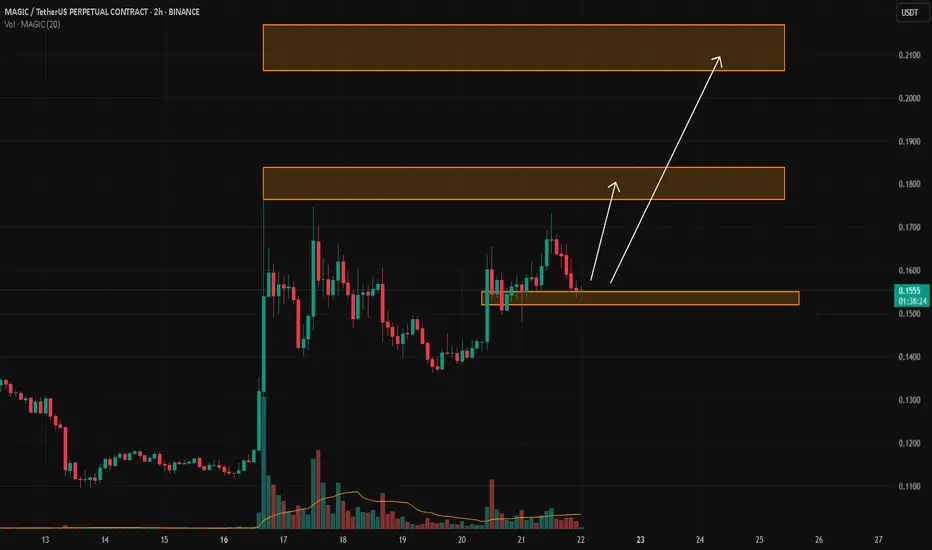
MAGIC/USDTKey Level Zone: 0.1520 - 0.1550
LMT v2.0 detected.
The setup looks promising—price previously trended upward with rising volume and momentum, then retested this zone cleanly. This presents an excellent reward-to-risk opportunity if momentum continues to align.
Introducing LMT (Levels & Momentum Trading)
- Over the past 3 years, I’ve refined my approach to focus more sharply on the single most important element in any trade: the KEY LEVEL.
- While HMT (High Momentum Trading) served me well—combining trend, momentum, volume, and structure across multiple timeframes—I realized that consistently identifying and respecting these critical price zones is what truly separates good trades from great ones.
- That insight led to the evolution of HMT into LMT – Levels & Momentum Trading.
Why the Change? (From HMT to LMT)
Switching from High Momentum Trading (HMT) to Levels & Momentum Trading (LMT) improves precision, risk control, and confidence by:
- Clearer Entries & Stops: Defined key levels make it easier to plan entries, stop-losses, and position sizing—no more guesswork.
- Better Signal Quality: Momentum is now always checked against a support or resistance zone—if it aligns, it's a stronger setup.
- Improved Reward-to-Risk: All trades are anchored to key levels, making it easier to calculate and manage risk effectively.
- Stronger Confidence: With clear invalidation points beyond key levels, it's easier to trust the plan and stay disciplined—even in tough markets.
Whenever I share a signal, it’s because:
- A high‐probability key level has been identified on a higher timeframe.
- Lower‐timeframe momentum, market structure and volume suggest continuation or reversal is imminent.
- The reward‐to‐risk (based on that key level) meets my criteria for a disciplined entry.
***Please note that conducting a comprehensive analysis on a single timeframe chart can be quite challenging and sometimes confusing. I appreciate your understanding of the effort involved.
Important Note: The Role of Key Levels
- Holding a key level zone: If price respects the key level zone, momentum often carries the trend in the expected direction. That’s when we look to enter, with stop-loss placed just beyond the zone with some buffer.
- Breaking a key level zone: A definitive break signals a potential stop‐out for trend traders. For reversal traders, it’s a cue to consider switching direction—price often retests broken zones as new support or resistance.
My Trading Rules (Unchanged)
Risk Management
- Maximum risk per trade: 2.5%
- Leverage: 5x
Exit Strategy / Profit Taking
- Sell at least 70% on the 3rd wave up (LTF Wave 5).
- Typically sell 50% during a high‐volume spike.
- Move stop‐loss to breakeven once the trade achieves a 1.5:1 R:R.
- Exit at breakeven if momentum fades or divergence appears.
The market is highly dynamic and constantly changing. LMT signals and target profit (TP) levels are based on the current price and movement, but market conditions can shift instantly, so it is crucial to remain adaptable and follow the market's movement.
If you find this signal/analysis meaningful, kindly like and share it.
Thank you for your support~
Sharing this with love!
From HMT to LMT: A Brief Version History
HM Signal :
Date: 17/08/2023
- Early concept identifying high momentum pullbacks within strong uptrends
- Triggered after a prior wave up with rising volume and momentum
- Focused on healthy retracements into support for optimal reward-to-risk setups
HMT v1.0:
Date: 18/10/2024
- Initial release of the High Momentum Trading framework
- Combined multi-timeframe trend, volume, and momentum analysis.
- Focused on identifying strong trending moves high momentum
HMT v2.0:
Date: 17/12/2024
- Major update to the Momentum indicator
- Reduced false signals from inaccurate momentum detection
- New screener with improved accuracy and fewer signals
HMT v3.0:
Date: 23/12/2024
- Added liquidity factor to enhance trend continuation
- Improved potential for momentum-based plays
- Increased winning probability by reducing entries during peaks
HMT v3.1:
Date: 31/12/2024
- Enhanced entry confirmation for improved reward-to-risk ratios
HMT v4.0:
Date: 05/01/2025
- Incorporated buying and selling pressure in lower timeframes to enhance the probability of trending moves while optimizing entry timing and scaling
HMT v4.1:
Date: 06/01/2025
- Enhanced take-profit (TP) target by incorporating market structure analysis
HMT v5 :
Date: 23/01/2025
- Refined wave analysis for trending conditions
- Incorporated lower timeframe (LTF) momentum to strengthen trend reliability
- Re-aligned and re-balanced entry conditions for improved accuracy
HMT v6 :
Date : 15/02/2025
- Integrated strong accumulation activity into in-depth wave analysis
HMT v7 :
Date : 20/03/2025
- Refined wave analysis along with accumulation and market sentiment
HMT v8 :
Date : 16/04/2025
- Fully restructured strategy logic
HMT v8.1 :
Date : 18/04/2025
- Refined Take Profit (TP) logic to be more conservative for improved win consistency
LMT v1.0 :
Date : 06/06/2025
- Rebranded to emphasize key levels + momentum as the core framework
LMT v2.0
Date: 11/06/2025
MAGICUSDT Forming Falling WedgeMAGICUSDT is currently showing a highly promising technical setup with the formation of a falling wedge pattern, a historically reliable bullish reversal signal. This pattern, defined by converging trendlines sloping downward, typically signals a pause in a larger bullish trend and sets the stage for a significant upward breakout. MAGICUSDT appears to be nearing the breakout zone, and volume activity has started to increase, signaling growing accumulation and investor interest in this project.
The falling wedge is not just a visual pattern but a psychological reflection of reduced selling pressure and the potential for strong buyer interest once resistance levels are broken. With price compression occurring and the wedge tightening, MAGICUSDT could be poised for an explosive move. Historical breakouts from similar setups have often led to price increases ranging from 90% to 100%, making this a very attractive risk-reward trade for swing and position traders alike.
Beyond the technicals, market sentiment for MAGICUSDT is strengthening. The project continues to draw attention from retail traders and analysts across social media and trading platforms. This renewed focus could act as a catalyst for price momentum, especially as breakout traders and algorithmic systems begin to identify the wedge formation and position themselves accordingly.
In conclusion, MAGICUSDT offers a compelling opportunity for those watching for technically sound breakouts with strong upside potential. With volume confirming the pattern and price action pressing against the upper resistance, the setup suggests a breakout may be imminent. Keep this pair on your radar as it could be preparing for a major rally in the days ahead.
✅ Show your support by hitting the like button and
✅ Leaving a comment below! (What is You opinion about this Coin)
Your feedback and engagement keep me inspired to share more insightful market analysis with you!
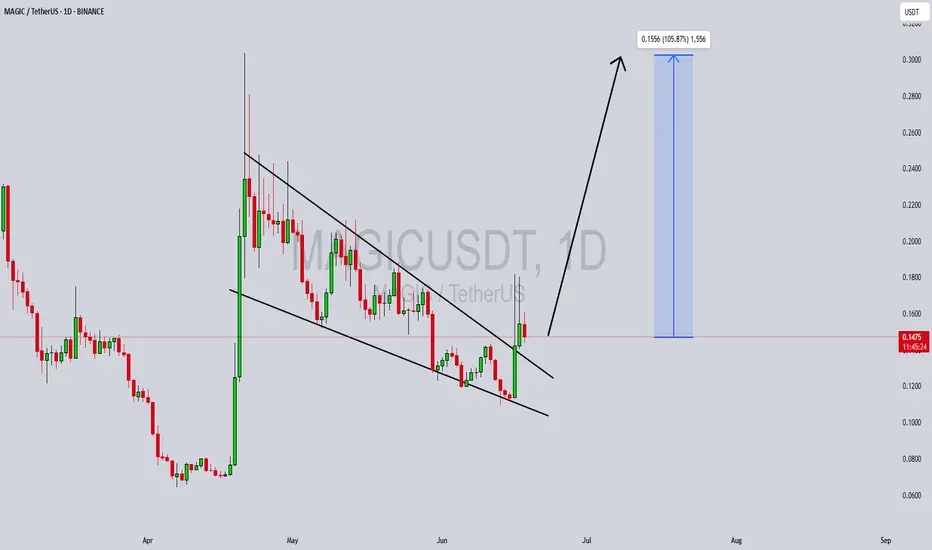
magic usdt 5x long term 100% gain shorter timealready borken the resistance with daily candle
Can buy now 0.1538 - 0.1800
for long term holding
can get 100% in the short time
if u hold longer can be 5x easily
No need stop loss.
but if u want then use SL: 0.100
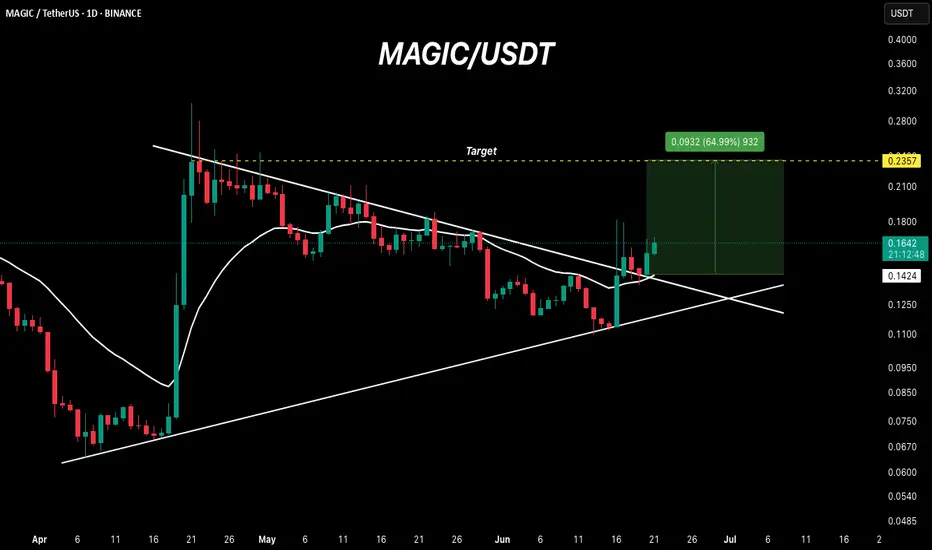
MAGIC broke above the resistance!MAGIC has broken above the daily resistance and is now gearing up for a potential bullish move.
Strategy:
~ Entry: $0.15 to CMP.
~ Trade Period: Short-term.
~ Trade Type: Spot/2x-3x leverage.
~ Target: 50%-60%.
Note: Always do your own research and analysis before investing.
Regards,
Dexter.
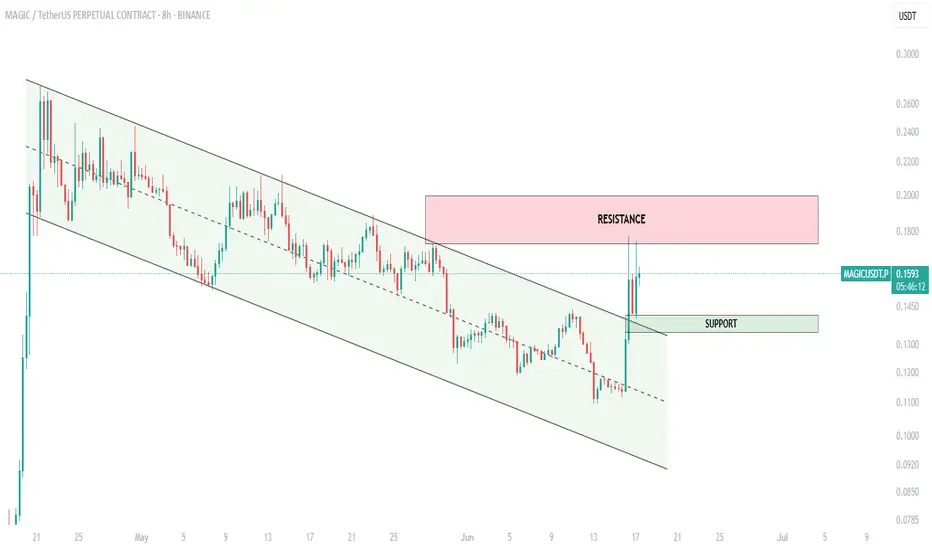
$MAGIC broke out!After weeks of grinding inside a falling channel, OMXTSE:MAGIC finally broke out with a sharp 20% move!
- Channel breakout confirmed
- Price reclaimed the support zone around $0.145
- Resistance zone ahead: $0.185–$0.20
Now it’s all about momentum. If bulls hold above the breakout area, we could see further continuation toward the upper resistance.
Trade smart — avoid FOMO. To ride the wave further, wait for a retest or clear strength above resistance.
This is how a clean technical structure plays out.
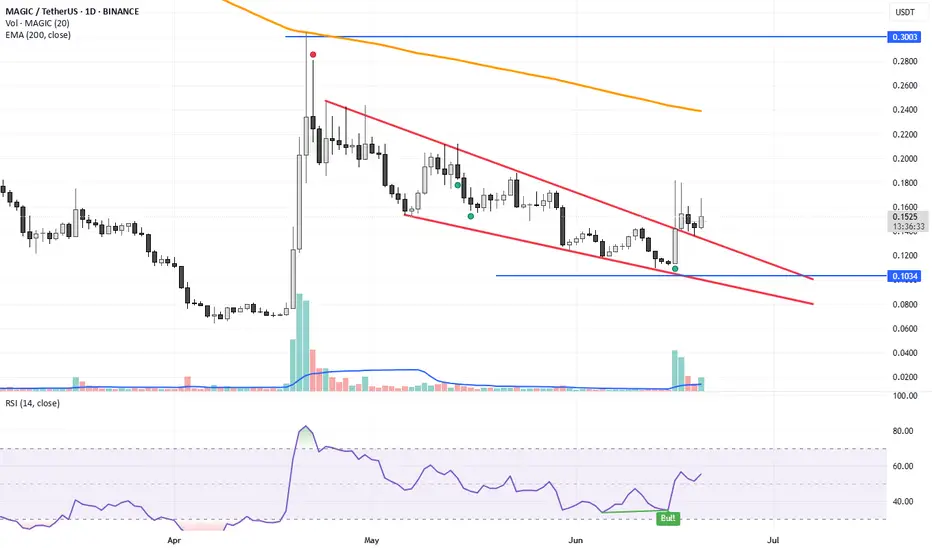
magic usdtbuy 0.14 - 0.17
sell 0.3
almost 100% gain can get within 1 week.
STOP Loss 0.1034
Resistance broken with Daily Candle
RSI Divergence Daily candle
Spot trading only.
MAGIC - LONG SET-UP BINANCE:MAGICUSDT
𝐌𝐀𝐆𝐈𝐂/𝐔𝐒𝐃𝐓
Magic is breaking out of a long-term falling wedge pattern, a classic bullish reversal setup. With clear support at $0.125 and resistance at $0.2120 breached, this chart implies a potential 167% upside move toward the $0.36+ zone. Momentum building
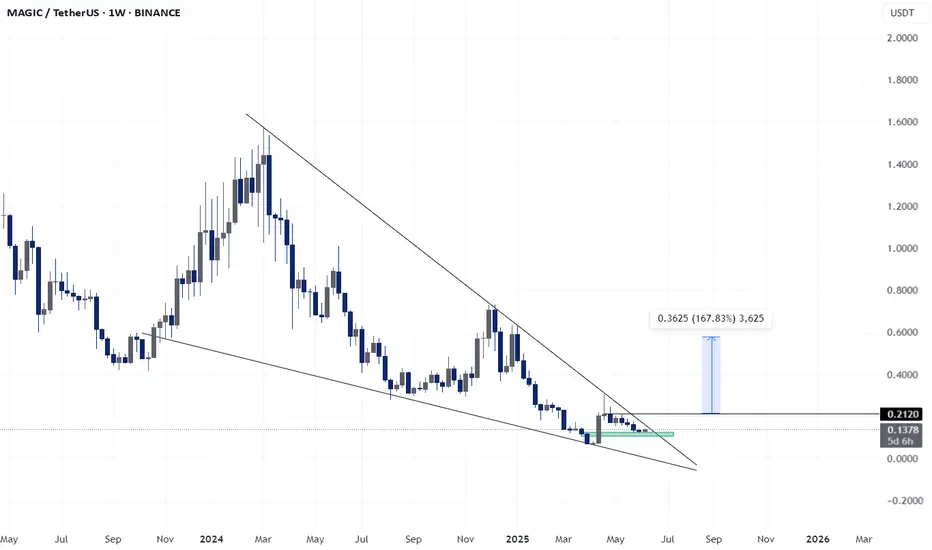
#MAGIC/USDT#MAGIC
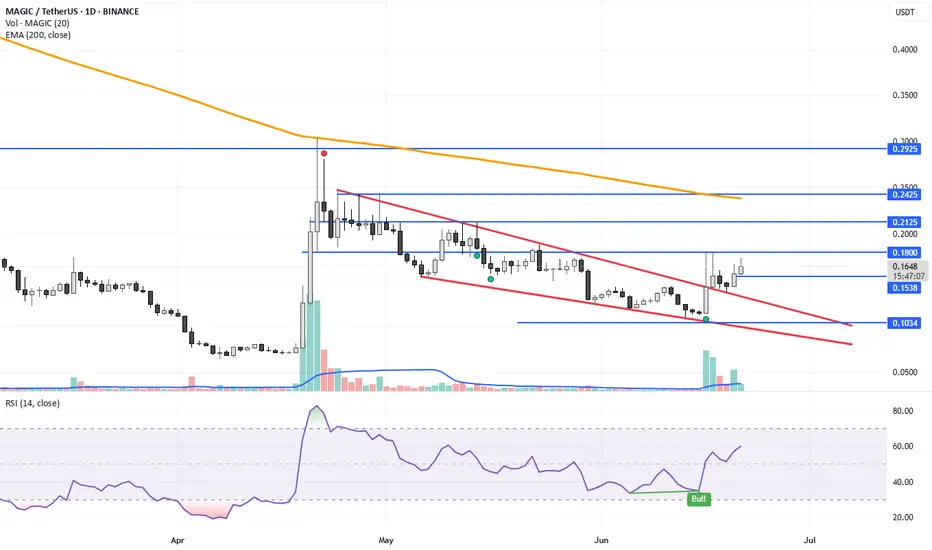
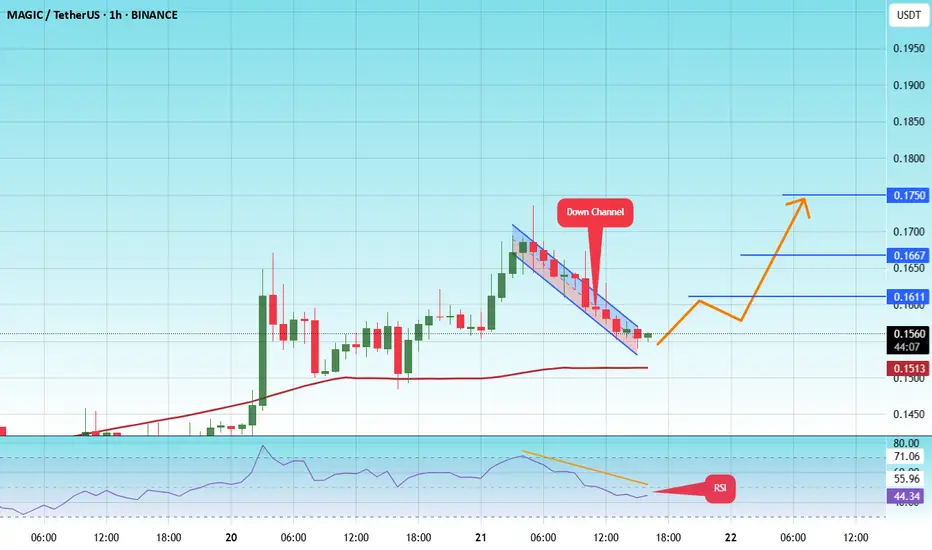
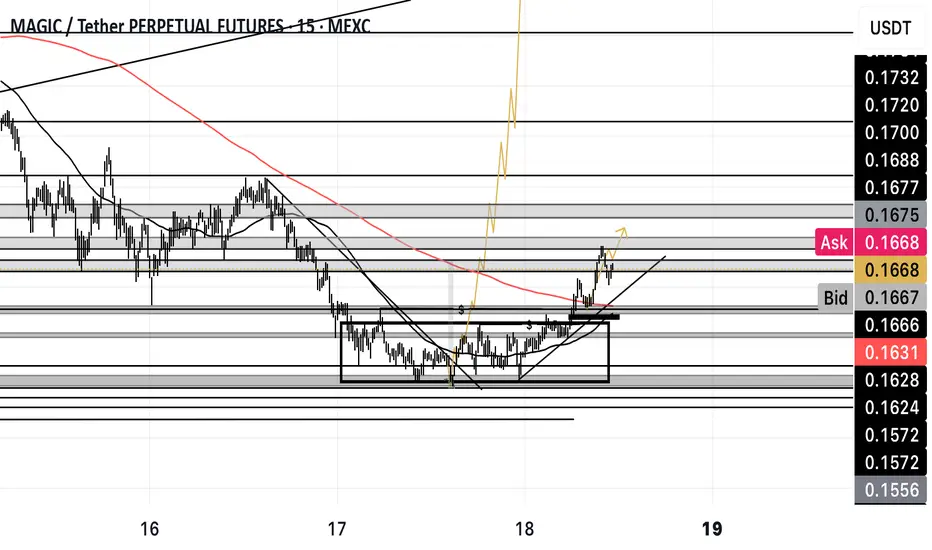
The price is moving within a descending channel on the 1-hour frame and is expected to break and continue upward.
We have a trend to stabilize above the 100 moving average once again.
We have a downtrend on the RSI indicator, which supports the upward move by breaking it upward.
We have a support area at the lower limit of the channel at 0.1533, acting as strong support from which the price can rebound.
Entry price: 0.1560
First target: 0.1611
Second target: 0.1667
Third target: 0.1750
MAGIC BREAKING OUT WITH MASSIVE VOLUMEMAGIC breaking out with Massive Volume on Higher Timeframes and Bulls are taking over, with strong momentum and aggressive buying
Treasure DAO’s June 12–14 announcements of AI-powered NFT agents and an “Emotion System” for in-game interactions drove speculative interest. The updates aim to deepen player immersion in its Arbitrum-based gaming ecosystem, with beta access to new features like Gigaverse fishing. This aligns with MAGIC’s role as the ecosystem’s utility token, triggering a 2,229% spike in trading volume to $365M
The May 30 shutdown of Treasure Chain redirected 10M MAGIC tokens (previously allocated to EigenLayer staking) to the treasury (MAGIC_250605)
Circulating supply remains at 307M (88% of max), avoiding inflationary pressures despite recent volatility
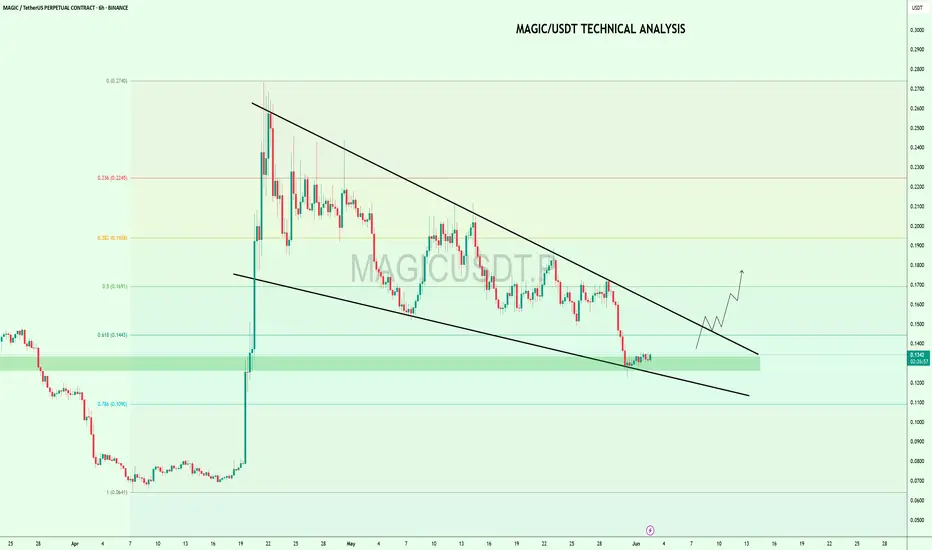
$MAGIC Falling Wedge + Fib ConfluenceOMXTSE:MAGIC Falling Wedge + Fib Confluence
Price is holding strong at the 0.618–0.786 golden support zone while forming a bullish falling wedge on the 6H chart.
Looks ready for a breakout toward $0.17+ 🚀
DYOR, NFA
#MAGIC #Altseason2025
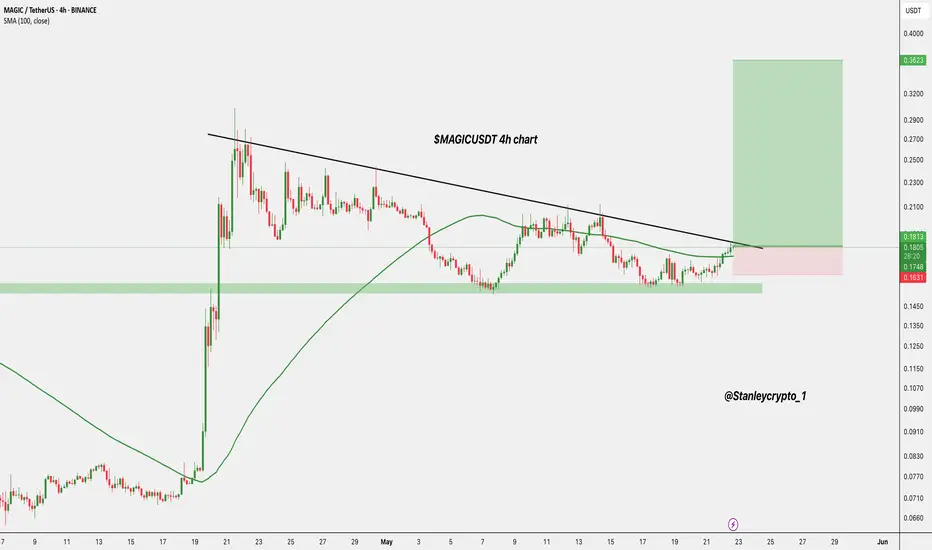
$MAGIC is breaking out after 30+ days of consolidation!Now testing the trendline with strong support at $0.16–$0.17 and holding above the 100 EMA.
If confirmed, we could see a move toward $0.36+ 🚀
Entry: CMP $0.1811
SL: $0.1631
Target: $0.3623
DYRO, NFA
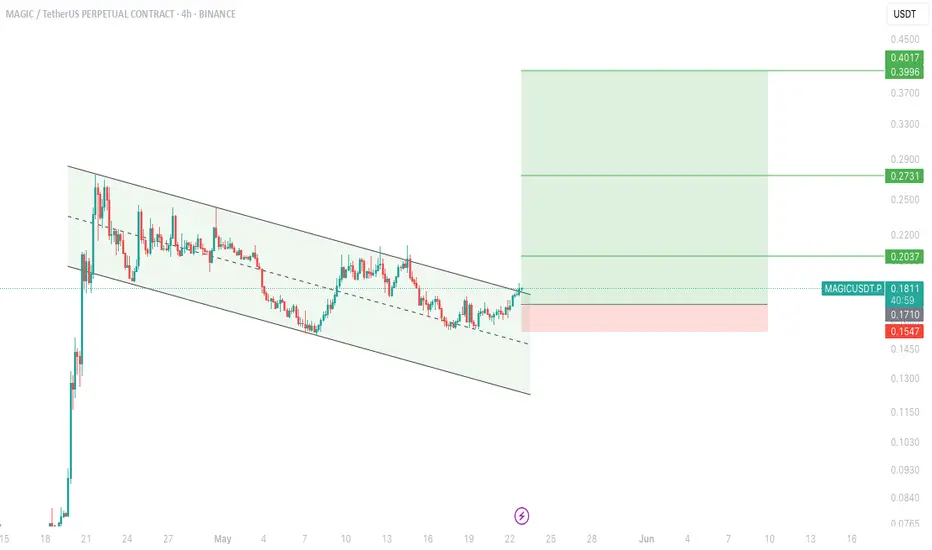
$MAGIC Trade Setup Alert!Bull flag breakout on OMXTSE:MAGIC — and we’re eyeing a beautiful move next! 👀📈
Price is testing breakout levels right now with solid bullish momentum.
🎯 Targets:
• TP1: $0.2037
• TP2: $0.2731
• TP3: $0.3996+
🛑 SL: $0.1547
📌 Entry Zone: Around $0.1710
Breakout traders, this is your cue!
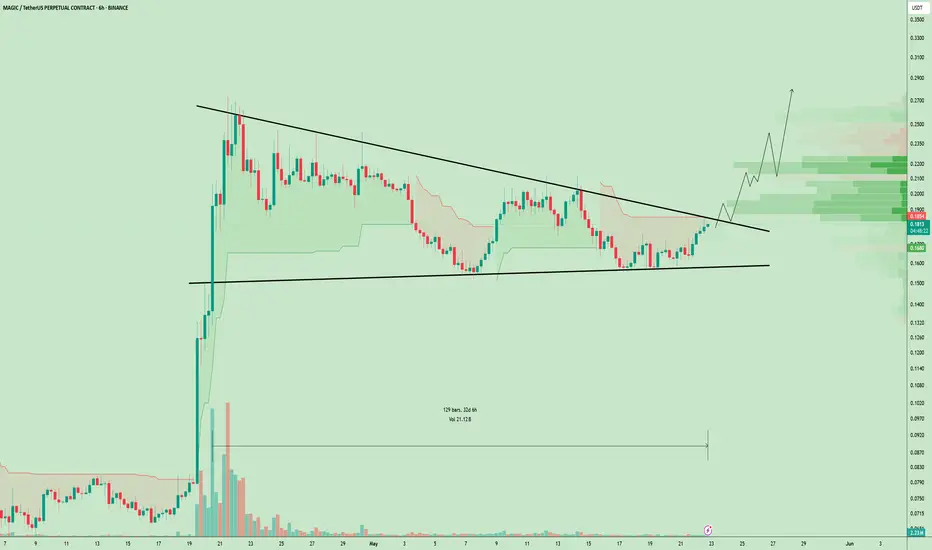
$MAGIC Loading Up for a Breakout After 32 Days of Silence!OMXTSE:MAGIC has been forming this symmetrical triangle pattern for over 32 days, that's more than a month of consolidation!
Price is squeezing tighter inside the range, and a breakout is getting closer.
If it breaks above the upper trendline with volume, we could see a move toward $0.22–$0.28 🚀
This setup is worth watching closely, long consolidation often leads to strong moves.
Retweet if you're bullish !!
#MAGIC #Alts
MAGIC/USDT – From Consolidation to Explosion?🚀 MAGIC Bull Flag Formation – 200% Potential Incoming?! 👀🔥
Hey Traders! If you're all about high-conviction plays and real alpha, smash that 👍 and tap Follow for more setups that actually deliver! 💹💯
MAGIC is showing strong signs of a breakout from the descending channel on the 4H timeframe. After consolidating inside the channel for weeks, it has now approached the upper boundary and is testing it with bullish momentum supported by the EMA.
🟢 Long Position Activated
🔹 Breakout Confirmation waaiting
🔹 Volume Picking Up 📊
🔹 EMA Flip Incoming 🔄
🎯 Targets:
TP1: $0.25
TP2: $0.31
TP3: $0.39
TP4: $0.46+
🛑 Stop-loss: $0.151
📌 Leverage: 5x max
💡 A clean breakout from here can lead to a massive move—just like last time with a 273% pump! Don’t sleep on this one.
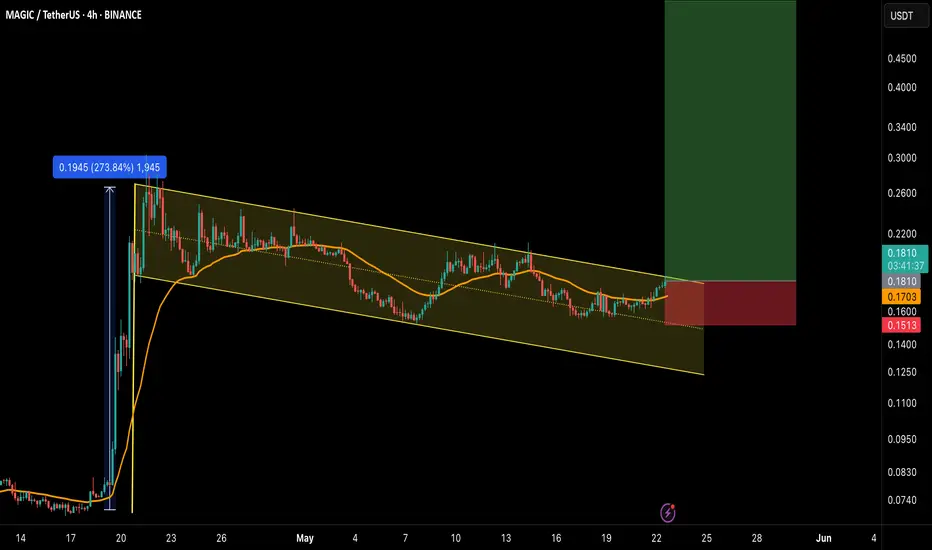
MAGIC needs a magic move!Here’s a trade setup on MAGIC (4H timeframe):
MAGIC has shown a perfect rebound from the support trendline and is currently approaching a key resistance level. A breakout and close above this resistance would signal a bullish move, while a rejection could offer another opportunity to DCA or buy the dip.
Here’s the strategy we’ll follow:
~ Wait for breakout confirmation – if it breaks above, go long; if rejected, buy the dip.
~ Once the position is open, set profit targets between $0.20 to $0.30.
~ Use 5x–10x leverage (based on your risk appetite).
~ Set a stop-loss 2% below your entry price to manage risk.
🔔 Note: Always do your own research and analysis before investing.
Regards,
Dexter

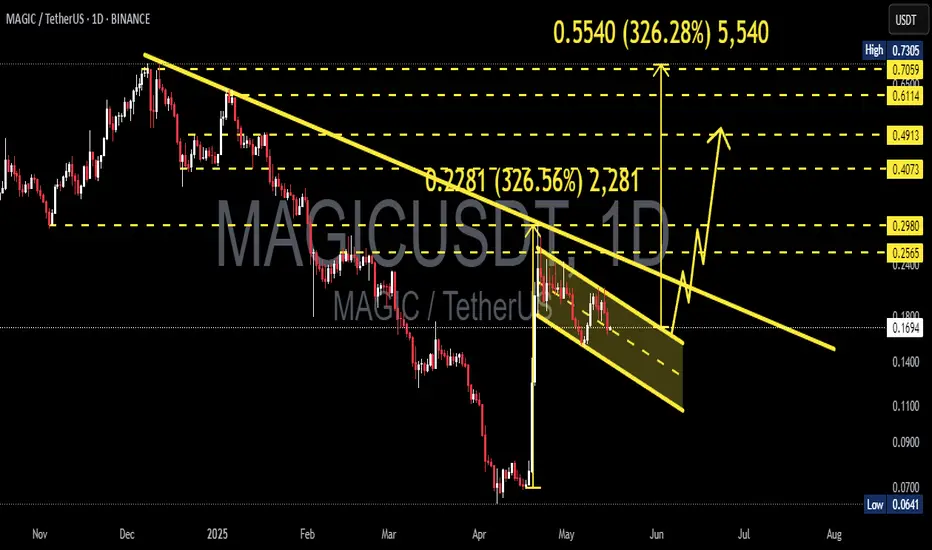
MAGICUSDT 1D AnalysisMAGIC ~ 1D Analysis
#MAGIC Buy gradually after successfully breaking through the resistance line of this pattern with a short-term target of at least 10%++
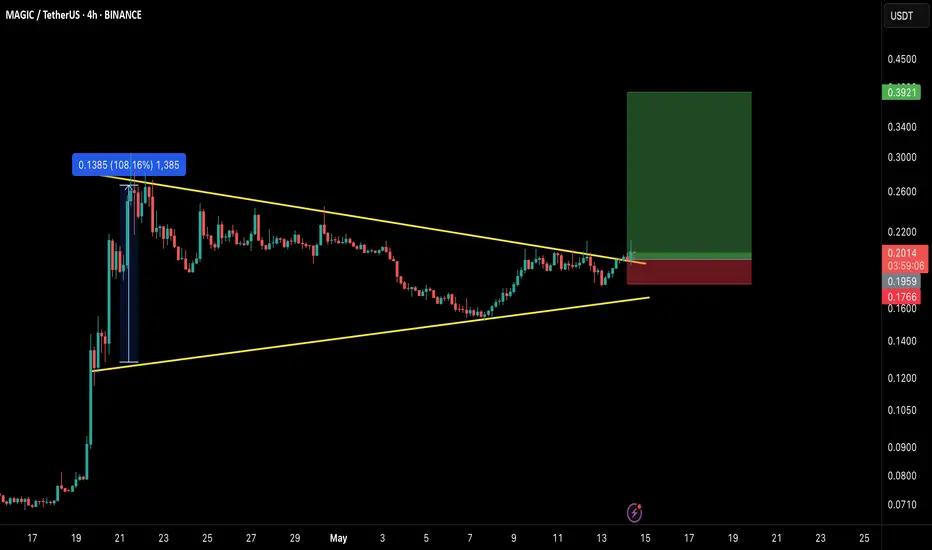
MAGIC Breaking Out – Next 100% Move on the Horizon?🚀 MAGIC Breakout Alert – 100% Potential Incoming?! 👀🔥
Hey Traders! If you're all about high-conviction plays and real alpha, smash that 👍 and tap Follow for more setups that actually deliver! 💹💯
MAGIC has finally broken out from a long-standing symmetrical triangle on the 4H chart — a classic bullish reversal pattern. After consolidating tightly, it's now flashing signs of a strong upward impulse! ⚡
📌 Entry: CMP ($0.200) and add more on dips up to $0.195
🎯 Targets: $0.25 / $0.29 / $0.33 / $0.39
🛑 Stoploss: Close below $0.176
⚙️ Leverage: 5x (Max)
✨ Previous breakout delivered over 100% gains — this one could be next!
Chart structure + volume looks perfect. If BTC stays calm, we might witness another explosive move in MAGIC.
💬 What are your thoughts on this setup? Drop your opinions below and don't forget to like & follow for more high-conviction trade setups! 💥
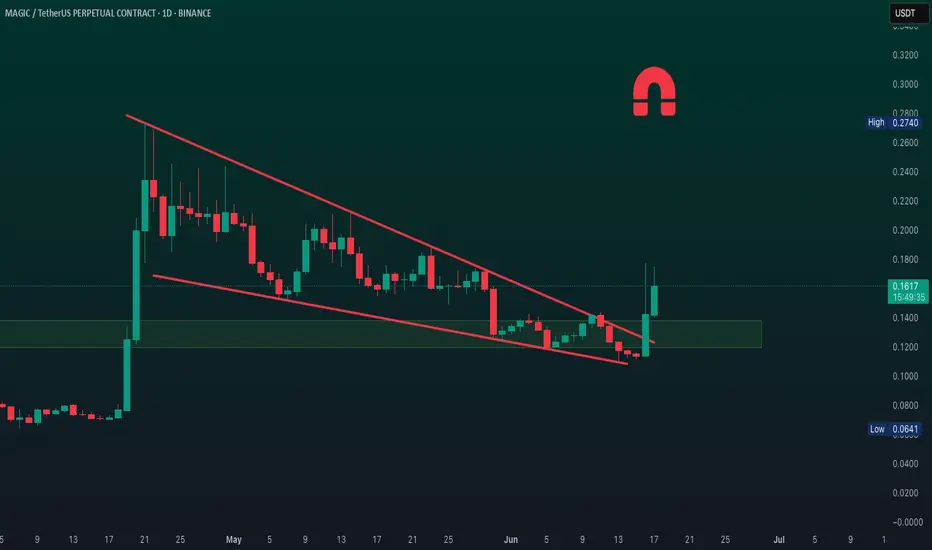
Magic Bullish Flag, Bullish Continuation = Multi-Year HighIt can crash just as it can move up. When I am saying it is going up this is only my belief.
When I looked at this chart I immediately thought that there will be a bullish breakout next because of the small rounded bottom and the bull flag, but, here is another scenario that can happen:
Then after I started to draw this scenario above seemed less likely.
» After a strong rise the retrace was very small.
» The support zone in blue matches the 17-March peak candle wick and close. It has been tested and it holds.
» There is no bearish volume nor any bearish momentum.
There is simply no need for the market to move lower and there are no signals pointing this way. So instead of down, a bullish breakout (continuation) comes next. Seems pretty obvious, the bull market has already been confirmed.
Thank you for reading.
Namaste.

