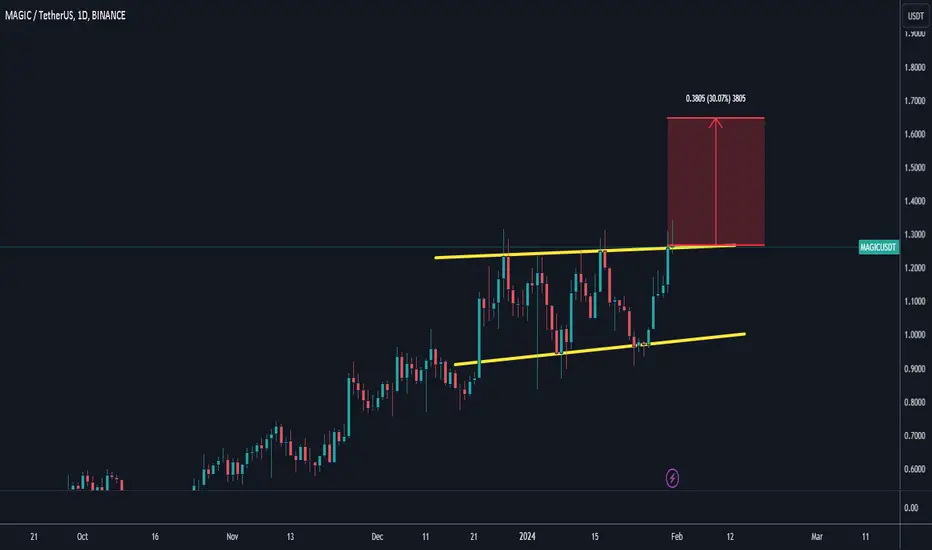
Magic usdt Magic usdt important zoonz
B nazarm ba tawajoh b etefagat koli miton in pishbini ro kard k magic mitone ye bar dge b sootoh bala tar biad
omidvarm por sood bashid
MAGICUSDT.P trade ideas
MAGICUSDT Good Buy!MAGICUSDT Technical analysis update
Buy zone : Below $1.285
MAGICUSDT price has formed an ascending triangle pattern. The price is nearing the resistance line, and a breakout could indicate potential upward movement in MAGIC.
Support : $1.175
Resistance 1: $1.38
Resistance 2: $1.60
Resistance 3: $2.00
Always keep Stop Loss
MAGIC/USDT Break out of resistance level. Bullish Momentum ??💎MAGIC has undeniably garnered significant attention in the market. Currently, it is breaking out of a local resistance level, and there is the potential for a retesting phase, primarily at the support level that was previously a resistance at 1.315.
💎 If the retest proves valid, the price is likely to bounce from this support and continue its upward trajectory. The next significant challenges lie in the bearish OB and supply area. Breaking out of this area would confirm a bullish trend in the mid-term, and the price could probability reach our target zone.
💎 The overall chart pattern appears to be forming a rounding bottom, which is typically considered a bullish pattern. However, if MAGIC fails to bounce when retesting the support, there is a potential for a downward movement, leading to a retest of the bullish trendline.
💎 This level is crucial, and a bounce is required to maintain the bullish stance. Breaking below the bullish trendline would signify a significant trend change, with the next potential support being in the demand area.
💎 The demand area represents the last level of bullish support. A bounce at this level is essential to sustain the bullish momentum. Failure to do so could result in a continuation of the downward movement, eventually reaching the bottom support area.
MAGICUSDT IDEAUPDATE
Looking ready to break pattern.
Breakout can take on proceedings as we predicted !!!
COIN DETAIL
The live price of Treasure is $ 1.306952 per (MAGIC / USD) with a current market cap of $ 337.54M USD. 24-hour trading volume is $ 266.56M USD. MAGIC to USD price is updated in real-time. Treasure is +15.53% in the last 24 hours with a circulating supply of 258.27M
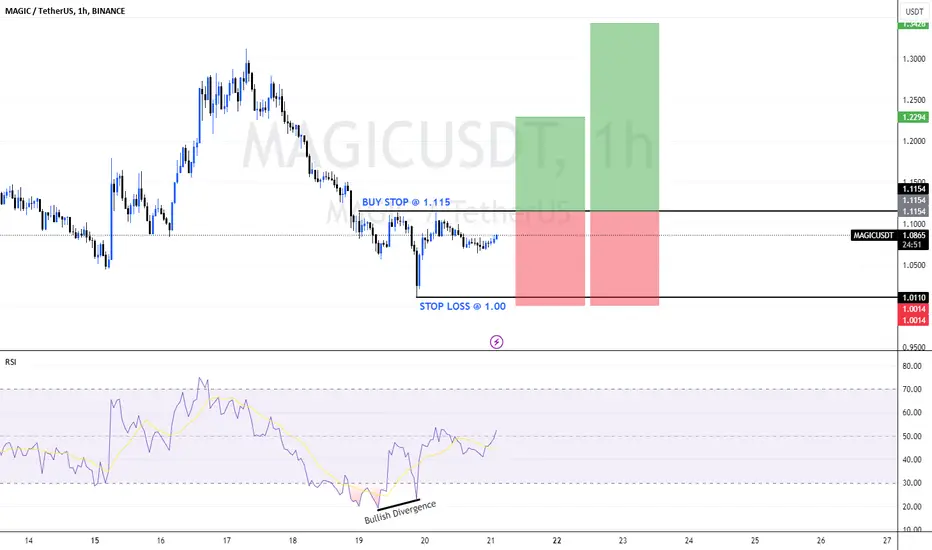
MAGICUSDT - BULLISH OUTLOOKMAGICUSDT is currently exhibiting a pattern of lower lows and lower highs, indicating a downtrend. However, there is a notable bullish divergence on the 1-hour (1H) time frame, suggesting a potential reversal in the prevailing trend.
Here's a concise technical analysis with a suggested trading strategy:
Entry: Consider initiating a long position by placing a buy-stop order at 1.1150.
Stop Loss (SL): Implement a risk management stop loss at 1.00 to mitigate potential losses.
Take Profit (TP): Set take-profit levels to achieve a 1:1 and 1:2 risk-reward ratio:
TP1 = 1.23
TP2 = 1.3450
This trading strategy aims to capitalize on the anticipated bullish reversal signaled by the observed divergence. As with any trading approach, it's essential to monitor the market closely for changing conditions and adjust the strategy accordingly.
MAGIC | Will it explode soon?!The MAGIC chart is significantly bullish
I think we are about to see a God's candle soon.
Stop loss with daily close below 0.7075.

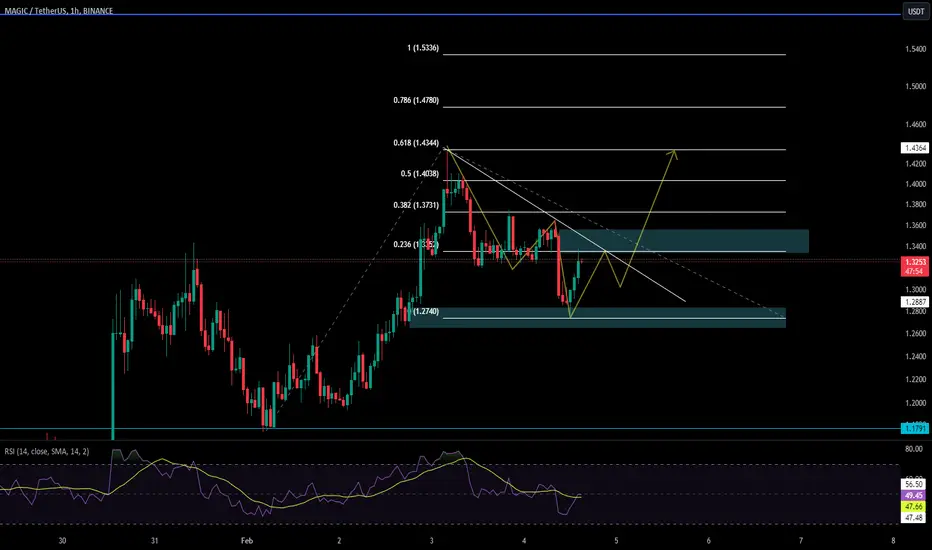
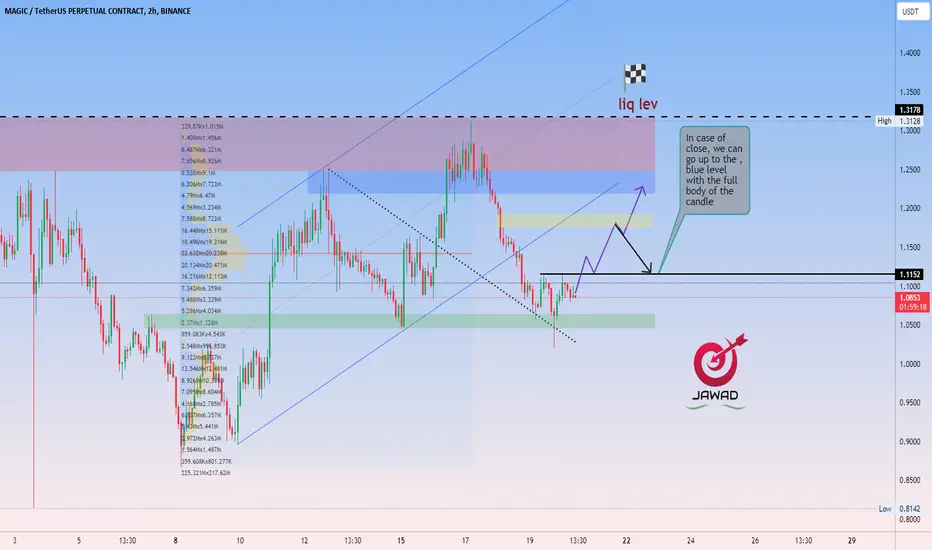
MAGIC ANALYZE 2H BUY Dear Traders,
I hope you're doing well. Happy New Year!
This is my first post in the new year, and I hope it proves useful to you.
In Magic Currency, on the two-hour time frame, the price has broken the ascending channel and consolidated its support level. If the price can close above the black line with good strength, it can first reach the yellow level and then move up to the blue level.
Based on your analytical style, you can find your entry point.
Thank you for your kindness and for following me.
Best regards,
MAGICUSDT.PMAGICUSDT.P is in bearish trend.
Potentially printing LH and LL.
No sign of reversal here.
Trend is in strong bullish we didn,t wait for breakout we sell at CMP.
Magic is performing impressively, X2 or even more!MAGIC is a token connecting gaming communities in the Treasure Metaverse, using Ethereum's Arbitrum for decentralization.
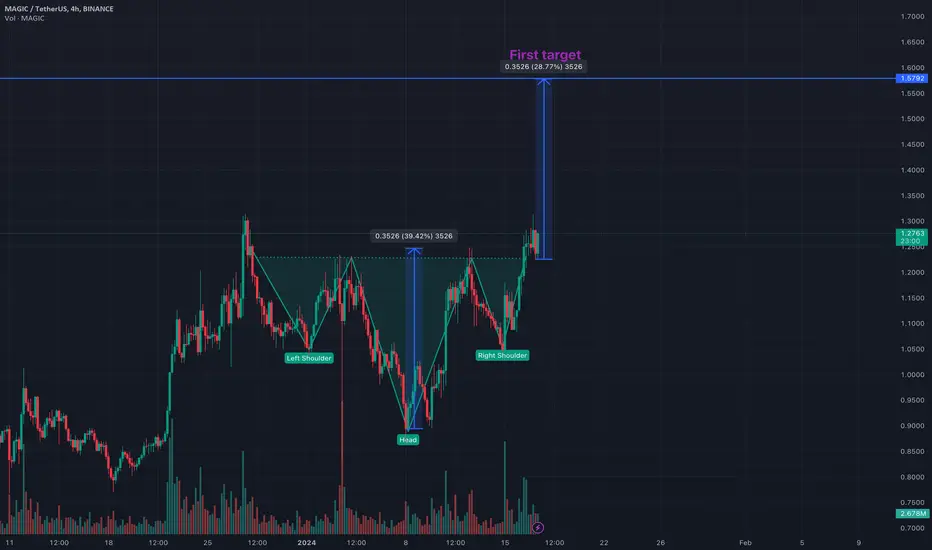
The chart shows a pattern that looks like a reverse head and shoulders. This often indicates a positive trend. I think some Magic might happen soon.
Please do your own research
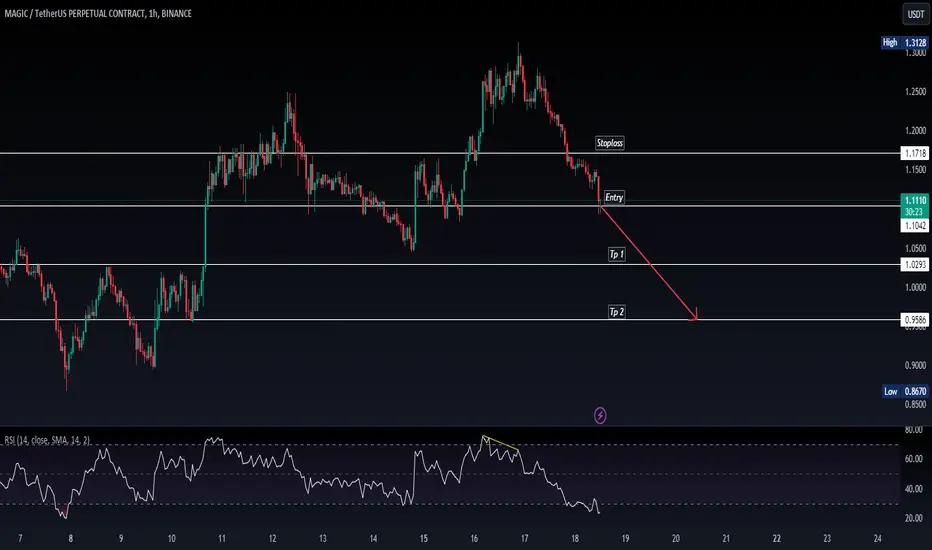
MAGIC SHORT IDEA 4hmagic came to my 5th wave retrace to a T. we have a 4h double top of equal high liquidity tap where now we will drop to $1.
Confluence : end of 5th wave, equal high double top, buy side liq wick zone
down 8 cents since forecast.

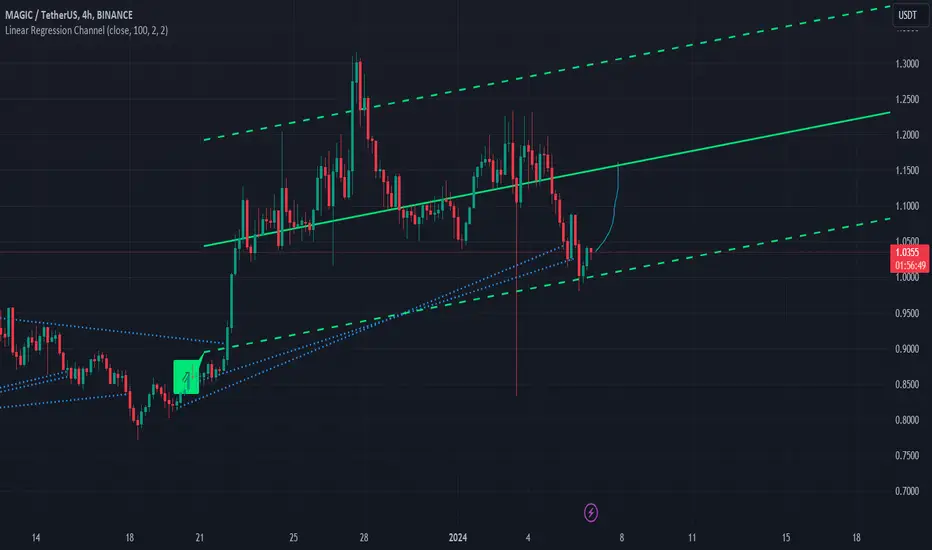
MagicusdtPrice is in a uptrend confirmed by the weekly control candle. 200ma is moving to the upside, supporting price. Price got squeezed and finally looks like it is breaking out.

MAGICUSDT Hi everyone, I think that it will get a reaction from this level and achieve its first target.
Magic for the people, the boys are rippin Magic, if it can hold this 80 range on the retrace maybe higher, if not and it breaks purple its a long way down

#Magic #Magic
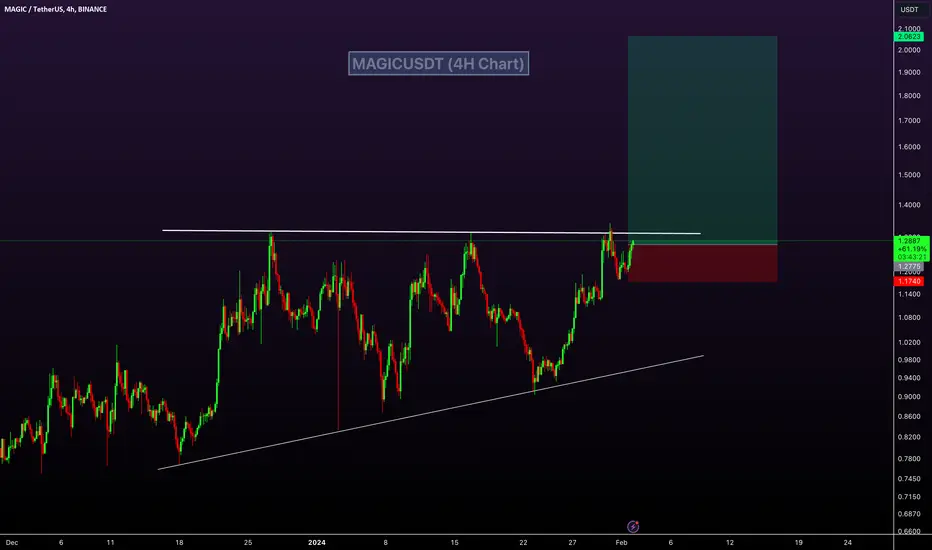
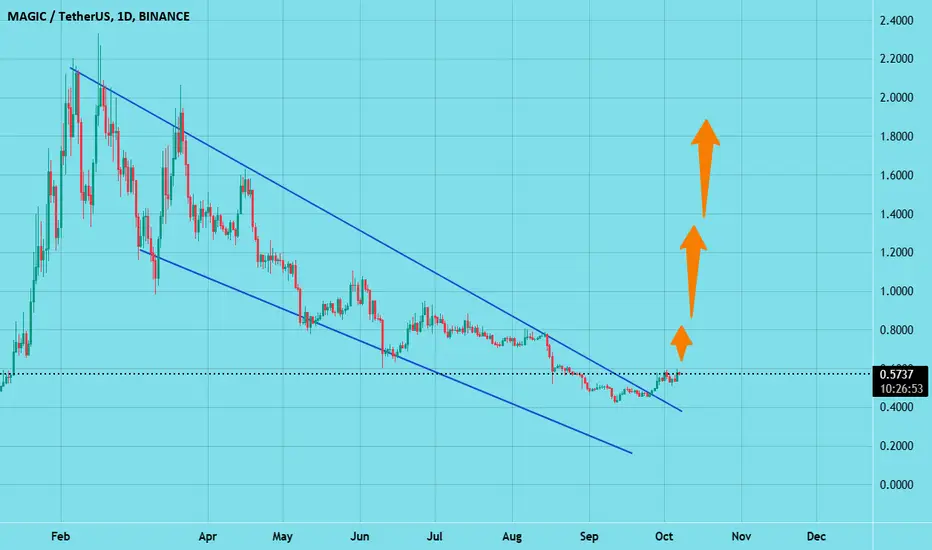
Magic is poised for a significant bullish breakout, with a potential 180-200% rally in the midterm if the price can break above the descending channel resistance.
Magic will be very bullishMagic looks very bullish once it can flip this supply zone in red, however if it reject it here, it can drop back to test the 100MA around .64 before pushing higher.
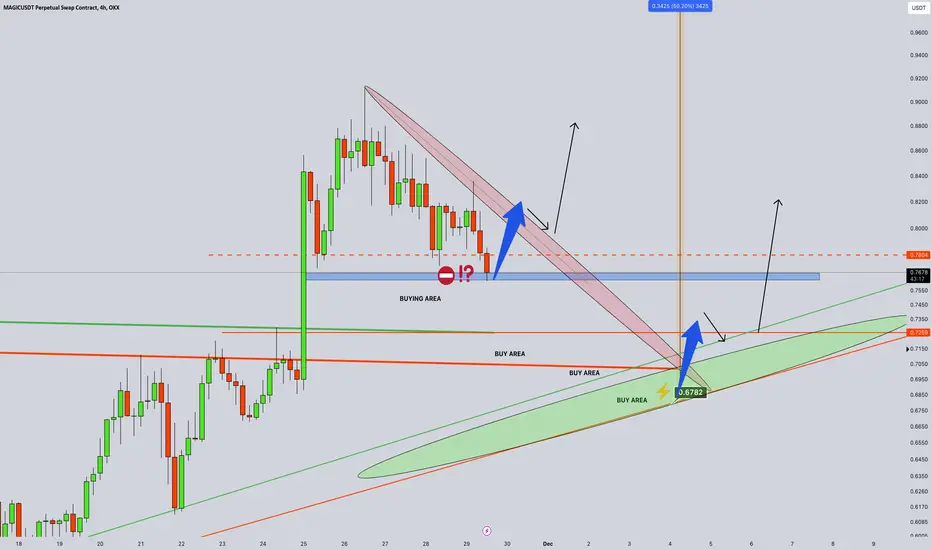
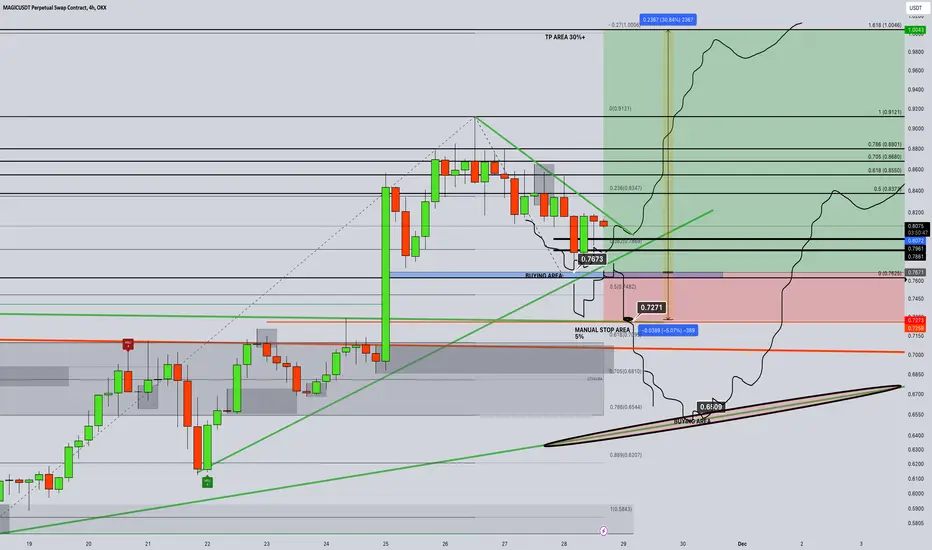
MAGIC/USDT LAST SCENARIOI would like to share the latest status of our chart and explain why I didn't enter at the previous levels of $0.76-$0.77.
Since my target for this coin is over 30%, my priority is to enter positions with minimal risk to safely carry the position. What caught my attention, thanks to my alerts, was the consistent approach to our initial levels without breaking through. Currently, it has established that region as a support level.
A break below that region would mean taking more than a 10% risk for me. Considering the target we have in mind, this isn't ideal. Those who wish can still enter from these levels gradually.
However, for me, entering from the green area starting at $0.65, as you can see in the chart, seems much safer.
With my alerts active, placing orders when it reaches that point and waiting for the targets to be achieved is the most prudent strategy. I hope we achieve maximum gains with minimum risk.
Second MagicUSDT ScenarioPresenting my second analysis for MAGICUSDT. In this assessment, I'm taking into account the potential impact of a Bitcoin correction. If such a correction occurs, I believe this analysis holds merit. Please refer to the attached photo for the primary trend line.
MAGIC USDT (Long Position Setup)Technical Analysis behind MAGIC USDT trade:
1. Supported by the immediate support area & Trendline
2. MFI(Money Flow Index) above 50, a bullish sign.
3. Supported by the 200 Days SMA .
4. RSI is at 40, a bullish sign.
5. Volume analysis also supports the trade.

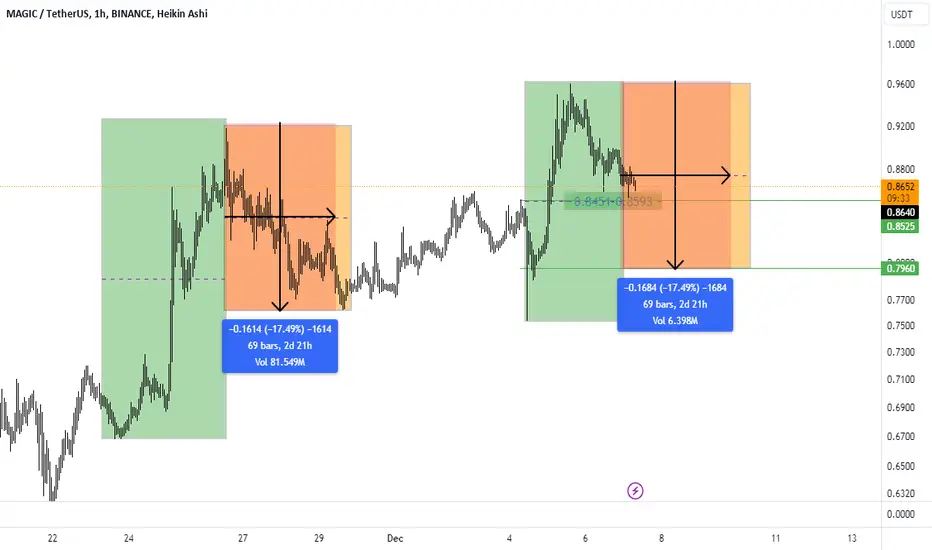
🚨 Trade Alert: MAGIC/USDT (3-5x)🚨 New Trade Alert 🚨
✅ MAGIC/USDT (3-5x)
📈 LONG Entry Zone: 0.844 - 0.89
⛔️ SL: 0.803
🔒 Breakeven Move: When it moves close to TP2
🎯 Take Profit:
Short Term: 0.90 - 0.91 - 0.93 - 0.95 - 0.97
Mid Term: 0.99 - 1.03 - 1.06 - 1.09
📝 Ensure you set entry orders to balance the trade's entry and aim to secure 30% of profits within the first two targets. Once profits are gained, adjust the stop orders to match the entry points or break-even levels.
⚠️ Disclaimer: Historical earnings cannot assure future outcomes. Is there a potential for risk? Certainly. The entire financial market is susceptible to uncertainties; any underlying factor or abrupt shift in market sentiment could overturn the current market trends and lead to losses. Refrain from undertaking undue risks that might jeopardize your financial stability. You are under no obligation to engage in this trade; kindly avoid the trade if you disagree with the trade analysis.
GIS TRADING®

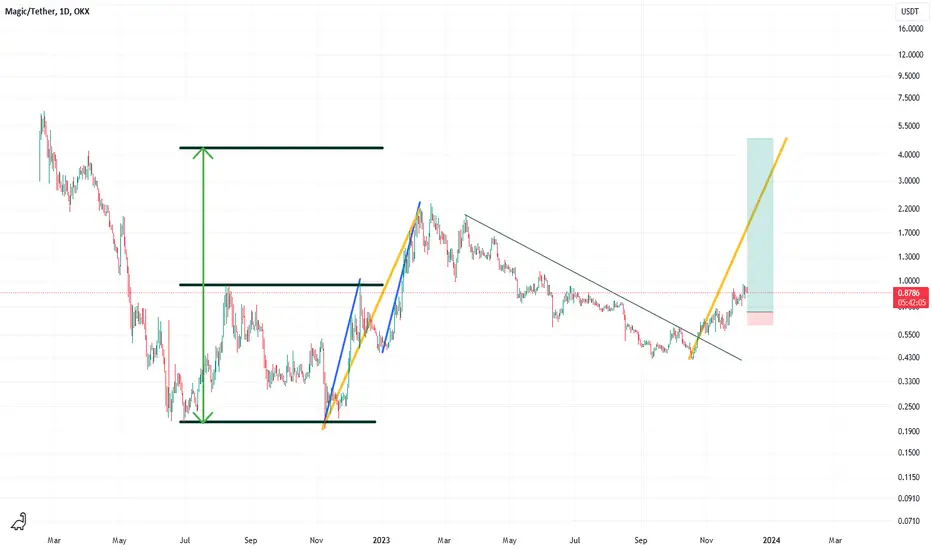
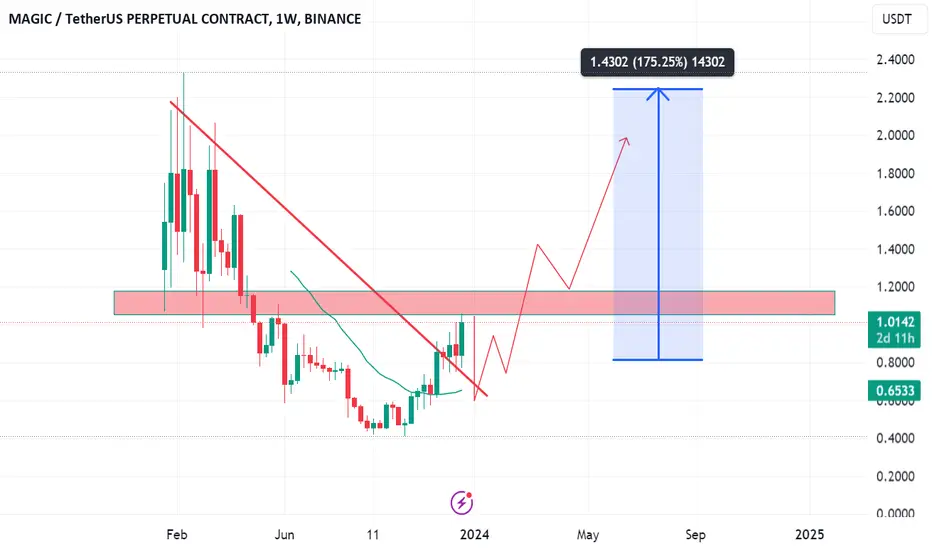
magic very bullishat first we have a big trading range shown by black color that is broked up so our first target is height of the trading range
second , we have a big leg up ( yellow ) and two smaller leg up within it.
we had a correction wave that is broken up and so we are waiting for another big leg upward