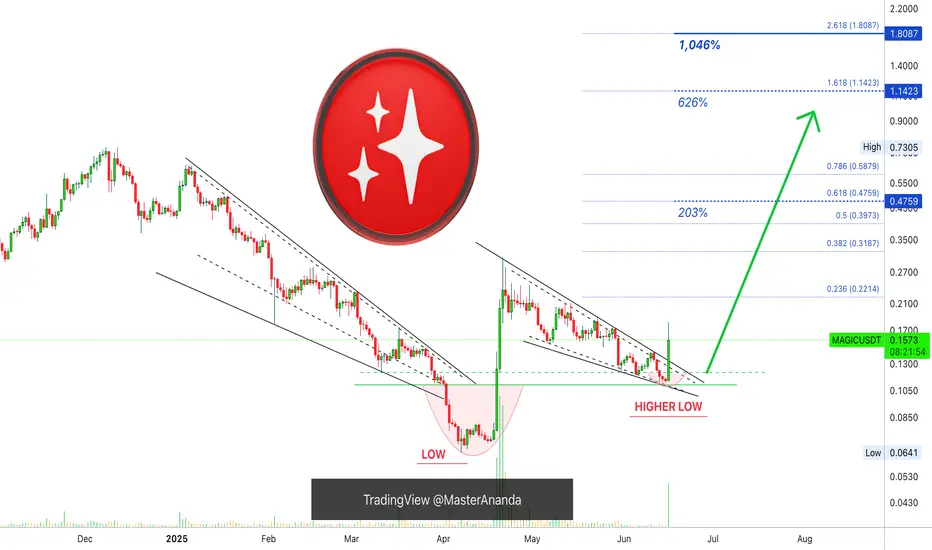
Magic: Higher Low, Falling Wedge & Bullish Continuation (1,046%)It seems like forever, but it is worth it because of the huge potential for growth.
The falling wedge pattern is a classic, we haven't been seeing that many recently and here we have one.
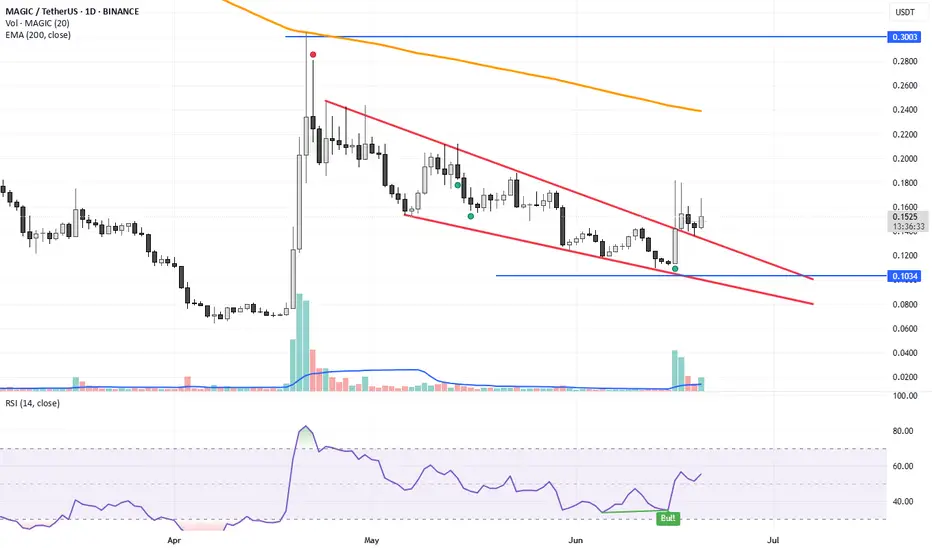
The initial breakout in April only lasted two weeks. MAGICUSDT peaked 21-April and started a long retrace, thi
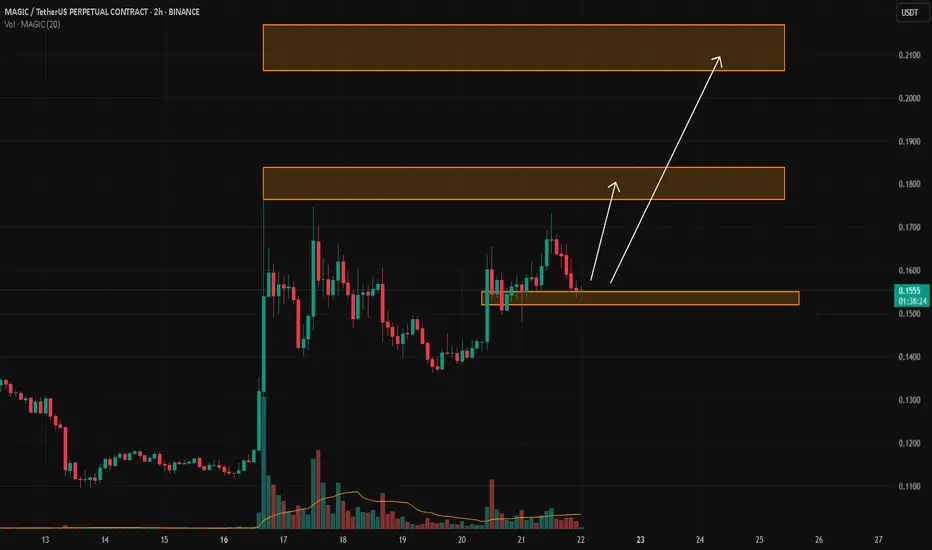
MAGIC/USDTKey Level Zone: 0.1520 - 0.1550
LMT v2.0 detected.
The setup looks promising—price previously trended upward with rising volume and momentum, then retested this zone cleanly. This presents an excellent reward-to-risk opportunity if momentum continues to align.
Introducing LMT (Levels & Momentum Tr
MAGICUSDT Forming Falling WedgeMAGICUSDT is currently showing a highly promising technical setup with the formation of a falling wedge pattern, a historically reliable bullish reversal signal. This pattern, defined by converging trendlines sloping downward, typically signals a pause in a larger bullish trend and sets the stage fo
magic usdt 5x long term 100% gain shorter timealready borken the resistance with daily candle
Can buy now 0.1538 - 0.1800
for long term holding
can get 100% in the short time
if u hold longer can be 5x easily
No need stop loss.
but if u want then use SL: 0.100
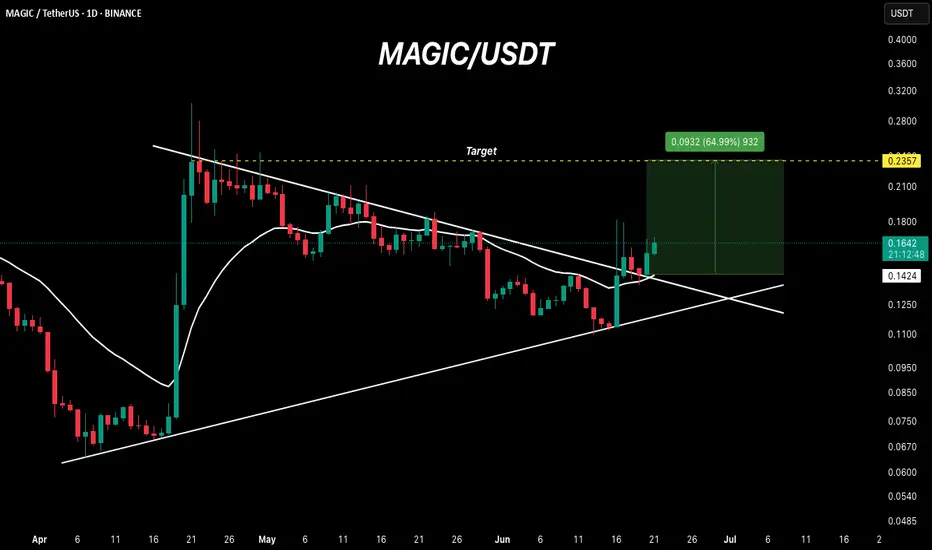
MAGIC broke above the resistance!MAGIC has broken above the daily resistance and is now gearing up for a potential bullish move.
Strategy:
~ Entry: $0.15 to CMP.
~ Trade Period: Short-term.
~ Trade Type: Spot/2x-3x leverage.
~ Target: 50%-60%.
Note: Always do your own research and analysis before investing.
Regards,
Dexter.
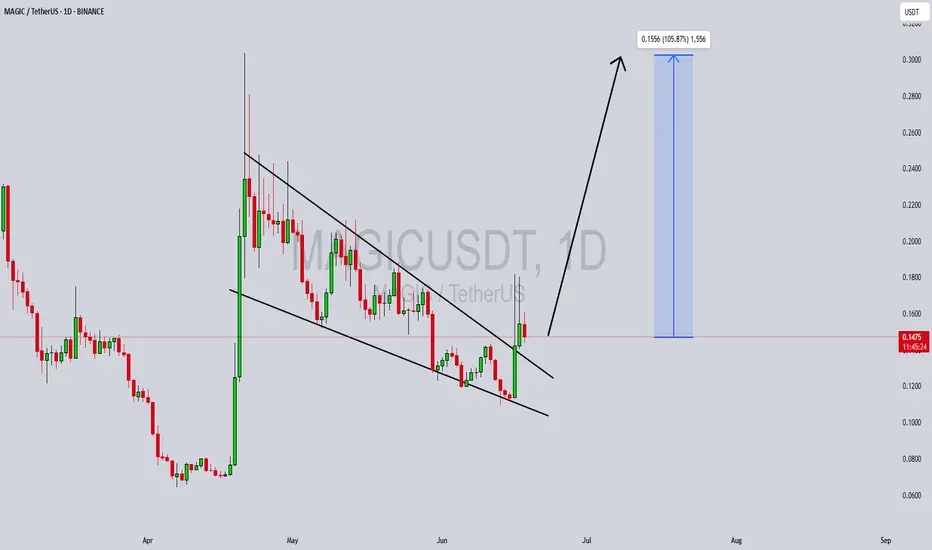
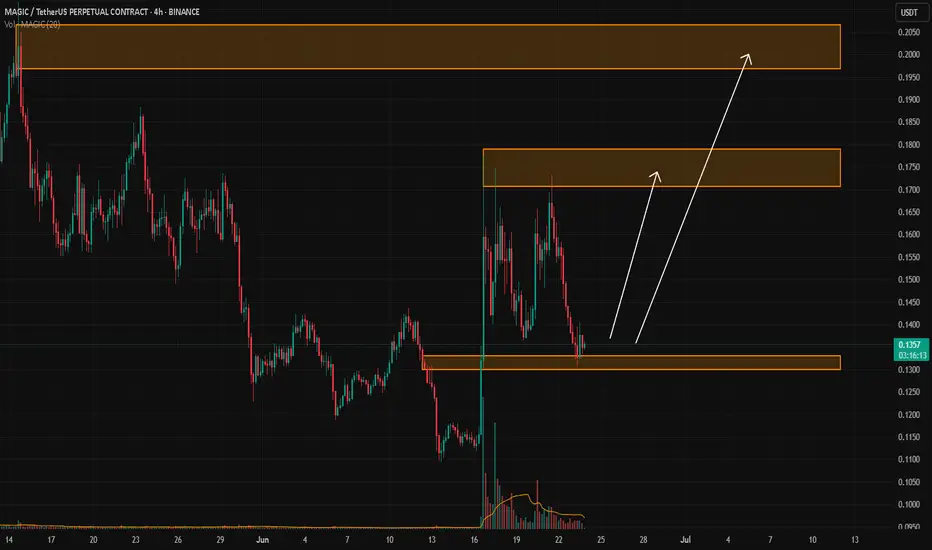
$MAGIC broke out!After weeks of grinding inside a falling channel, OMXTSE:MAGIC finally broke out with a sharp 20% move!
- Channel breakout confirmed
- Price reclaimed the support zone around $0.145
- Resistance zone ahead: $0.185–$0.20
Now it’s all about momentum. If bulls hold above the breakout area, we could
magic usdtbuy 0.14 - 0.17
sell 0.3
almost 100% gain can get within 1 week.
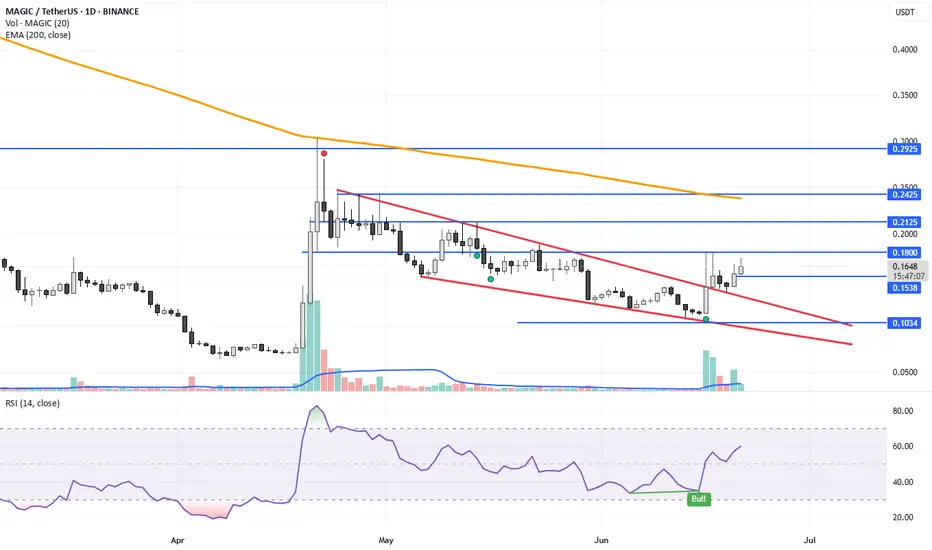
STOP Loss 0.1034
Resistance broken with Daily Candle
RSI Divergence Daily candle
Spot trading only.
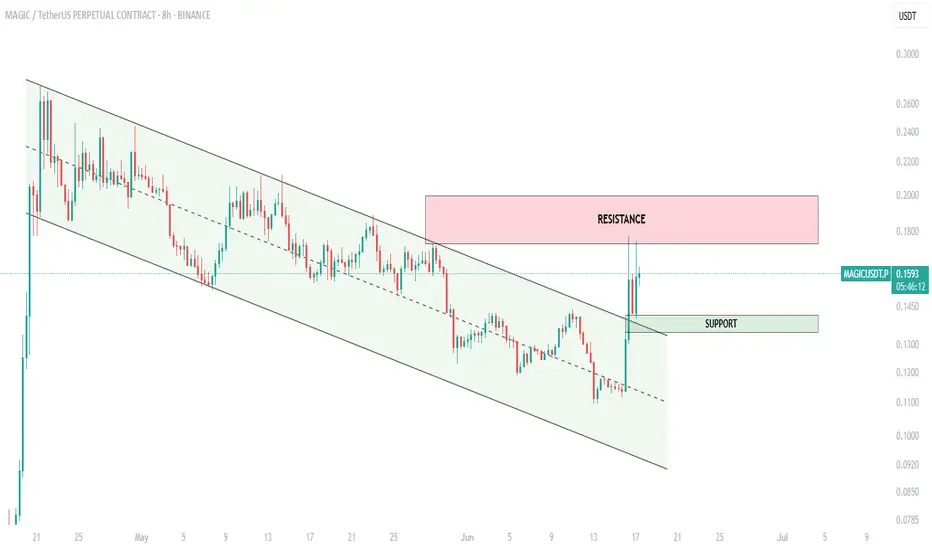
MAGIC - LONG SET-UP BINANCE:MAGICUSDT
𝐌𝐀𝐆𝐈𝐂/𝐔𝐒𝐃𝐓
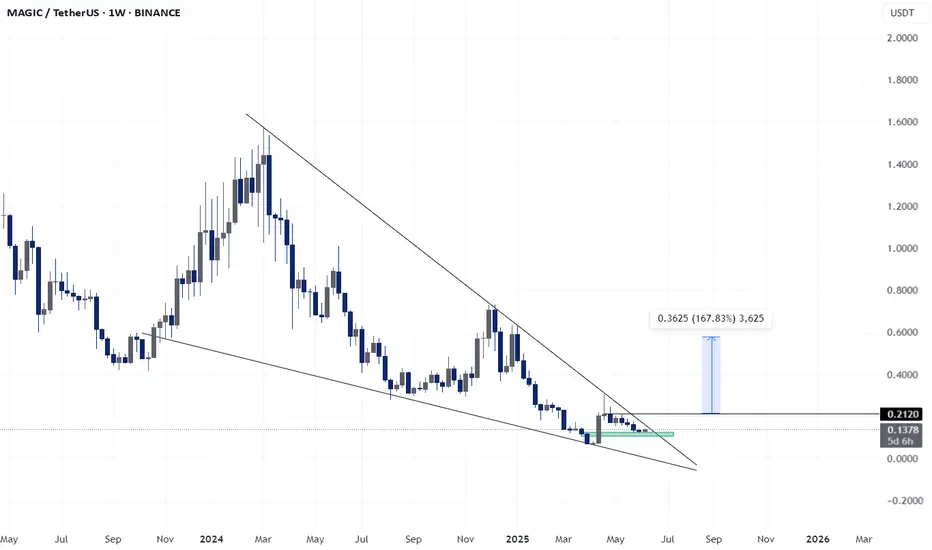
Magic is breaking out of a long-term falling wedge pattern, a classic bullish reversal setup. With clear support at $0.125 and resistance at $0.2120 breached, this chart implies a potential 167% upside move toward the $0.36+ zone. Momentum building
MAGIC/USDT (2nd update)Key Level Zone: 0.1300 - 0.1330
LMT v2.0 detected.
The setup looks promising—price previously trended upward with rising volume and momentum, then retested this zone cleanly. This presents an excellent reward-to-risk opportunity if momentum continues to align.
Introducing LMT (Levels & Momentum Tr
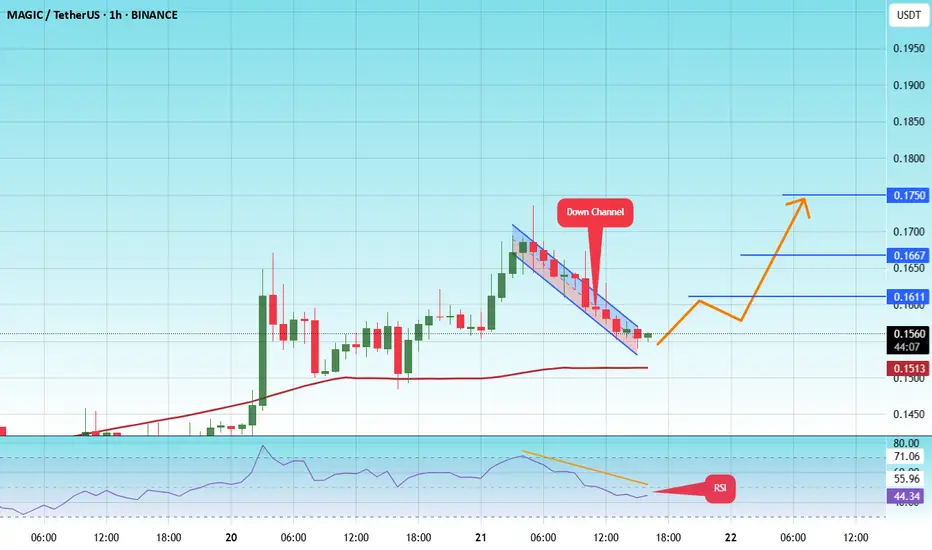
#MAGIC/USDT#MAGIC
The price is moving within a descending channel on the 1-hour frame and is expected to break and continue upward.
We have a trend to stabilize above the 100 moving average once again.
We have a downtrend on the RSI indicator, which supports the upward move by breaking it upward.
We have a
See all ideas
Summarizing what the indicators are suggesting.
Oscillators
Neutral
SellBuy
Strong sellStrong buy
Strong sellSellNeutralBuyStrong buy
Oscillators
Neutral
SellBuy
Strong sellStrong buy
Strong sellSellNeutralBuyStrong buy
Summary
Neutral
SellBuy
Strong sellStrong buy
Strong sellSellNeutralBuyStrong buy
Summary
Neutral
SellBuy
Strong sellStrong buy
Strong sellSellNeutralBuyStrong buy
Summary
Neutral
SellBuy
Strong sellStrong buy
Strong sellSellNeutralBuyStrong buy
Moving Averages
Neutral
SellBuy
Strong sellStrong buy
Strong sellSellNeutralBuyStrong buy
Moving Averages
Neutral
SellBuy
Strong sellStrong buy
Strong sellSellNeutralBuyStrong buy
Displays a symbol's price movements over previous years to identify recurring trends.