#MAGIC/USDT Reversal in MAGICUSDT Accumulation Zone in Focus #MAGIC
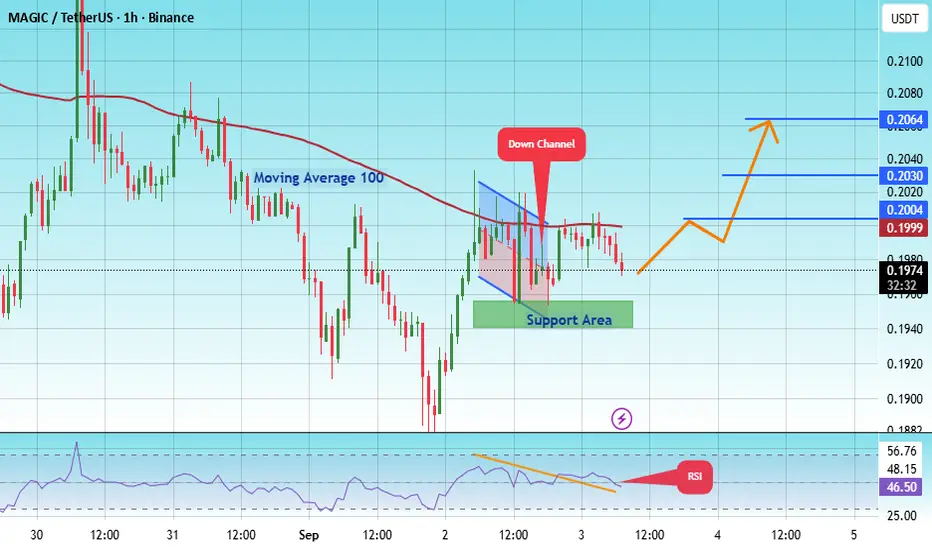
The price is moving within a descending channel on the 1-hour frame, adhering well to it, and is heading for a strong breakout and retest.
We have a bearish trend on the RSI indicator that is about to be broken and retested, which supports the upward breakout.
There is a major support area in green at 0.1950, which represents a strong support point.
For inquiries, please leave a comment.
We are in a consolidation trend above the 100 Moving Average.
Entry price: 0.1974
First target: 0.2000
Second target: 0.2030
Third target: 0.2064
Don't forget a simple matter: capital management.
When you reach the first target, save some money and then change your stop-loss order to an entry order.
For inquiries, please leave a comment.
Thank you.
MAGICUSDT trade ideas
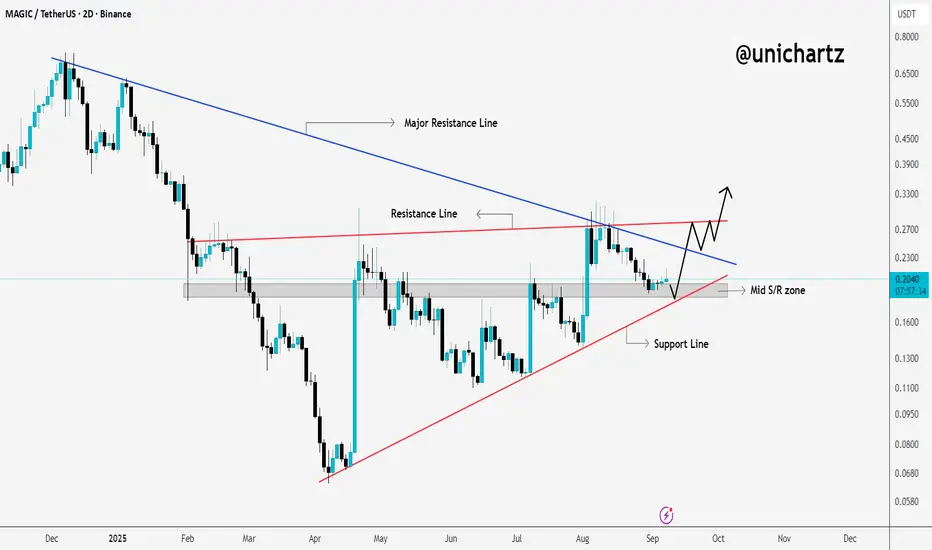
Breakout Above Resistance Could Fuel Strong Rally$MAGIC/USDT has been moving inside a clear structure where buyers and sellers are battling for control.
The major resistance line above has acted as a strong barrier multiple times, and a clean breakout here could open the door for a much stronger bullish move.
On the flip side, the ascending support line has been holding well, showing steady higher lows and signaling that buyers are still active. The mid support–resistance zone has also been a key pivot area, with price bouncing off it several times.
As long as price continues to respect this support and manages to push through the resistance trendline, the bias remains bullish.
If it fails to hold the support, though, the structure weakens and further downside becomes possible.
More updates coming soon, stay tuned.
DYOR, NFA
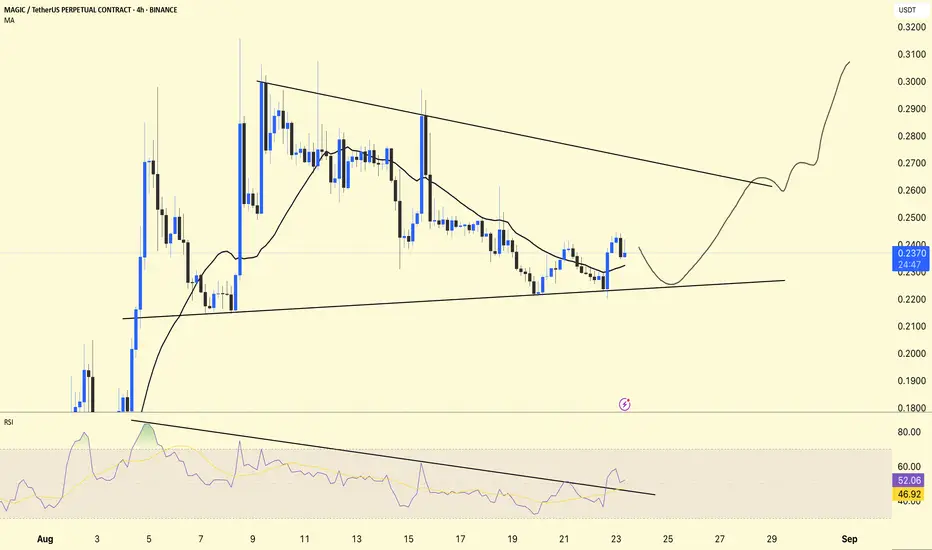
MAGIC/USDT 4H Analysis !!
MAGIC is currently trading at $0.2376, showing a falling wedge structure with RSI breakout confirmation.
📊 Chart Overview:
Falling Wedge Pattern
The price is consolidating between a lower high and a higher low.
If it breaks to the upside, it is a bullish reversal pattern.
Support Area
Strong support (trendline support) near $0.22–0.225.
As long as this level holds, downside looks limited.
RSI Indicator
RSI = 52.64, above its MA (46.96).
RSI broke its downtrend line → early sign of bullish momentum building.
Moving Average (MA 25)
The price is slightly above the moving average (0.2324), which is a sign of short-term correction.
DYOR | NFA
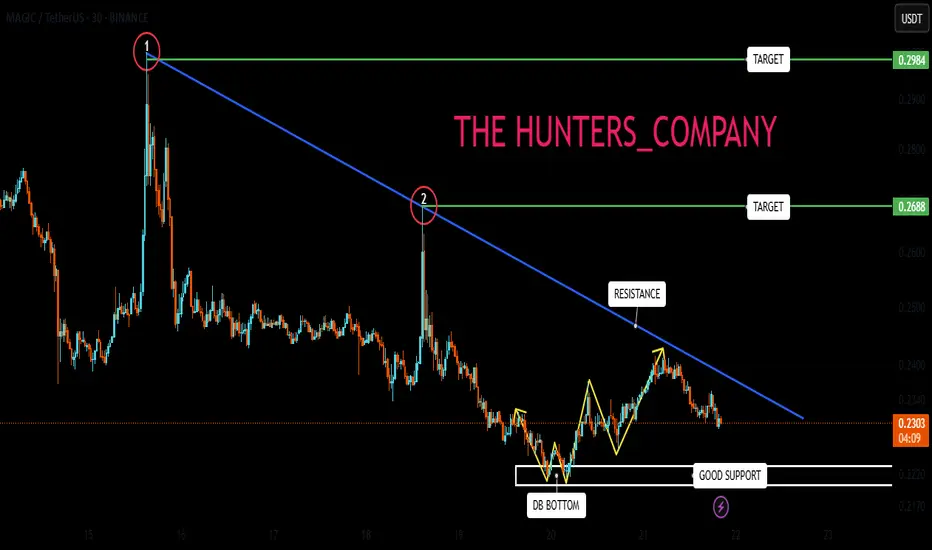
Important resistance blocking the way to the ascent...Hello friends
Well, we have a downtrend, and you can see that we have drawn a resistance for it, and the price has hit this resistance twice.
After the second hit, the price has fallen to the specified support area, and in that area a double bottom pattern has formed, and the price has been supported. Now, considering the support in this price area, we need to see if the buyers can break the specified resistance or not?
If the resistance is broken, the price can move up to the two specified areas, but if the price falls, we need to see if the support that once supported the price and caused the price to grow can support it again or not?
So, follow capital and risk management
*Trade safely with us*
#MAGIC/USDT Reversal in MAGICUSDT Accumulation Zone in Focus !#MAGIC
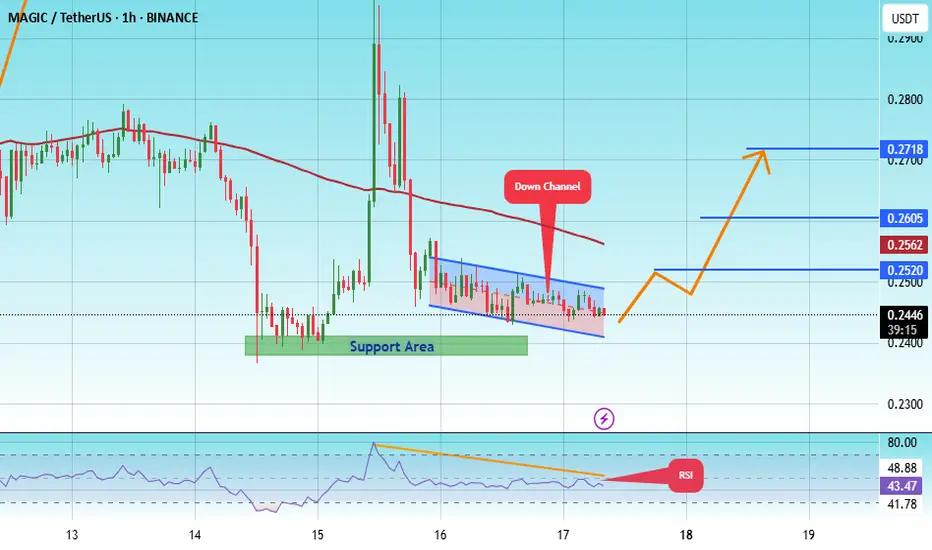
The price is moving within an ascending channel on the 1-hour frame, adhering well to it, and is on its way to breaking strongly upwards and retesting it.
We have support from the lower boundary of the ascending channel, at 0.2419.
We have a downtrend on the RSI indicator that is about to break and retest, supporting the upside.
There is a major support area in green at 0.2390, which represents a strong basis for the upside.
Don't forget a simple thing: ease and capital.
When you reach the first target, save some money and then change your stop-loss order to an entry order.
For inquiries, please leave a comment.
We have a trend to hold above the 100 Moving Average.
Entry price: 0.2445.
First target: 0.2520.
Second target: 0.2605.
Third target: 0.2718.
Don't forget a simple thing: ease and capital.
When you reach the first target, save some money and then change your stop-loss order to an entry order.
For inquiries, please leave a comment.
Thank you.
#MAGIC/USDT Reversal in MAGICUSDT Accumulation Zone in Focus !#MAGIC
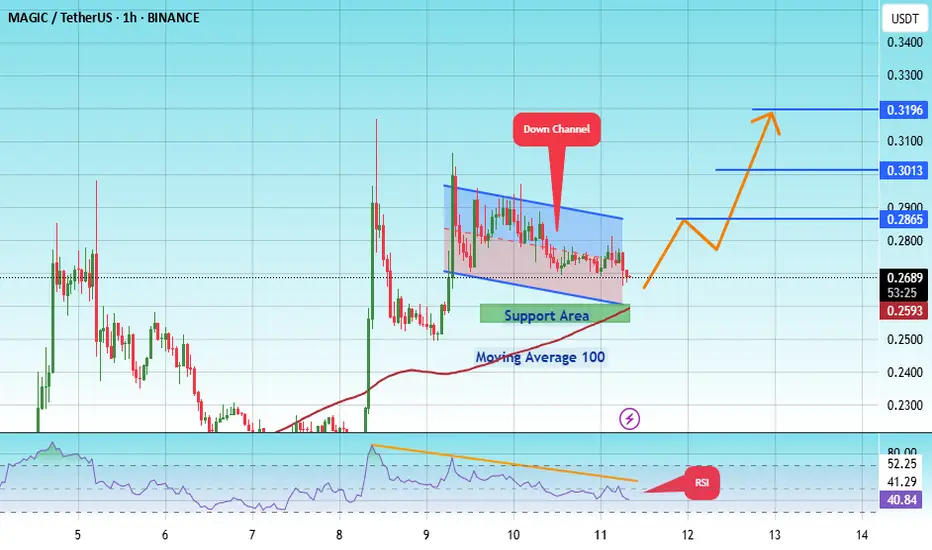
The price is moving within an ascending channel on the 1-hour frame, adhering well to it, and is on its way to breaking strongly upwards and retesting it.
We have support from the lower boundary of the ascending channel, at 0.2630.
We have a downtrend on the RSI indicator that is about to be broken and retested, supporting the upside.
There is a major support area in green at 0.2565, which represents a strong basis for the upside.
Don't forget a simple thing: ease and capital.
When you reach the first target, save some money and then change your stop-loss order to an entry order.
For inquiries, please leave a comment.
We have a trend to hold above the 100 Moving Average.
Entry price: 0.2690.
First target: 0.2865.
Second target: 0.3013.
Third target: 0.3196.
Don't forget a simple thing: ease and capital.
When you reach your first target, save some money and then change your stop-loss order to an entry order.
For inquiries, please leave a comment.
Thank you.
MAGIC (SPOT)BINANCE:MAGICUSDT
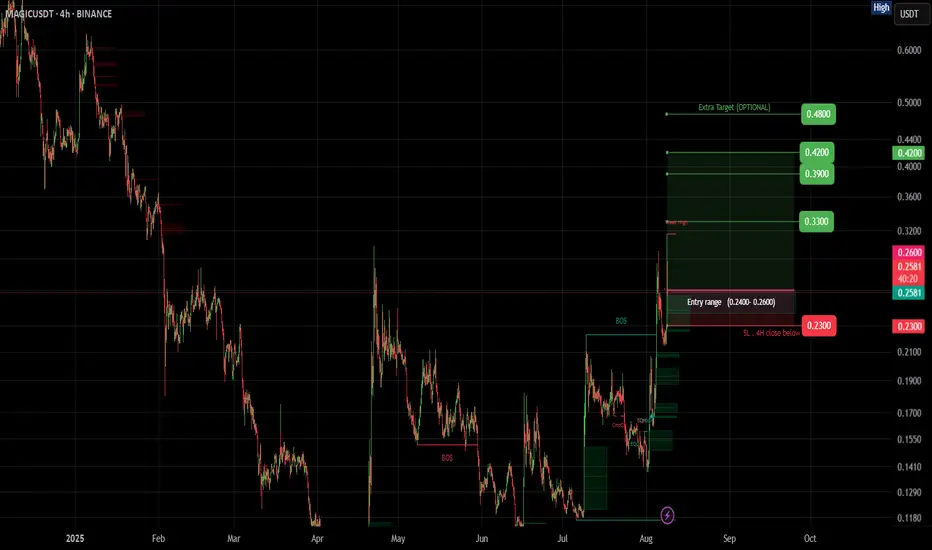
#MAGIC / USDT
Entry range (0.240- 0.260)
SL 4H close below 0.230
T1 0.33
T2 0.39
T3 0.42
Extra Targets
T1 0.48
_______________________________________________________
Golden Advices.
********************
* collect the coin slowly in the entry range.
* Please calculate your losses before the entry.
* Do not enter any trade you find it not suitable for you.
* No FOMO - No Rush , it is a long journey.
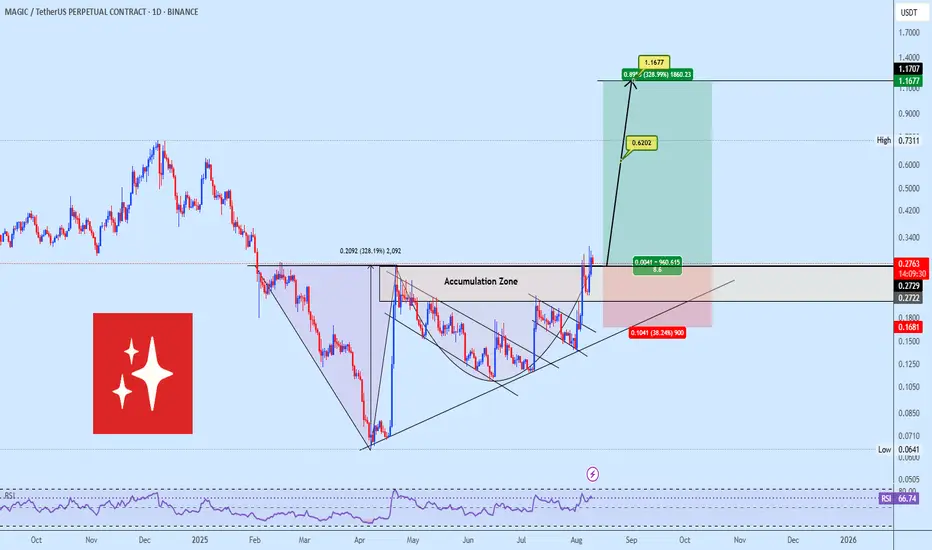
Bullish Reversal in MAGICUSDT Accumulation Zone in FocusMAGICUSDT confirms a strong Adam & Eve reversal pattern with price successfully breaking above the neckline. The highlighted accumulation zone, which aligns with immediate demand, is the optimal re-entry area for positioning. The pattern projects a final target near $1.167, offering a clear bullish pathway. Share your view on this setup.
MAGIC Buy/Long Setup (1D)On the chart, an important trigger line has been broken. A strong bullish CH (Change of Character) is also visible on the chart.
The green zone is a low-risk area for a rebuy.
Targets are marked on the chart.
A daily candle close below the invalidation level will invalidate this analysis.
For risk management, please don't forget stop loss and capital management
Comment if you have any questions
Thank You

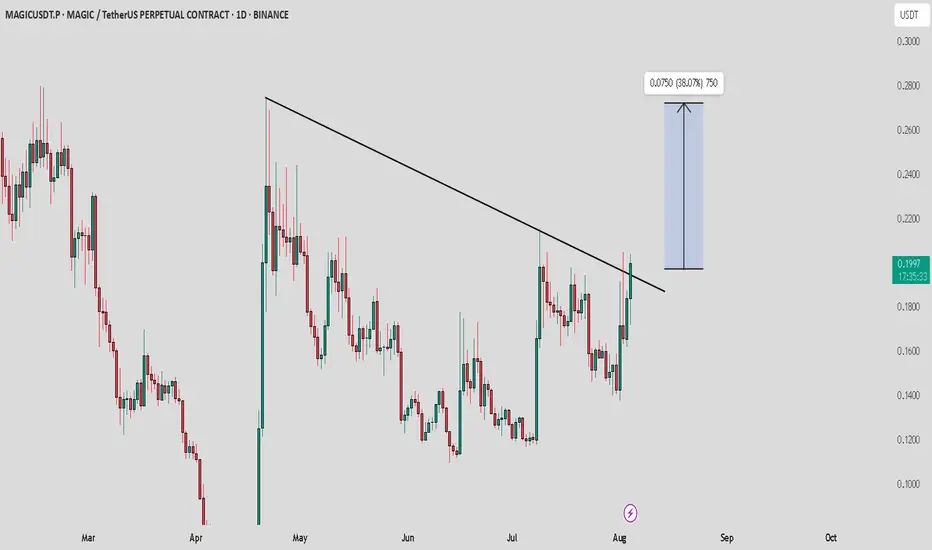
MAGIC / USDT : Bullish breakout alert
MAGIC/USDT has recently broken its descending trendline, signaling potential for a 35 - 50% upside move in the coming weeks. This breakout could lead to significant growth if the bullish momentum continues!
Key Point: A solid retest above the breakout zone will confirm the uptrend, targeting a potential rise of up to 0.25. Stay alert!
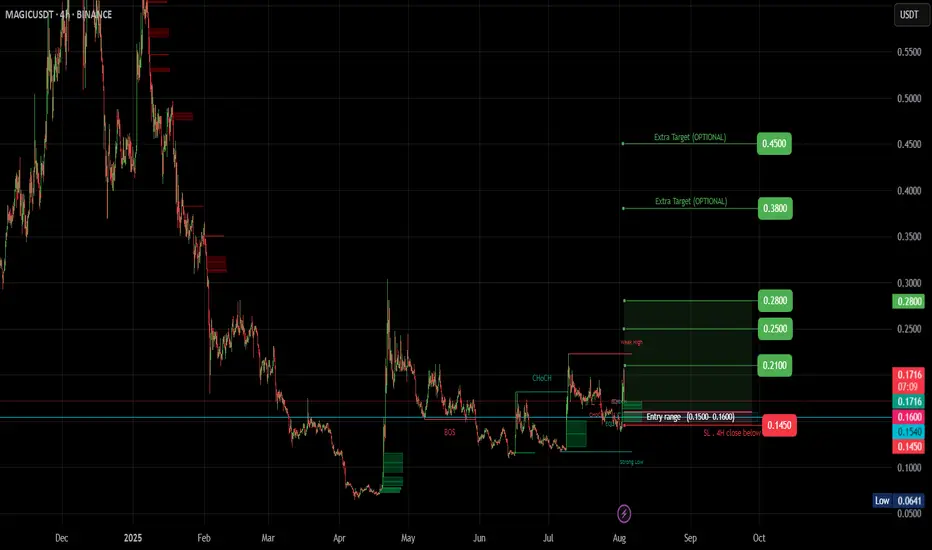
MAGIC (SPOT)BINANCE:MAGICUSDT
#MAGIC / USDT
Entry range (0.150- 0.160) **** Wait for the price to come to the entry range ****
SL 4H close below 0.145
T1 0.210
T2 0.250
T3 0.280
Extra Targets
T1 0.380
T2 0.450
_______________________________________________________
Golden Advices.
********************
* collect the coin slowly in the entry range.
* Please calculate your losses before the entry.
* Do not enter any trade you find it not suitable for you.
* No FOMO - No Rush , it is a long journey.
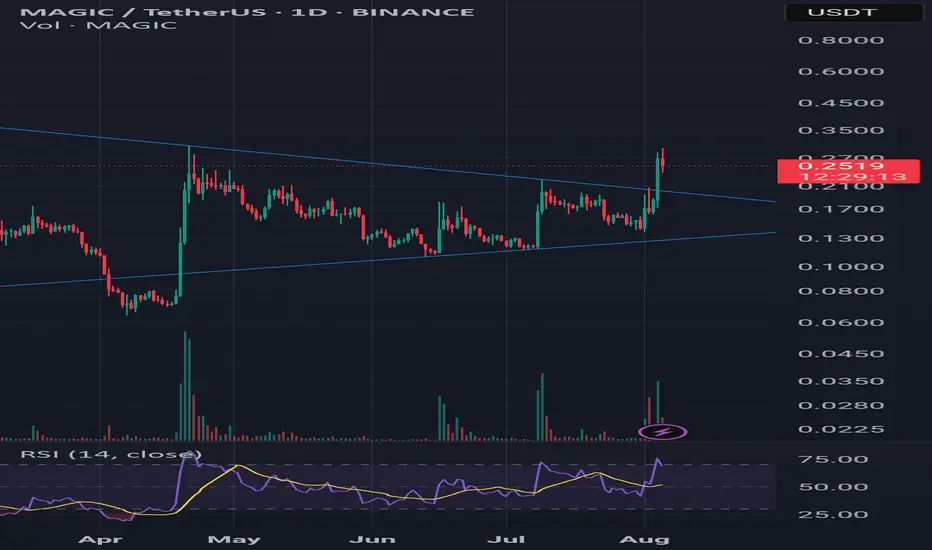
MAGIC / USDT – Symmetrical Triangle Breakout | Pullback OpportunMAGIC has recently broken out of a symmetrical triangle pattern that had been forming for several months. The breakout occurred with strong bullish volume and was accompanied by an RSI breakout above its MA, suggesting solid momentum behind the move.
📏 Technical Notes:
A descending dynamic resistance has been finally broken.
The price has clearly exited the symmetrical triangle, which often leads to explosive moves.
According to the height of the triangle’s base (~0.22), a technical target of around 0.45–0.47 can be projected.
📉 Possible Pullback:
A retest of the breakout zone around 0.20–0.21 is likely before continuation. This area also aligns with the upper triangle boundary, now turned into support.
---
🎯 Bullish Targets (Based on Triangle Breakout):
TP1: 0.30
TP2: 0.42
TP3: 0.47 (Full triangle target)
---
🛑 Stop Loss Suggestion:
Below 0.19, if the breakout fails and the price falls back into the triangle.
---
📊 Indicators:
RSI above 70 with bullish crossover.
Volume spike during breakout confirms institutional or whale interest.
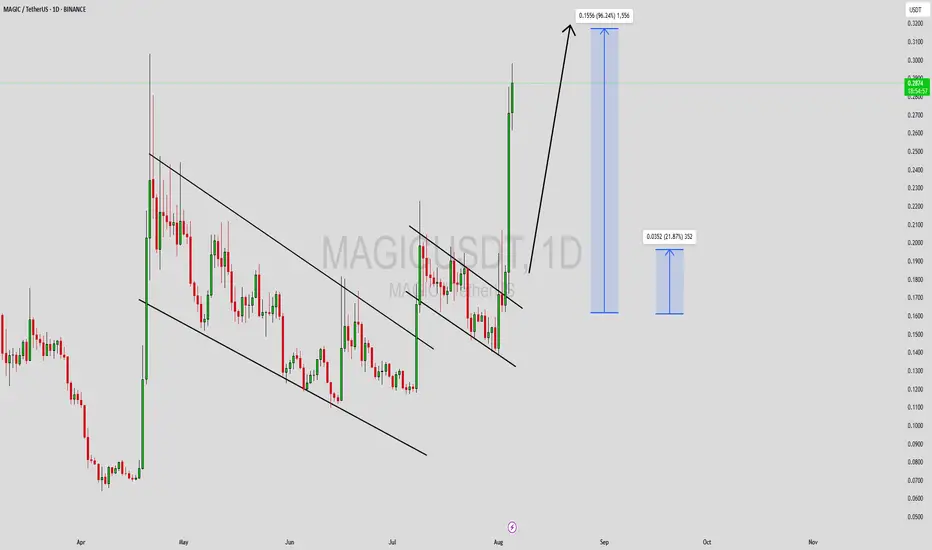
MAGICUSDT Forming Falling WedgeMAGICUSDT is currently forming a classic Falling Wedge Pattern, a bullish reversal setup that often indicates a trend shift from bearish to bullish. This pattern is characterized by converging trendlines that slope downward, with declining volume throughout its formation—a sign that selling pressure is gradually decreasing. The breakout from this structure is typically explosive, making this setup highly attractive to traders looking for high-reward opportunities.
Volume on MAGICUSDT remains strong, a vital confirmation for the validity of the wedge pattern. Sustained buying volume after a breakout often signals the beginning of a substantial rally. As of now, MAGIC appears poised to challenge resistance levels, and if the breakout occurs, we could see a price surge of 90% to 100% or more, aligning with historical wedge breakouts in crypto markets.
The broader sentiment around the MAGIC ecosystem is also showing positive momentum. As a key player in the decentralized gaming and NFT infrastructure space, MAGIC has consistently drawn attention from investors who believe in the long-term potential of Web3 gaming. Its integration with various metaverse projects and innovative use cases continues to attract both developers and traders.
This combination of bullish technical structure, growing trading interest, and strong fundamentals makes MAGICUSDT one of the more promising setups in the current market cycle. Keep an eye on key breakout levels, as the next leg up could come with swift and significant price movement.
✅ Show your support by hitting the like button and
✅ Leaving a comment below! (What is You opinion about this Coin)
Your feedback and engagement keep me inspired to share more insightful market analysis with you!
MAGIC : Magic is neededHello friends🙌
📈Given the good rise we had, the price is now in the ascending channel, now in the specified support areas, you can buy in steps with risk and capital management and move to the specified targets.
🔥Follow us for more signals🔥
*Trade safely with us*

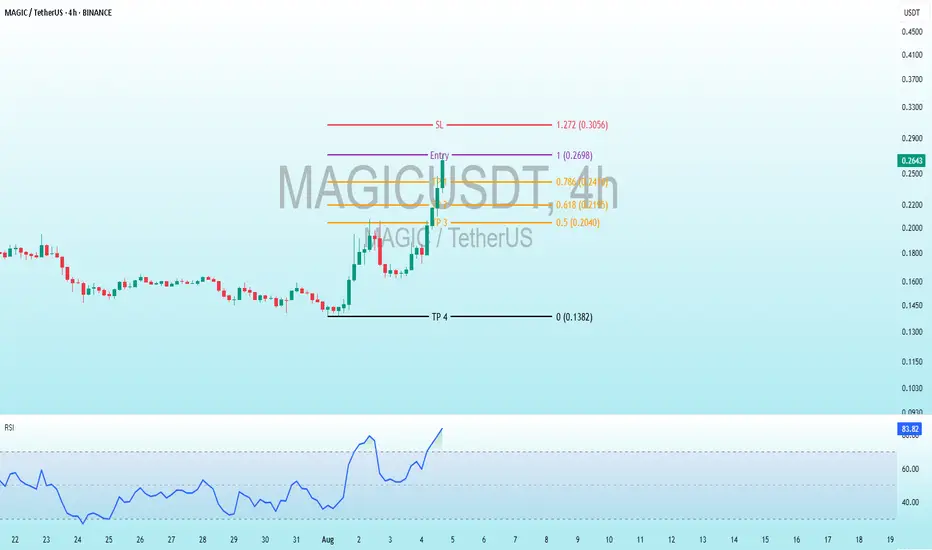
MAGIC Bearish DivergenceBINANCE:MAGICUSDT
Trade Setup:
Target 1: 0.2416(0.786 Fibonnaci Golden Zone).
Target 2: 0.2195 (0.618 Fibonnaci Golden Zone).
Target 3: 0.2040 (0.5 Fibonnaci Golden Zone).
Target 4: 0.1382 (0 Fibonnaci).
Stop Loss: 0.2979 (1.272 Fibonacci).
The RSI is at 84.33, indicating overbought conditions (above 70), which suggests a potential reversal or consolidation may be near unless the trend strengthens further.
magic short Long upper wicks (like inverted hammers or shooting stars)
Multiple candles failing to close above $0.21–0.215
Bearish volume spike with price stalling = aggressive sellers
Low volume stall = buyers exhausted
Dropping from above 70
Bearish divergence vs price
You can consider a short with a tight stop just above $0.215–0.22
Targets: $0.1980 → $0.1880 → $0.1780
#MAGIC/USDT Falling Wedge + Fib Confluence #MAGIC
The price is moving within a descending channel on the 1-hour frame, adhering well to it, and is on its way to breaking strongly upwards and retesting it.
We have support from the lower boundary of the descending channel at 0.1620.
We have a downtrend on the RSI indicator that is about to be broken and retested, supporting the upside.
There is a major support area in green at 0.1662, which represents a strong basis for the upside.
Don't forget a simple thing: ease and capital.
When you reach the first target, save some money and then change your stop-loss order to an entry order.
For inquiries, please leave a comment.
We have a trend to hold above the 100 Moving Average.
Entry price: 0.1780.
First target: 0.1827.
Second target: 0.1905.
Third target: 0.1962.
Don't forget a simple thing: ease and capital.
When you reach your first target, save some money and then change your stop-loss order to an entry order.
For inquiries, please leave a comment.
Thank you.

#MAGIC/USDT#MAGIC
The price is moving within a descending channel on the 1-hour frame, adhering well to it, and is on its way to breaking strongly upwards and retesting it.
We have support from the lower boundary of the descending channel, at 0.1474.
We have a downtrend on the RSI indicator that is about to break and retest, supporting the upside.
There is a major support area in green at 0.1700, which represents a strong basis for the upside.
Don't forget a simple thing: ease and capital.
When you reach the first target, save some money and then change your stop-loss order to an entry order.
For inquiries, please leave a comment.
We have a trend to hold above the 100 Moving Average.
Entry price: 0.1800.
First target: 0.1837.
Second target: 0.1900.
Third target: 0.1958.
Don't forget a simple thing: ease and capital.
When you reach your first target, save some money and then change your stop-loss order to an entry order.
For inquiries, please leave a comment.
Thank you.

#MAGIC/USDT#MAGIC
The price is moving within a descending channel on the 1-hour frame, adhering well to it, and is on its way to breaking strongly upwards and retesting it.
We have support from the lower boundary of the descending channel, at 0.1560.
We have a downtrend on the RSI indicator that is about to break and retest, supporting the upside.
There is a major support area in green at 0.1555, which represents a strong basis for the upside.
Don't forget a simple thing: ease and capital.
When you reach the first target, save some money and then change your stop-loss order to an entry order.
For inquiries, please leave a comment.
We have a trend to hold above the 100 Moving Average.
Entry price: 0.1600.
First target: 0.1640.
Second target: 0.1677.
Third target: 0.1719.
Don't forget a simple thing: ease and capital.
When you reach your first target, save some money and then change your stop-loss order to an entry order.
For inquiries, please leave a comment.
Thank you.

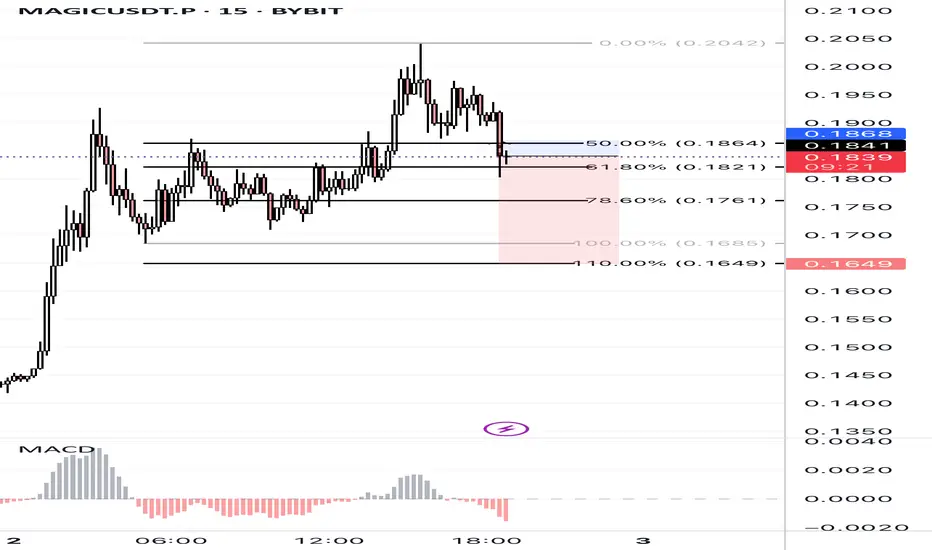
MAGICUSDT.P 15m – Short Setup at Key Fib ResistancePrice sharply rejected from the 0.2042 high and is now breaking below the 50%–61.8% Fibonacci retracement zone after a lower high. The move shows strong selling interest, aligning with MACD histogram momentum shift into the negative.
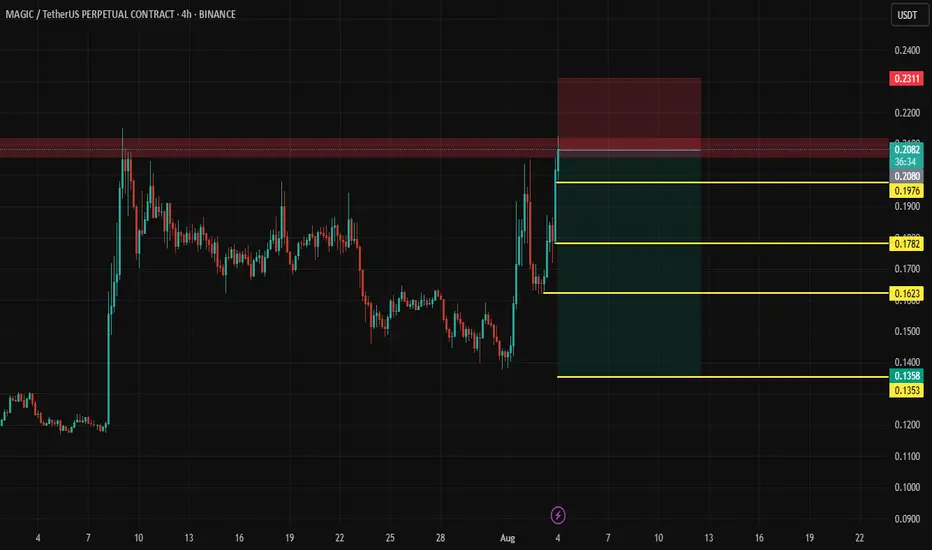
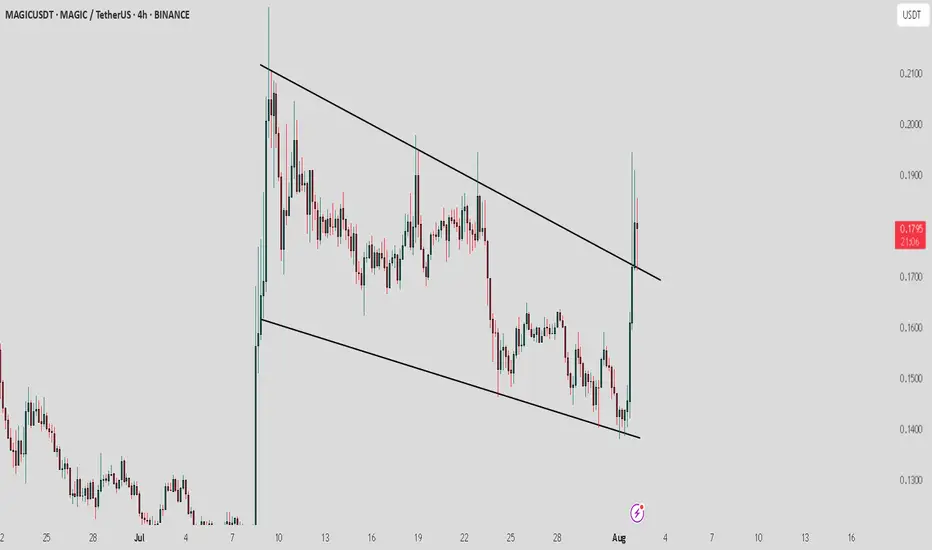
MAGIC/ USDT: Retest is in progress, keep a watch on confirmationMAGIC / USDT has broken out from the Trendline resistance and retest is still in progress . However, the market conditions are not ideal right now.
Bullish scenario : If the price holds above the breakout level and the retest is confirmed, the next target could be 0.19–0.21.
Bearish scenario : A failure to maintain above the breakout level may lead to a drop back to 0.15 or 0.13.
Pro Tip: Use tight stop-losses below the breakout point. Wait for confirmation before committing larger positions. Keep an eye on BTC dominance
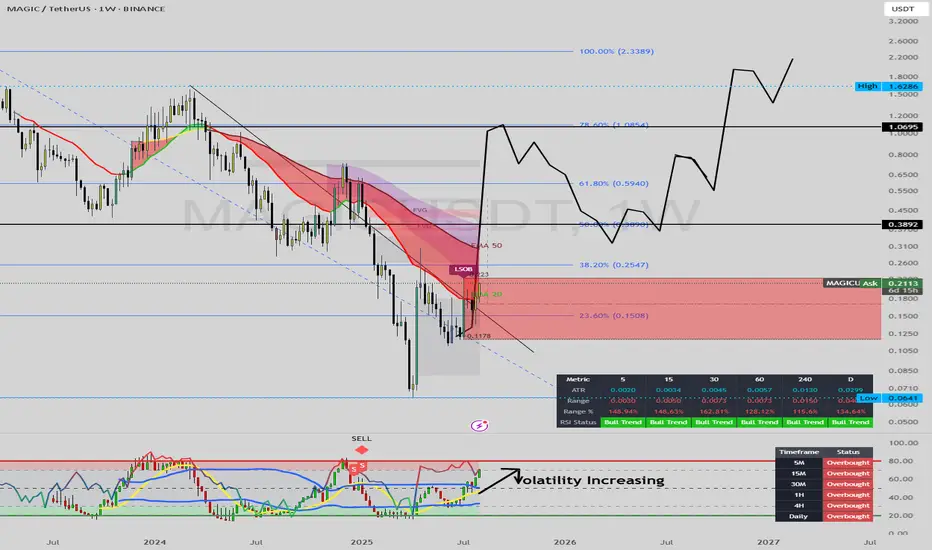
MAGICUSDT 1D#MAGIC is moving inside a symmetrical triangle — it's decision time: breakout or breakdown?
If it manages to break above the triangle resistance and the daily SMA200, the potential upside targets are:
🎯 $0.2214
🎯 $0.3187
🎯 $0.3973
🎯 $0.4759
However, in case of a breakdown and a daily candle close below the triangle, it may retest the support level at $0.1149.
⚠️ As always, use a tight stop-loss and apply proper risk management.
