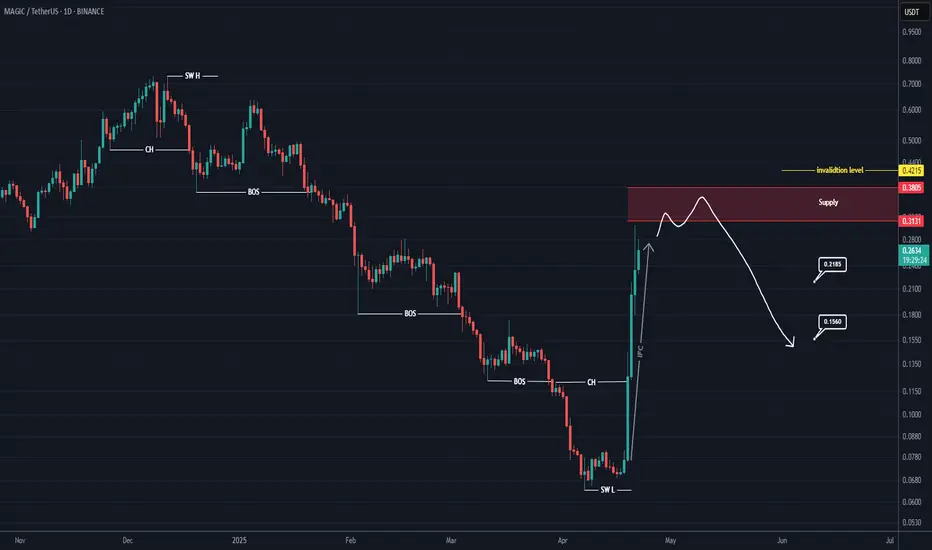
MAGIC Sell/Short Setup (1D)The symbol MAGIC has started a strong momentum towards the Supply zone. Since there haven't been significant pullbacks during this powerful move, and the supply zone is fresh and untouched, a price rejection is expected. If the price reaches the supply zone, we anticipate a rejection and will be looking for sell/short positions within the supply zone.
Targets are marked on the chart.
A daily candle closing above the invalidation level will negate this outlook.
For risk management, please don't forget stop loss and capital management
When we reach the first target, save some profit and then change the stop to entry
Comment if you have any questions
Thank You
MAGICUSDT trade ideas
#MAGIC | Huge buy volume with 2.3 negative funding, Whats next? #MAGIC 2.2% negative funding and it's rapidly increasing. If breaks $0.261 level we will see $0.320 level next. Rejection around $0.261 is a huge selloff towards $0.203.

MAGIC- MAGICUSDT CHART ANALYSİSHow NFT Technology Developed
NFT technology was created in 2017 based on Ethereum smart contracts. Since then, we have witnessed many successful NFT projects and deals. Stories like these perfectly describe the current and future possibilities of the technology.
The development of blockchain technology and the emergence of NFT services coincided with other processes in society and the economy. Many new players appeared in the stock markets, including non-professional traders and amateur investors.
The democratization of financial markets coincided with the pandemic: being in self-isolation, alone with their devices, many people began to pay attention to new financial instruments.
The information that arose around them also played a specific role in the “revival” of NFTs. The big names in the news headlines supporting NFTs couldn’t help but draw attention to them. That is one of the reasons why the success of the technology was inevitable.

MAGIC | Flag PatternThe Flag Pattern breakout is already established, massive bullish rally on daily timeframe✅
Expected 36% bullish wave in coming days🎯🚀
Use stop loss at 0.185 just below the support.
Risk to reward ratio 1 : 2

#MAGIC/USDT Ready for a massive move!#MAGICUSDT : Classic Bull flag. Buy the retest after the breakout, or wait for the retest.
Or Accumulate in this range: 0.2140, 0.2040 ,0.1955, 0.1885
Target: 0.2164, 0.2278, 0.2324, 0.2445, 0.2489
SL: 1786
Dyor, nfa
#Magic

MAGICUSDT – Bullish Structure Holding, Watch the Blue BoxesMAGICUSDT has exploded higher, surging over 120% in volume and more than doubling in price. This isn’t a random spike—it’s a clear signal that buyers are taking control. The blue boxes on the chart mark the most reliable support zones to watch for entries into this momentum.
🔵 Why This Matters Now
• Extraordinary Volume—when a coin leads the pack in daily volume, smart money is involved. You don’t want to miss moves like this.
• Support Blueprint—the blue boxes are where price has historically found footing. If MAGICUSDT holds above these areas, it’s a green light for further upside.
🚀 How to Trade It
Long on Confirmed Support
Wait for price to dip into a blue box, then show strength with a clean bounce on lower time frames. Look for sturdy close‑over signals—this is your cue to join the trend.
Adaptive Risk Management
I won’t insist on a bullish view if the market proves otherwise. If MAGICUSDT breaks below these support zones with conviction, I’ll step aside or even flip bearish once confirmed. No forcing trades.
Real‑Time Validation
Always trade with confirmation—lower time frame breakouts, CDV alignment, and solid volume behind the move. That’s how you turn good setups into great results.
💬 Why You Can Trust These Levels
Every support zone I share has been battle‑tested in live markets, and my track record—visible on my profile—speaks for itself. Most traders chase noise; you’ll learn to trade with clarity, precision, and confidence instead.
Imagine capturing this wave of buying pressure right from the blue box, letting the market prove itself first, and then stepping in to lock in gains. That’s the edge that keeps my followers coming back—and winning—time after time.
Stay patient, watch those blue boxes, and trade what you see. Good trades start with discipline.
📌I keep my charts clean and simple because I believe clarity leads to better decisions.
📌My approach is built on years of experience and a solid track record. I don’t claim to know it all but I’m confident in my ability to spot high-probability setups.
📌If you would like to learn how to use the heatmap, cumulative volume delta and volume footprint techniques that I use below to determine very accurate demand regions, you can send me a private message. I help anyone who wants it completely free of charge.
🔑I have a long list of my proven technique below:
🎯 ZENUSDT.P: Patience & Profitability | %230 Reaction from the Sniper Entry
🐶 DOGEUSDT.P: Next Move
🎨 RENDERUSDT.P: Opportunity of the Month
💎 ETHUSDT.P: Where to Retrace
🟢 BNBUSDT.P: Potential Surge
📊 BTC Dominance: Reaction Zone
🌊 WAVESUSDT.P: Demand Zone Potential
🟣 UNIUSDT.P: Long-Term Trade
🔵 XRPUSDT.P: Entry Zones
🔗 LINKUSDT.P: Follow The River
📈 BTCUSDT.P: Two Key Demand Zones
🟩 POLUSDT: Bullish Momentum
🌟 PENDLEUSDT.P: Where Opportunity Meets Precision
🔥 BTCUSDT.P: Liquidation of Highly Leveraged Longs
🌊 SOLUSDT.P: SOL's Dip - Your Opportunity
🐸 1000PEPEUSDT.P: Prime Bounce Zone Unlocked
🚀 ETHUSDT.P: Set to Explode - Don't Miss This Game Changer
🤖 IQUSDT: Smart Plan
⚡️ PONDUSDT: A Trade Not Taken Is Better Than a Losing One
💼 STMXUSDT: 2 Buying Areas
🐢 TURBOUSDT: Buy Zones and Buyer Presence
🌍 ICPUSDT.P: Massive Upside Potential | Check the Trade Update For Seeing Results
🟠 IDEXUSDT: Spot Buy Area | %26 Profit if You Trade with MSB
📌 USUALUSDT: Buyers Are Active + %70 Profit in Total
🌟 FORTHUSDT: Sniper Entry +%26 Reaction
🐳 QKCUSDT: Sniper Entry +%57 Reaction
📊 BTC.D: Retest of Key Area Highly Likely
📊 XNOUSDT %80 Reaction with a Simple Blue Box!
📊 BELUSDT Amazing %120 Reaction!
I stopped adding to the list because it's kinda tiring to add 5-10 charts in every move but you can check my profile and see that it goes on..
MAGIC/USDT NEW INCREASEMAGIC/USDT known with name : Treasure
NEW INCREASE
Showing new volume upcoming which can get confirmed for new uptrend
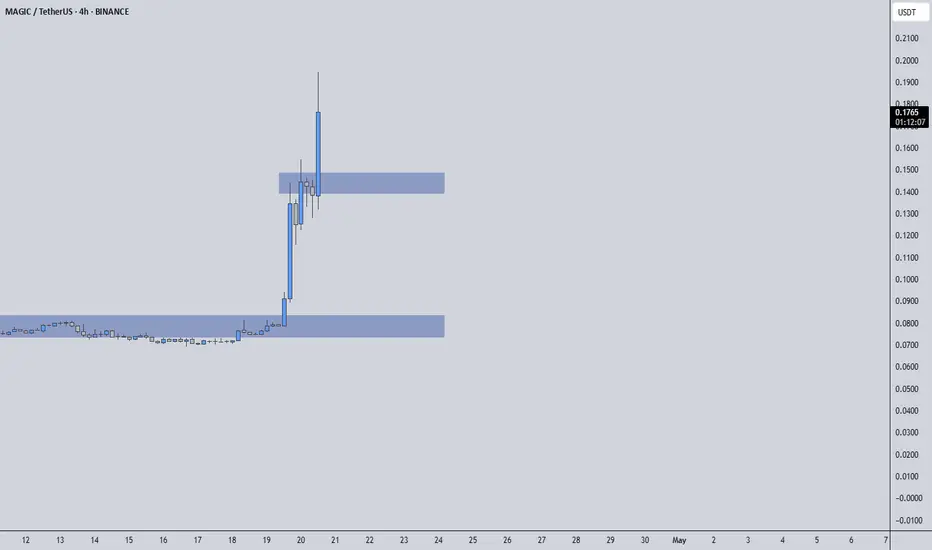
MAGICUSDT: The Blue Box Magic!MAGICUSDT: The Blue Box Magic! 🪄
MAGICUSDT traders, this blue box is a prime entry zone . It’s carefully crafted for those who know the value of precision and patience. This is where the magic happens—don't miss it!
Why the Blue Box?
Exceptional Demand Zone: This level has the potential to attract strong buyers.
Strategic Placement: Identified using CDV, liquidity heatmaps, volume profiles, and volume footprints.
Smart Risk Management: A calculated entry here balances risk and reward beautifully.
Pro Tip: Always wait for upward market structure breaks on lower timeframes before confirming your trade. Stay smart, stay patient!
Want to learn how to identify these golden zones? DM me, and I’ll show you how I use advanced tools to map the market.
If this resonates, boost, comment, and follow . 🚀
Let me tell you, folks, this is amazing. Nobody does analysis like I do. Believe me. If this helps you, don't forget to boost and comment! It’s a big deal, motivates me to share even more winning insights with you. Tremendous insights.
I keep my charts the best, clean, simple, and clear. You know it, I know it, clarity leads to better decisions. No question about it. My approach? Built on years of tremendous experience. Incredible track record. I don’t claim to know it all, but I spot high-probability setups like nobody else. Trust me.
Want to learn how to use the heatmap, cumulative volume delta, and volume footprint techniques I use to determine demand regions with stunning accuracy? Send me a private message—totally free, folks. That’s right. I help anyone who wants it, absolutely no charge. Unbelievable value.
Here’s the list, long list, great list, of some of my previous incredible analyses. Each one, a winner:
🎯 ZENUSDT.P: Patience & Profitability | %230 Reaction from the Sniper Entry
🐶 DOGEUSDT.P: Next Move
🎨 RENDERUSDT.P: Opportunity of the Month
💎 ETHUSDT.P: Where to Retrace
🟢 BNBUSDT.P: Potential Surge
📊 BTC Dominance: Reaction Zone
🌊 WAVESUSDT.P: Demand Zone Potential
🟣 UNIUSDT.P: Long-Term Trade
🔵 XRPUSDT.P: Entry Zones
🔗 LINKUSDT.P: Follow The River
📈 BTCUSDT.P: Two Key Demand Zones
🟩 POLUSDT: Bullish Momentum
🌟 PENDLEUSDT.P: Where Opportunity Meets Precision
🔥 BTCUSDT.P: Liquidation of Highly Leveraged Longs
🌊 SOLUSDT.P: SOL's Dip - Your Opportunity
🐸 1000PEPEUSDT.P: Prime Bounce Zone Unlocked
🚀 ETHUSDT.P: Set to Explode - Don't Miss This Game Changer
🤖 IQUSDT: Smart Plan
⚡️ PONDUSDT: A Trade Not Taken Is Better Than a Losing One
💼 STMXUSDT: 2 Buying Areas
🐢 TURBOUSDT: Buy Zones and Buyer Presence
🌍 ICPUSDT.P: Massive Upside Potential | Check the Trade Update For Seeing Results
🟠 IDEXUSDT: Spot Buy Area | %26 Profit if You Trade with MSB
📌 USUALUSDT: Buyers Are Active + %70 Profit in Total
🌟 FORTHUSDT: Sniper Entry +%26 Reaction
🐳 QKCUSDT: Sniper Entry +%57 Reaction
📊 BTC.D: Retest of Key Area Highly Likely
And that’s just the start. The list goes on and on, folks. It’s a tremendous list, the best. I stopped adding because, frankly, it’s tiring. So many wins. People are amazed. You can check my profile and see for yourself, winning moves, all the time. Believe me, nobody does it better.
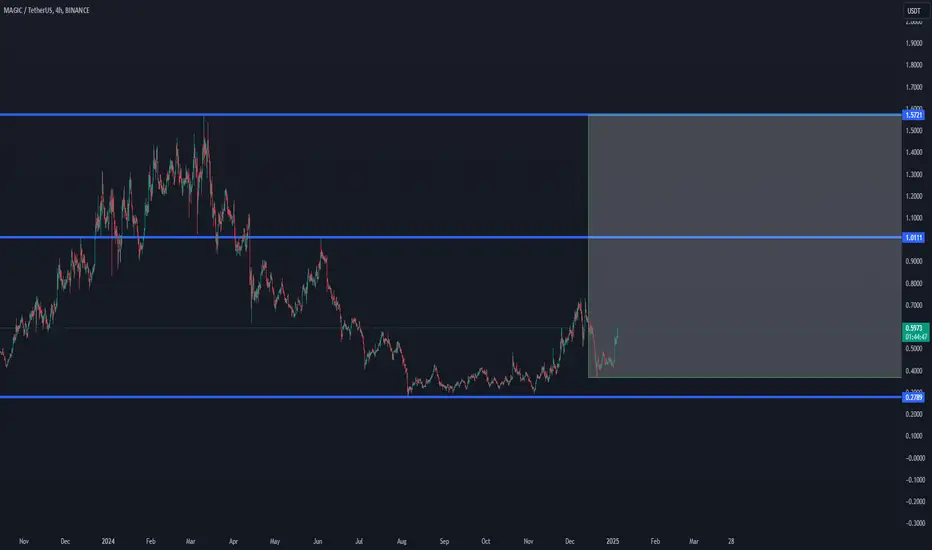
TradeCityPro | MAGIC: Daily Dynamics and Key Resistance Reaction👋 Welcome to TradeCityPro!
In this analysis, I will examine the MAGIC coin. This project falls under the category of crypto gaming and is one of the major projects in this field.
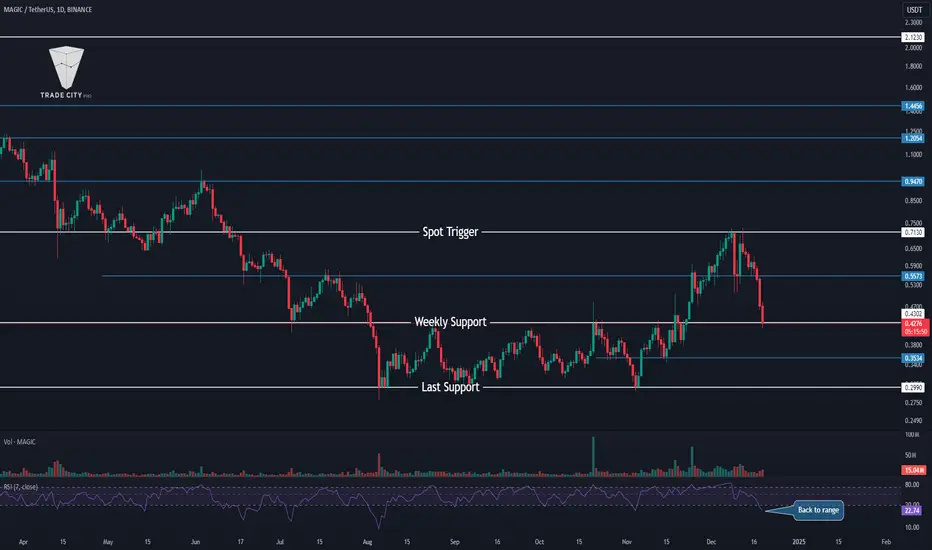
📅 Daily Timeframe: Reaction to Key Resistance In the daily timeframe, the price recorded its main support floor at $0.2983 and was in the Accumulation phase up to $0.4085. With the breakout above this box, an upward movement began towards the $0.7101 area. The volume of this leg was increasing, showing convergence with the trend.
🔍 Upon reaching the $0.7101 resistance, the price initiated a corrective phase on its first contact, starting with a short-term correction but then extending into a deeper pullback to $0.4085, and now it is again building a new structure.
📊 As we approach the New Year, the market volume gradually decreases, and personally, in this situation, I prefer to hold fewer positions and wait for the volume to re-enter the market.
🔽 If the $0.4085 level breaks, the market momentum will completely reset, and the price will create a new structure for building a new trend. The most important support for MAGIC is the $0.2983 area, which is the historical floor of this coin and a very strong demand zone. Entry of the RSI into the oversell area will increase the likelihood of breaking this resistance.
📈 For a long position, the main trigger for now is $0.7101, and if the price stabilizes above this key area, the next resistance will be $0.9344, which is a minor resistance. The main chart resistance currently is at $1.4473. While not the ATH, it is a very strong supply zone, and the price will need significant bullish momentum to break through this area.
🧩 A risky trigger for a long position is $0.4694, where breaking this trigger presents a suitable early long position but raises the risk of the position higher and increases the likelihood of hitting a stop loss.
📝 Final Thoughts
This analysis reflects our opinions and is not financial advice.
Share your thoughts in the comments, and don’t forget to share this analysis with your friends! ❤️

TradeCityPro | MAGICUSDT Market Correction and Fear!👋 Welcome to TradeCityPro Channel!
Let’s take a look together at a so-called bloody day in the market, as some friends call it, with a quick glance at the chart to analyze the events and help you make more thoughtful decisions without acting on your emotions.
🌟 Bitcoin Overview
Before starting the analysis, as usual, let’s take a look at Bitcoin. On the 1-hour timeframe, Bitcoin is experiencing red candles with high volume, indicating that it is currently correcting on its higher timeframe.
However, this event is accompanied by an increase in Bitcoin dominance, leading to more significant altcoin sell-offs. Naturally, altcoins are seeing larger red candles and experiencing steeper declines. But does this mean that the trend is changing?
From my perspective, no, and as long as Bitcoin remains above $80,000, we are still bullish and have no reason to exit. These red candles are merely corrections, which are entirely natural, as the market hasn’t seen any significant profit-taking since Bitcoin broke above $73,000. Make logical decisions, and during a bull market, don’t sell your assets prematurely unless they hit your predefined levels.
🌞 Daily Timeframe
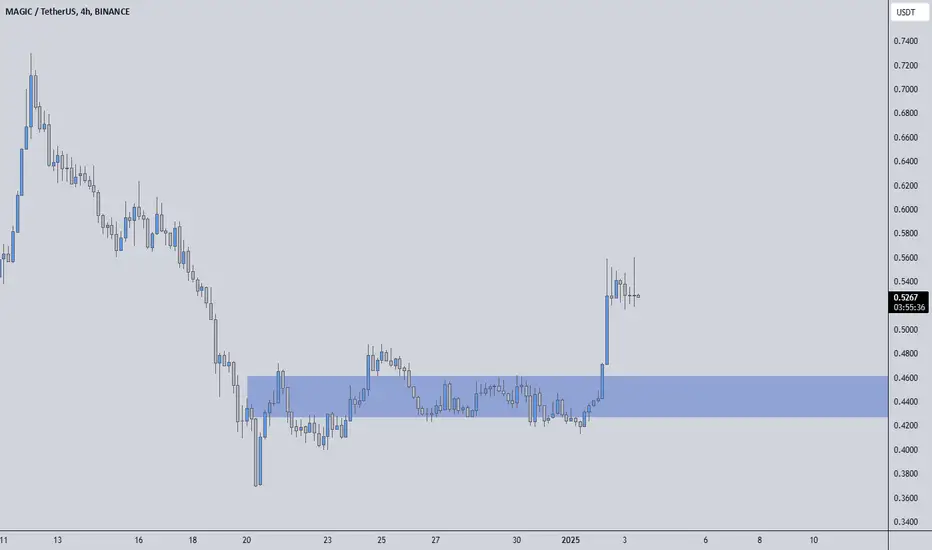
On the daily timeframe, MAGIC broke out of its 112-day range and resistance at $0.4302, moving toward the $0.7130 resistance, almost matching the size of its previous range.
Typically, the risk-to-reward ratio of patterns leads to the formation of significant support or resistance levels, shaping collective decisions.
After facing rejection and forming a lower high, MAGIC broke below $0.5573 and returned to the weekly box and support at $0.4302, which can act as a strong support for slowing down the bearish momentum and reversing it.
Currently, bearish momentum remains strong, and I refrain from buying during declines. However, if the support fails or the RSI re-enters its range, this could serve as a trigger for entry. For now, I prefer to watch, and if there is a significant reversal candle, it will be a pleasant surprise due to the strong momentum, with my stop-loss level already defined.
These conditions occur in bull markets and are completely natural. So, avoid FOMO and don’t let your emotions guide your decisions.
Practice risk and capital management, follow the analyses, and define your levels. For example, as long as Bitcoin remains above $80,000, I won’t sell and will even look for entry triggers. Futures positions currently make little sense, but if you have any, be sure to take profits and avoid greed!
📝 Final Thoughts
Stay calm, trade wisely, and let's capture the market's best opportunities!
This analysis reflects our opinions and is not financial advice.
Share your thoughts in the comments, and don’t forget to share this analysis with your friends! ❤️
$magicreclaimed key range where it broke down from as long as we stay above it
we head on up .simples
rsi in bullish territory

$MAGICUSDT has broke out of a long consolidation and goes to ATHBINANCE:MAGICUSDT is going to its ATHs very soon. Don't miss out!
The coin has been consolidating for a long time now and finally it is gaining momentum now. As soon as the coin gains interest from the public it will go parabolically up. Don't miss out. The move will happen literally over night. If you don't get on it in time you will miss it.
Finally I have to say that you must assess your risk carefully and make sure you use proper stop loss and protective measures. Good luck guys!
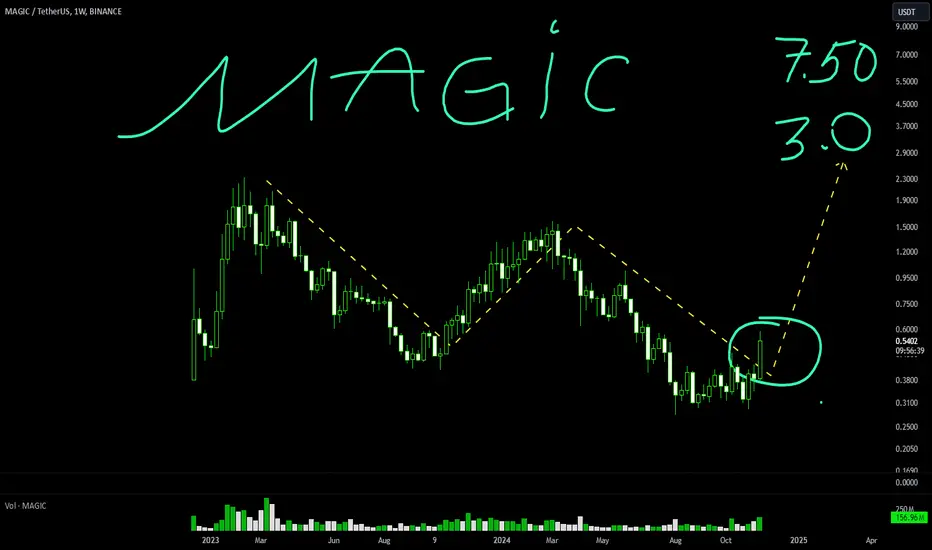
MAGIC: $0.55 | Nex Big thing in Gaming Probably as Epic as Sandbox Gala or Mana
at infant levels
fresh
new
and geared to gen alpha
backed up by serious Bankers
and packager of CELESTiA DRiFT ViRTUALS ..new projects with decent alpha returns to strong hands
strategy: own it
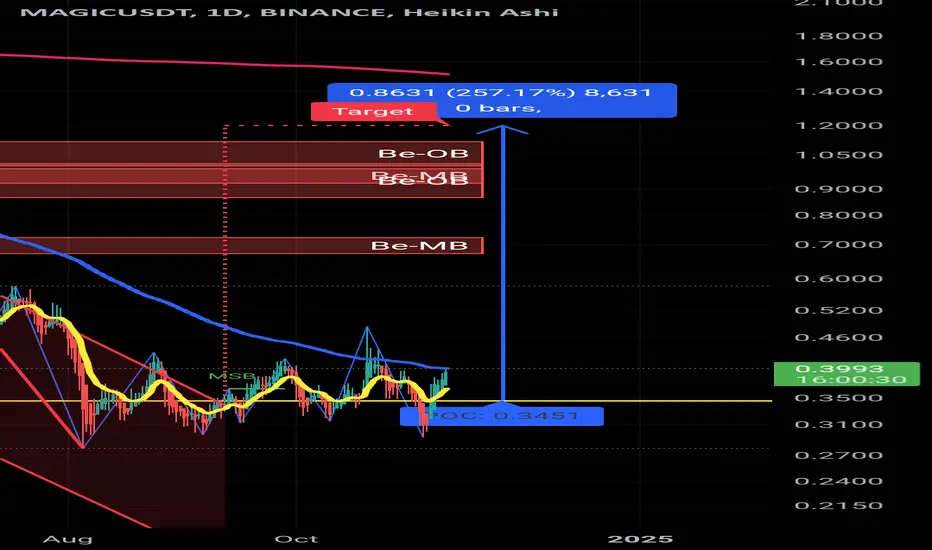
Long trade idea for MAGICUSDT Long trade idea for MAGICUSDT
Falling wedge pattern measured from Sept
Entry after pullback from 0.345 till 1.2
Potentially 257% profit
Short Magic BOOMTime for the soup! Come and get you some.. Time to dip down for the liq sweep and then we will fly!!!

Why is magic worthless?Does it prove that the team has been continuously selling magic, since they only control the candlestick chart during the downtrend?

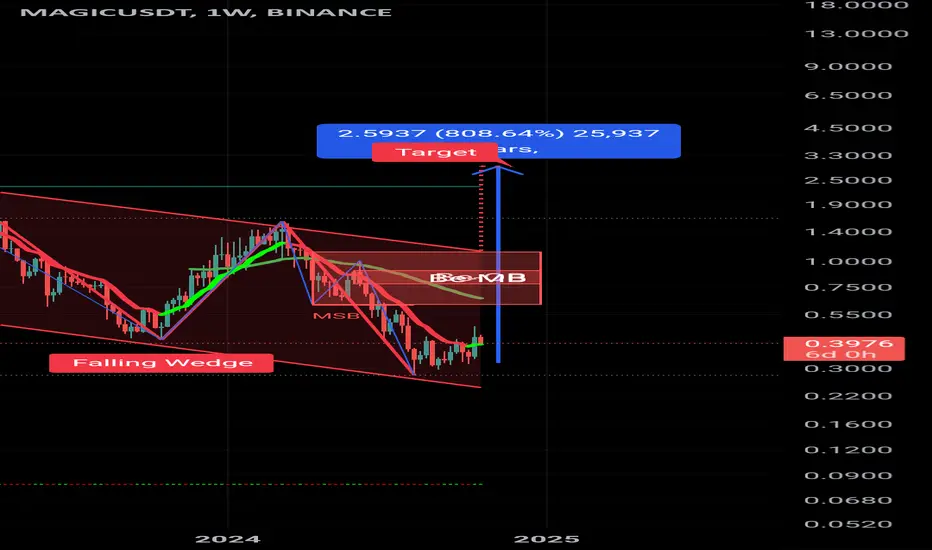
Rising Wedge Potential for MAGICLong term buy
On weekly timeframe, reversal at play.
Rising Wedge Potential for MAGIC
Potential 800%
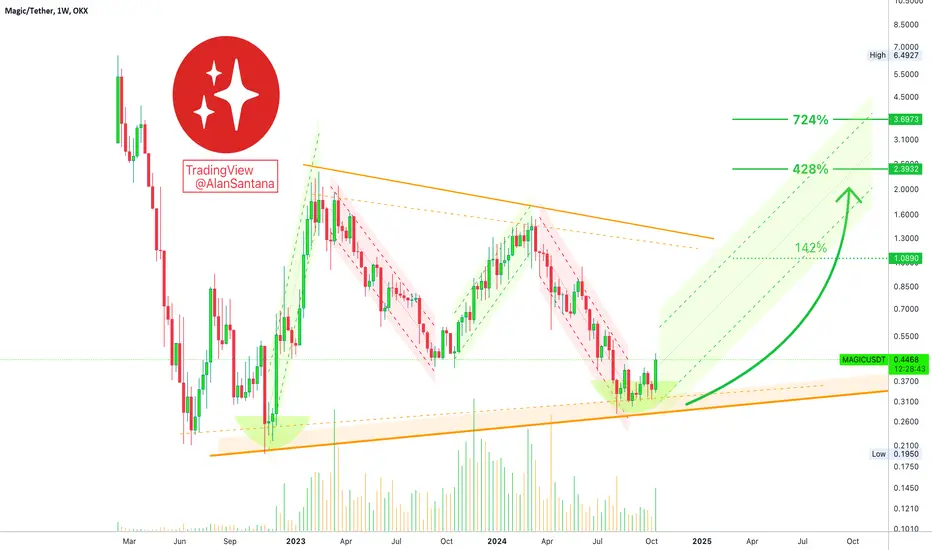
Magic Long-Term Higher Low Can Lead To 700% GrowthWe can see Magic (MAGICUSDT) moving within a channel and the lower boundary of this channel being tested. We know that prices tend to move to the other extreme once a boundary is challenged as either support or resistance.
➢ If support is tested, prices move to challenge resistance next.
➢ If resistance is challenged, prices move to test support next.
Here MAGICUSDT tested the lower rising trendline while at the same time producing a long-term higher low. This higher low can lead to a new bullish wave with medium-term targets reaching more than 400%. There is also an easy target around 140%.
Patience is key.
➖ You can find MAGICBTC, published a while back, by checking the 'Related publications' at the bottom of this post.
Thank you for reading.
Namaste.
$MAGIC is days away from an up trend rallyOMXTSE:MAGIC has broken above its falling trendline and is ready for a rally to its all time highs and above. New coins usually perform even better than old utility coins on the market. Don't miss out!

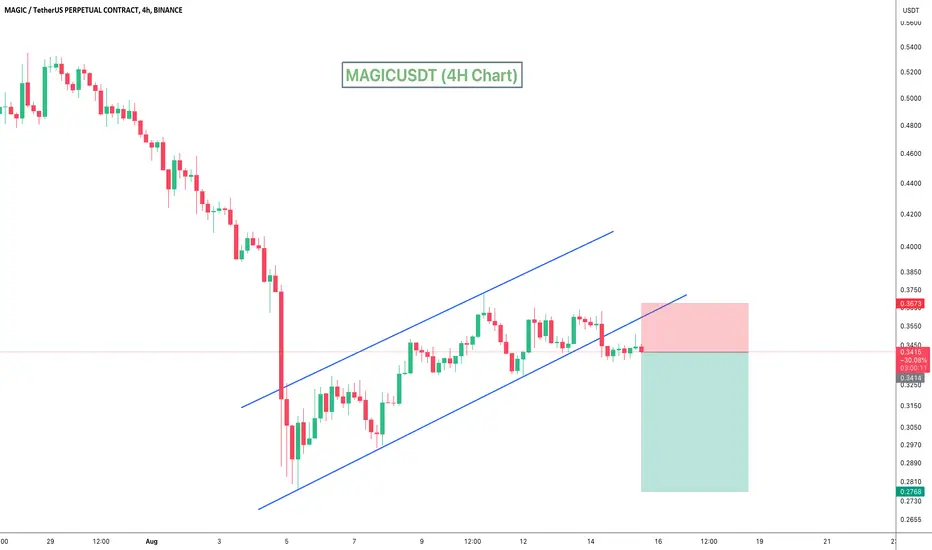
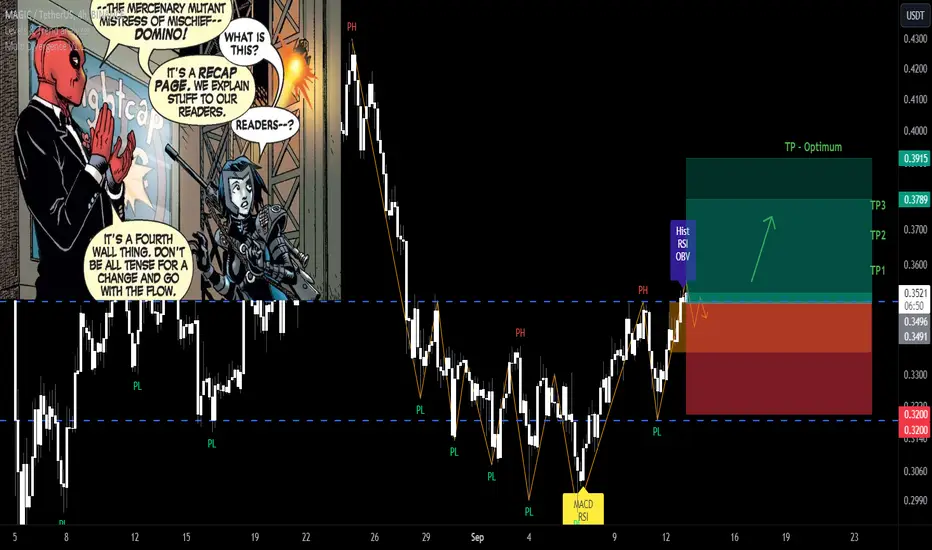
Do you like to see some magic!? / (MAGIC long setup)BINANCE:MAGICUSDT
COINBASE:MAGICUSD ]
Hello Traders
💥Long position on MAGIC
SL1 ---> Low-risk status: 3x-4x Leverage
SL2 ---> Mid-risk status: 5x-8x Leverage
👾The setup is active but expect the uncertain phase as well.
➡️Entry Area:
Yellow zone
⚡️TP:
0.3587
0.3683
0.3789
0.3915
🔴SL:
0.32
🧐The Alternate scenario:
If the price stabilizes below the trigger zone, the setup will be cancelled.
$MAGIC looking bullish!! RSI, MACD, Bounce from Weekly support!!Join our community and start your crypto journey today for:
In-depth market analysis
Accurate trade setups
Early access to trending altcoins
Life-changing profit potential
Hello everyone,
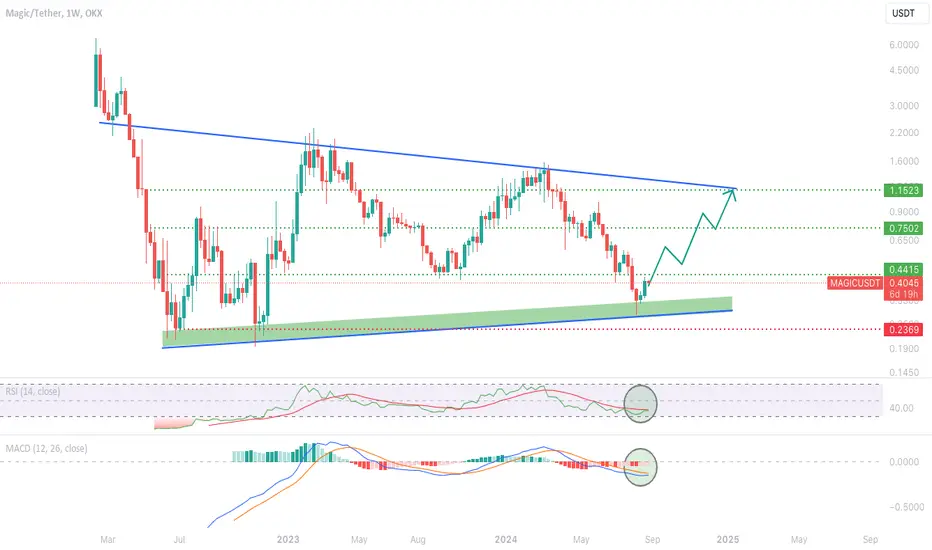
Let's analyse MAGICUSDT both fundamentally and technically.
FUNDAMENTAL ANALYSIS:
MAGIC is the essential fuel driving the Treasure Metaverse, a decentralized NFT gaming ecosystem powered by Arbitrum, a layer-2 solution on Ethereum. As a cross-game currency, MAGIC bridges various games, players, metaverses, and communities within the Web3 realm.
Beyond its utility, MAGIC is a deflationary ERC-20 token with a capped supply of 347,714,007 coins. This deflationary mechanism can potentially increase its value over time. Additionally, MAGIC holders play a vital role in governing the Treasure ecosystem through voting on key decisions.
TECHNICAL ANALYSIS:
MAGICUSDT is currently trading within a defined channel. After touching the lower support trendline, the price is showing signs of a rebound. A bullish rally towards the upper resistance level is anticipated. If the price falls back to the lower support line, a bullish wick is likely to form.
Technical indicators suggest a bullish bias:
MACD: A bullish crossover is expected on the MACD, indicating a potential uptrend.
RSI: The RSI is approaching the oversold region, suggesting a possible buying opportunity. A bullish crossover is also likely.
Support Levels:
$0.2369
Target Levels:
$0.4415
$0.7502
$1.1523
If you find this analysis helpful, please hit the like button to support my content! Share your thoughts in the comments and feel free to request any specific chart analysis you’d like to see.
Happy Trading!!
MAGICUSDT Bearish Flag PatternMAGICUSDT Technical analysis update.
The MAGICUSDT price has formed a bearish flag pattern on the 4H chart. Price broke below its support trendline, a 10-20% price drop is anticipated before a potential upward movement
Regards
Hexa