$MANA Trading SignalKey Zones: Clear supply zone above and demand zone below the current price.
Fair Value Gaps (FVGs):
3 FVGs on the 4H timeframe below the current price.
2 FVGs on the 1H timeframe above the current price.
Trend & Indicators:
Market structure remains bullish.
OBV is forming a rising wedge, indic

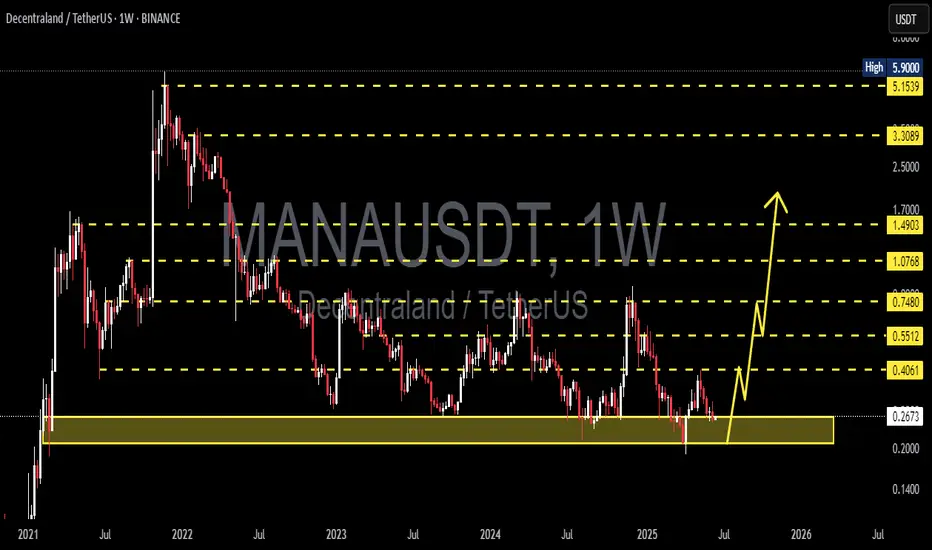
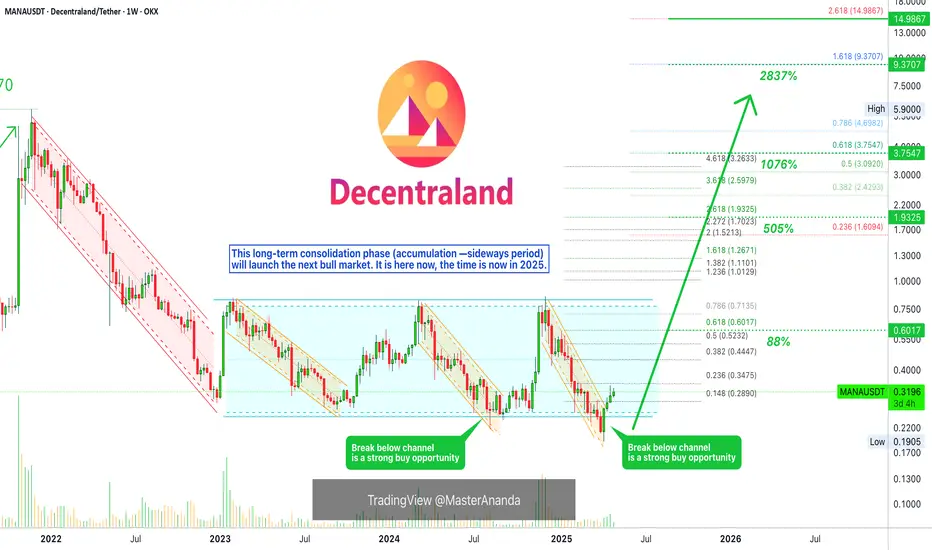
MANAUSDT 1W AnalysisMANA ~ 1W Analysis
#MANA Buy back gradually from this support block with a short term target of at least 20%+ from this support.
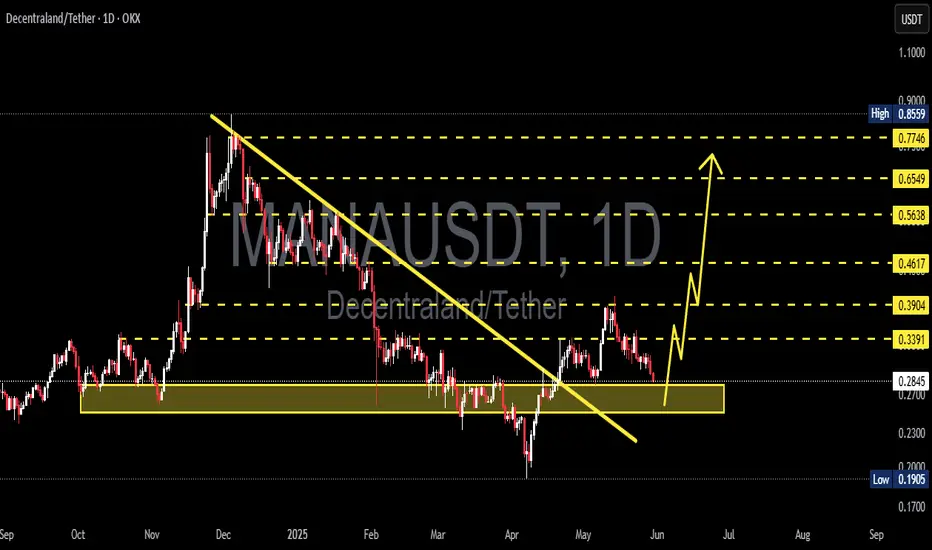
MANAUSDT 1D AnalysisMANA ~ 1D Analysis
#MANA Buy gradually from here if you still have confidence in this coin with a short term target of at least 15%++ from here.
#MANAUSDT (yellow pattern )At the bottom of the chart we see the yellow pattern,
its top has stopped growth three times and its bottom has stopped decline four times.
So exiting from the top of this pattern will be very interesting.
A stable break of the bottom of the pattern can also be a short position

ManaDecentraland token
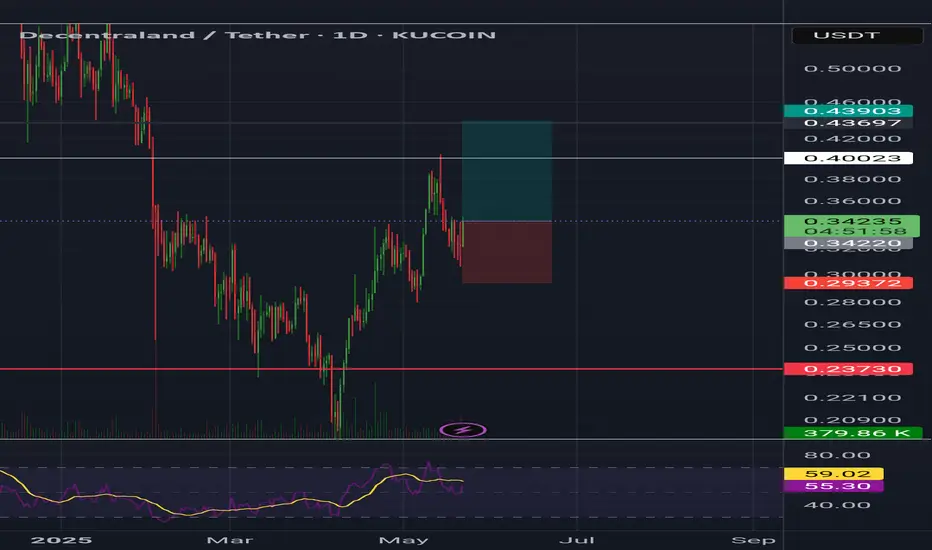
Mana usdt Daily analysis
Time frame daily
Risk rewards ratio =2 👈👌
Target = 0439 $
0.44$ - 0.46$ is strong resistance for mana
If price can break this resistance it will go to 0.6$
Is MANA About to Break Out?Are You Ready for It?Yello Paradisers, can you feel the calm before the storm? MANAUSDT is quietly setting up for what could become a major breakout move and most traders won’t see it coming until it’s already too late. That’s exactly the kind of opportunity we love to prepare for in advance.
💎#MANAUSDT has been conso

MANAAdded to my watchlist. Ideally I`ll be waiting retest and looking for LONG position.
But if we start moving from this level or closest support still there is a good entry in my opinion.
NFA - DYOR
MANA Testing Red Resistance🚀 OTC:MANA Testing Red Resistance – Target Ahead! 📈
OTC:MANA is currently testing the red resistance zone. If the price breaks through, the target could be the green line level! 📊
Let’s watch this breakout together! 💼💸

MANA Weekly AnalysisMANA Weekly Analysis
MANA is showing a positive divergence on the weekly timeframe.
This coin has the potential to rise toward the marked resistance levels.
It’s recommended to take profit at the first resistance level.
For added caution, you can rely on the lowest support zone as a safer stop level

Decentraland: Your Altcoins Choice (S5)I looked at MANA (Decentraland) recently, two weeks back, and the chart is the same but with the bullish reversal now confirmed.
MANAUSDT produced a major low last month and now is full green. This is the fourth week with growing prices and a bullish bias. A clear recovery. This recovery will lead
See all ideas
Summarizing what the indicators are suggesting.
Oscillators
Neutral
SellBuy
Strong sellStrong buy
Strong sellSellNeutralBuyStrong buy
Oscillators
Neutral
SellBuy
Strong sellStrong buy
Strong sellSellNeutralBuyStrong buy
Summary
Neutral
SellBuy
Strong sellStrong buy
Strong sellSellNeutralBuyStrong buy
Summary
Neutral
SellBuy
Strong sellStrong buy
Strong sellSellNeutralBuyStrong buy
Summary
Neutral
SellBuy
Strong sellStrong buy
Strong sellSellNeutralBuyStrong buy
Moving Averages
Neutral
SellBuy
Strong sellStrong buy
Strong sellSellNeutralBuyStrong buy
Moving Averages
Neutral
SellBuy
Strong sellStrong buy
Strong sellSellNeutralBuyStrong buy
Displays a symbol's price movements over previous years to identify recurring trends.