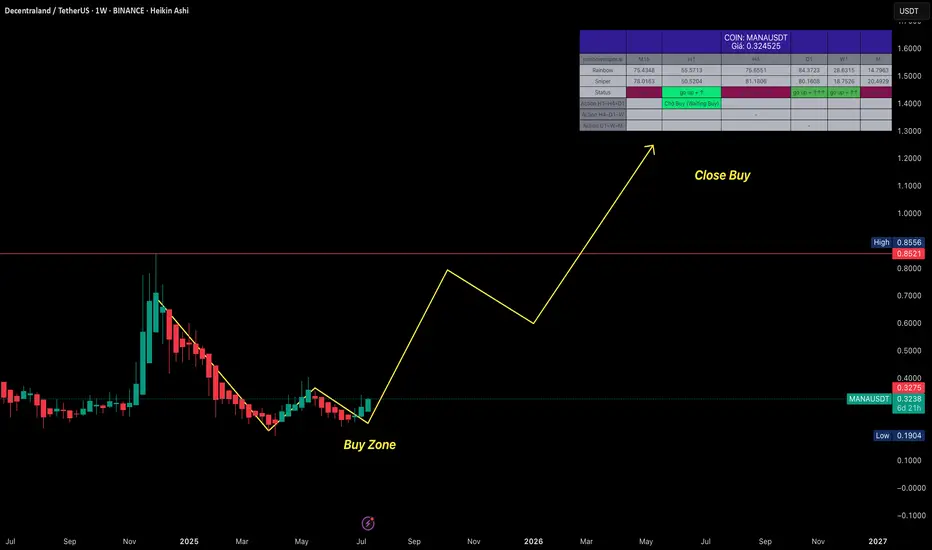
MANAUSDT – Long-term Spot Buy RecommendationMANAUSDT – Long-term Spot Buy Recommendation
Context: MANAUSDT has undergone an extended bottoming process across both the Monthly (M) and Weekly (W) timeframes. The downtrend momentum is exhausted, and a major uptrend wave on W and M is about to begin.
Trade Type: Long-term Spot Investment
E
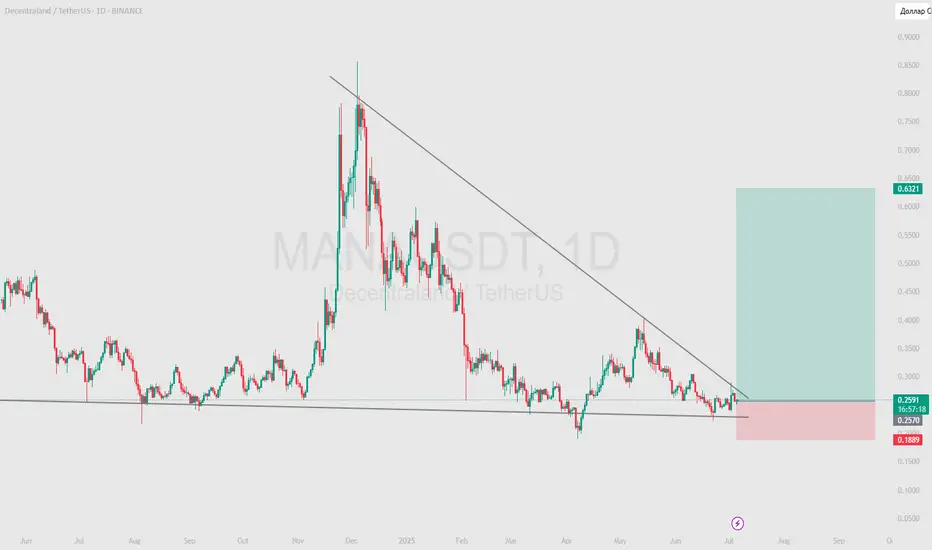
MANA - move in support and then shoot at 150%Price Prediction:
Short Term (1-3 Days):
The price may continue to move within the falling wedge, maintaining a downward trajectory. However, there is a high probability of testing the lower boundary of the wedge ($0.1900 USDT).
If the price holds above $0.1900 USDT, this could signal a corrective r
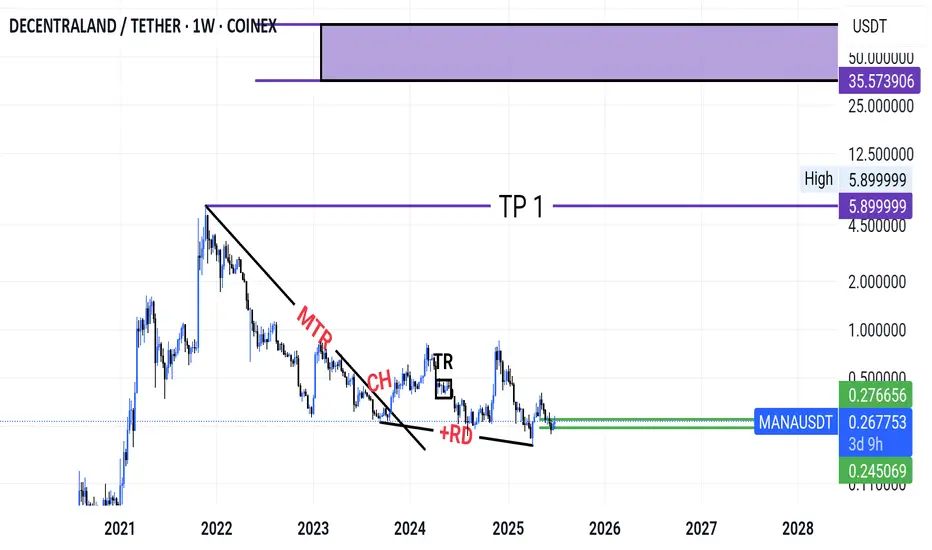
Manausdt
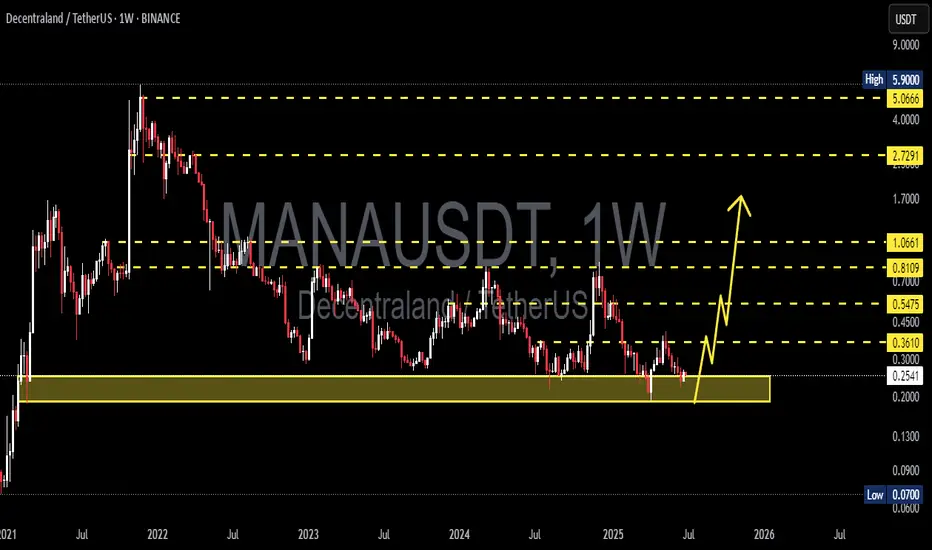
"Given the weekly timeframe and the trend change from bearish to ranging, it is expected that the MANA token will move from this green zone toward its first target, namely TP1."
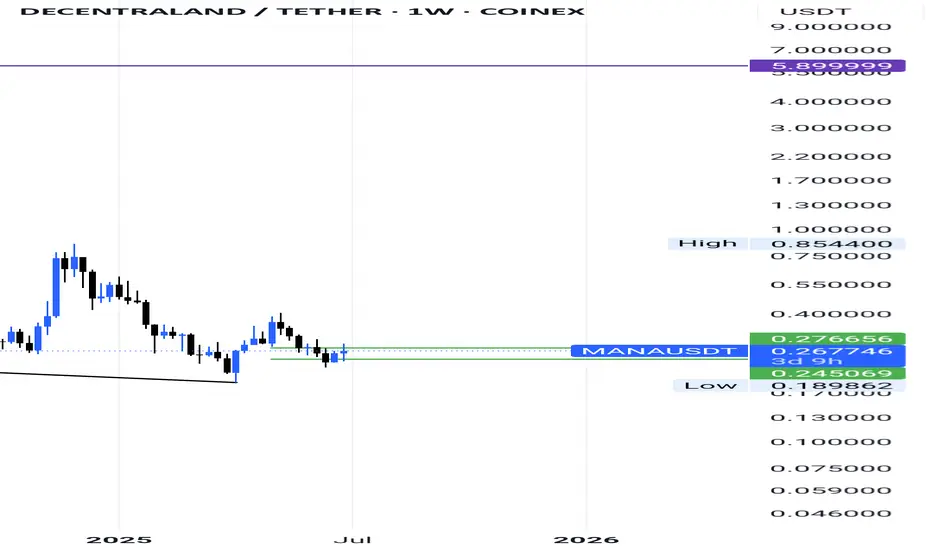
Manausdt
"Given the weekly timeframe and the trend change from bearish to ranging, it is expected that the MANA token will move from this green zone toward its first target, namely TP1."
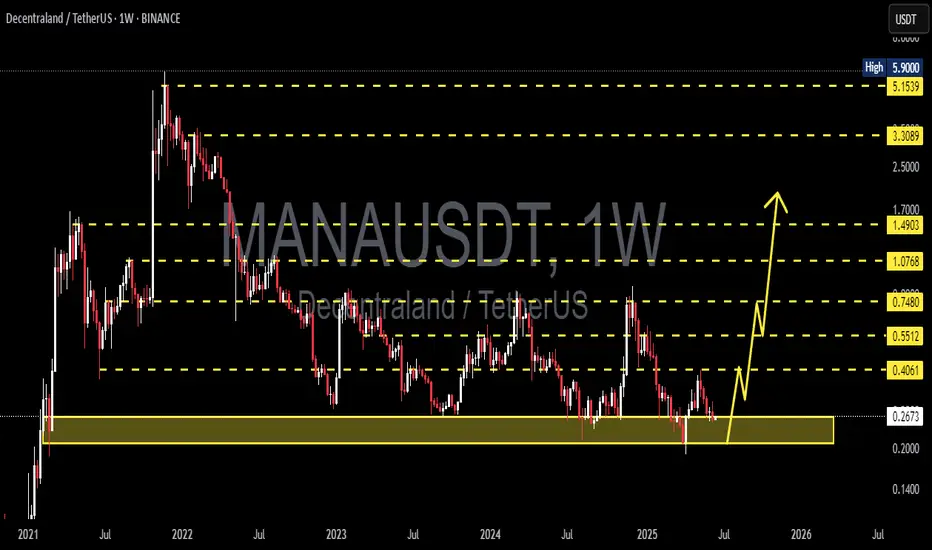
MANA/USDT Rebounding from Key Weekly Demand Zone – Path to $1?🔶 Strong Support Zone (Demand Zone):
MANA/USDT is currently testing a major weekly support area between $0.20 – $0.30, a zone that has historically acted as a strong demand level since 2021. Price has bounced off this region multiple times, indicating strong buyer interest and potential for a bulli
$MANA Trading SignalKey Zones: Clear supply zone above and demand zone below the current price.
Fair Value Gaps (FVGs):
3 FVGs on the 4H timeframe below the current price.
2 FVGs on the 1H timeframe above the current price.
Trend & Indicators:
Market structure remains bullish.
OBV is forming a rising wedge, indic

MANAUSDT 1W AnalysisMANA ~ 1W Analysis
#MANA Buy back gradually from this support block with a short term target of at least 20%+ from this support.
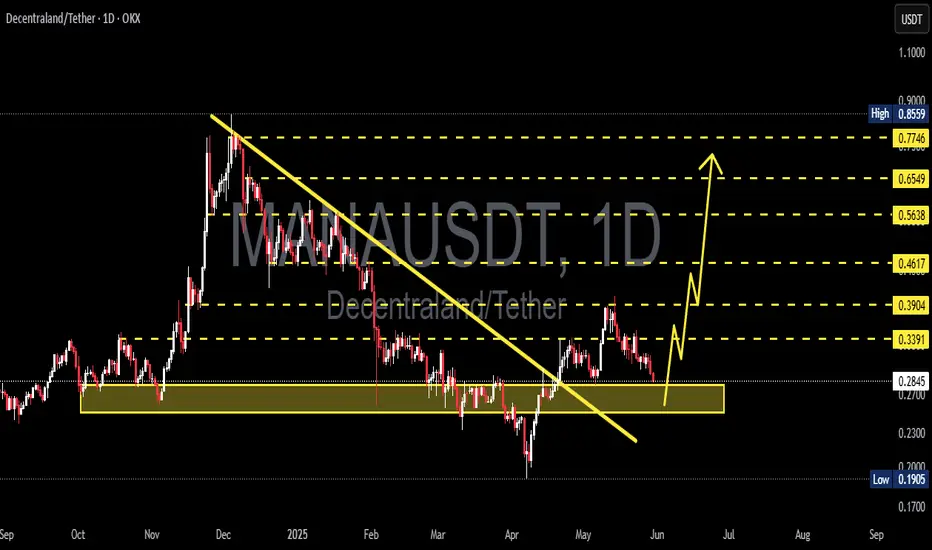
MANAUSDT 1D AnalysisMANA ~ 1D Analysis
#MANA Buy gradually from here if you still have confidence in this coin with a short term target of at least 15%++ from here.
#MANAUSDT (yellow pattern )At the bottom of the chart we see the yellow pattern,
its top has stopped growth three times and its bottom has stopped decline four times.
So exiting from the top of this pattern will be very interesting.
A stable break of the bottom of the pattern can also be a short position

ManaDecentraland token
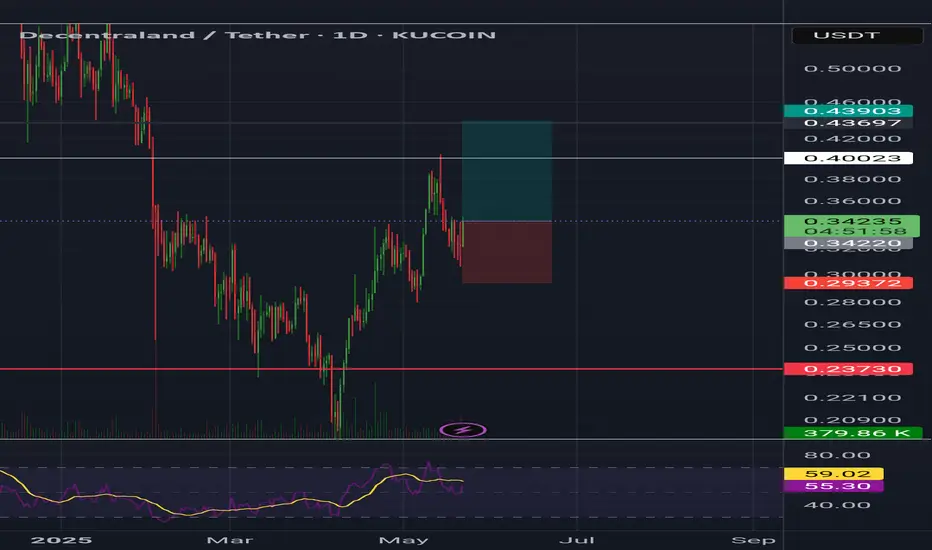
Mana usdt Daily analysis
Time frame daily
Risk rewards ratio =2 👈👌
Target = 0439 $
0.44$ - 0.46$ is strong resistance for mana
If price can break this resistance it will go to 0.6$
See all ideas
Summarizing what the indicators are suggesting.
Oscillators
Neutral
SellBuy
Strong sellStrong buy
Strong sellSellNeutralBuyStrong buy
Oscillators
Neutral
SellBuy
Strong sellStrong buy
Strong sellSellNeutralBuyStrong buy
Summary
Neutral
SellBuy
Strong sellStrong buy
Strong sellSellNeutralBuyStrong buy
Summary
Neutral
SellBuy
Strong sellStrong buy
Strong sellSellNeutralBuyStrong buy
Summary
Neutral
SellBuy
Strong sellStrong buy
Strong sellSellNeutralBuyStrong buy
Moving Averages
Neutral
SellBuy
Strong sellStrong buy
Strong sellSellNeutralBuyStrong buy
Moving Averages
Neutral
SellBuy
Strong sellStrong buy
Strong sellSellNeutralBuyStrong buy
Displays a symbol's price movements over previous years to identify recurring trends.